


Introduction
Sarcomas are a diverse group of rare and heterogeneous malignancies of mesenchymal origin [1, 2]. They comprise 50 histological types that can be broadly classified into bone sarcomas, including osteosarcoma, Ewing’s sarcoma, chondrosarcoma, and soft-tissue sarcomas, including liposarcoma, leiomyosarcoma, undifferentiated soft-tissue sarcoma, fibrosarcoma, and synovial sarcoma [3, 4]. In the USA, 13,460 new soft-tissue sarcoma and 3,610 new bone sarcoma cases are reported annually [5]. In recent decades, great efforts have been made in sarcoma research. However, there have been no significant improvements in sarcoma treatment for nearly 30 years. In addition, the prognosis of sarcoma is not satisfactory due to local recurrence and distant metastases [6]. Therefore, it is imperative to develop reliable prognostic tools to accurately estimate patient outcomes and improve personalized therapy for patients with sarcoma.
Oxidative stress is the result of excess reactive oxygen species (ROS) due to an imbalance between ROS production and antioxidant responses [7, 8]. ROS are implicated in tumor growth, invasion, and metastasis, and cellular resistance to therapy [9]. ROS are produced inside the cells from both endogenous and exogenous sources [10]. Although low levels of ROS can be beneficial, excessive accumulation can promote cancer [11]. It is becoming increasingly evident that ROS play crucial roles in the survival, proliferation, invasion, angiogenesis, and metastasis of tumor cells [12–14]. Under normal conditions, ROS production is balanced by ROS scavenging through the antioxidant defense machinery, resulting in redox homeostasis. Studies using preclinical and clinical models have indicated that antioxidants reduce cancer risk [15, 16]. Antioxidant-related genes may be related to tumorigenesis as they play a major role in regulating oxidative stress and protecting against ROS [17]. Studying the relationship between antioxidant genes and tumorigenesis may facilitate the discovery of novel targets for predicated prognosis and treatment [18]. However, the prognostic values of antioxidant-related genes and their biological functions in sarcomas remain rudimentary and inconclusive.
In the present study, we aimed to construct and validate prognostic antioxidant-related gene signatures for overall survival (OS) and disease-free survival (DFS) in sarcoma patients using gene expression profiling data from The Cancer Genome Atlas (TCGA) and Gene Expression Omnibus (GEO) databases. In addition, we performed functional analysis and compared tumor immunity between high- and low-risk groups. On the basis of the signatures and other risk factors, we constructed predictive nomogram models. For convenient clinical application, we built web-based calculators.
Results
Establishment of prognostic signatures based on antioxidant genes
To narrow down candidate antioxidant genes, we performed univariate Cox regression analysis and identified 27 and 26 OS-related antioxidant genes in the TCGA-Sarcoma (TGCA-SARC) and GSE17674 datasets, respectively (Supplementary Table 2). Among these, five overlapping genes were selected for establishing the OS signature (Figure 1A). Similarly, we identified 18 and 48 DFS-related antioxidant genes in the TCGA-SARC and GSE30929 datasets (Supplementary Table 3), respectively; 10 overlapping genes were selected for establishing the DFS-related signature (Figure 1B).
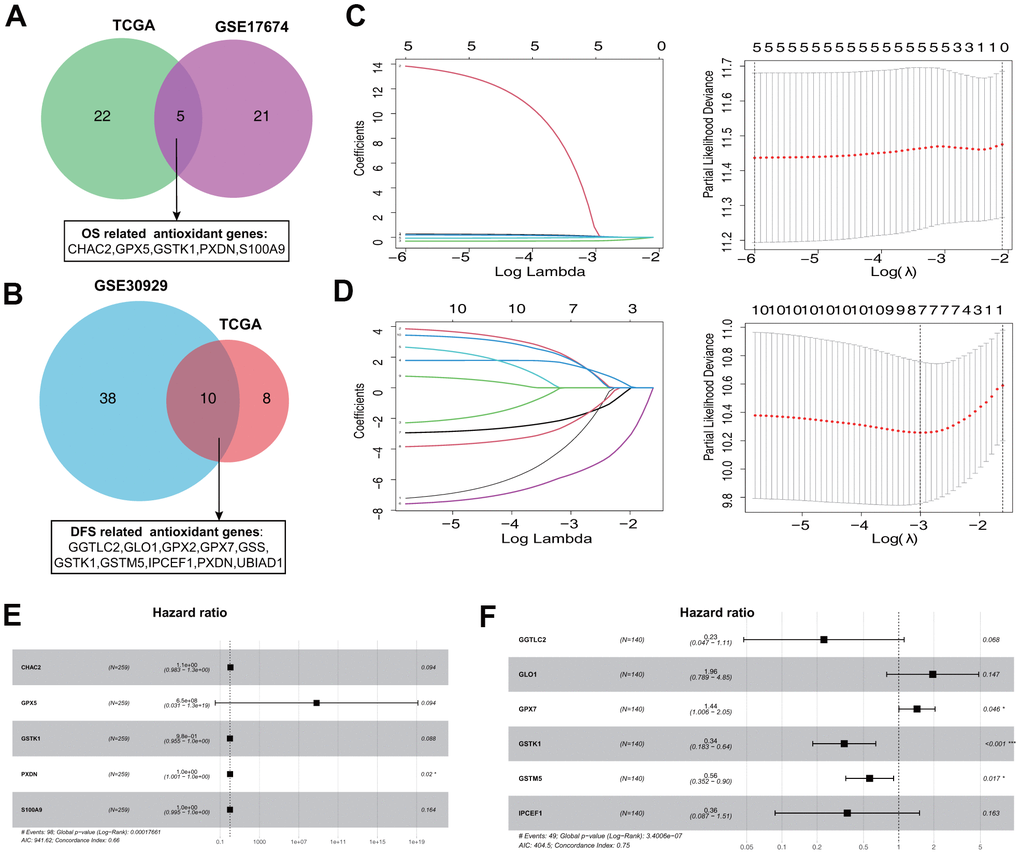
Figure 1. Establishment of prognostic antioxidant gene signatures in the training cohort. (A) Overlapping overall survival (OS)-related antioxidant genes in The Cancer Genome Atlas (TCGA) Sarcoma (TCGA-SARC) and Gene Expression Omnibus (GEO) GSE17674 datasets. (B) Overlapping disease free survival (DFS)-related antioxidant genes in the TCGA-SARC and GSE30929 datasets. (C) Least absolute shrinkage and selection operator (LASSO) regression analysis to screen the antioxidant genes for the predictive OS signature. (D) LASSO regression analysis to screen the antioxidant genes for the predictive DFS signature. (E) Forest plot of multivariate Cox regression analysis of the genes in the OS signature. (F) Forest plot of multivariate Cox regression analysis of the genes in the DFS signature.
The five OS-related and 10 DFS-related antioxidant genes were subjected to tenfold cross-validated LASSO regression to generate the best gene model. The LASSO coefficients were plotted against the log(k) values, and five OS-related genes and seven DFS-related genes were selected (Figure 1C, 1D). On the basis of multivariate Cox regression analysis results, five genes (CHAC2, GPX5, GSTK1, PXDN, and S100A9) associated with OS and six genes (GGTLC2, GLO1, GPX7, GSTK1, GSTM5, and IPCEF1) associated with DFS were selected for establishing risk signatures (Figure 1E, 1F). The prognostic risk score formula was specifically constructed by the multivariate Cox regression analyses (Tables 1, 2).
Table 1. Overall survival-related antioxidant gene signature identified through LASSO and Cox regression.
| Gene symbol | Coefficient | Gene product |
| CHAC2 | 0.103700036 | ChaC glutathione-specific gamma-glutamylcyclotransferase 2 |
| GPX5 | 20.29092431 | glutathione peroxidase 5 |
| GSTK1 | –0.021559973 | glutathione S-transferase kappa 1 |
| PXDN | 0.00814439 | peroxidasin |
| S100A9 | –0.002047307 | S100 calcium-binding protein A9 |
Table 2. Disease-free survival-related antioxidant gene signature identified through LASSO and Cox regression.
| Gene symbol | Coefficient | Gene product |
| GGTLC2 | –1.474979614 | gamma-glutamyltransferase light chain 2 |
| GLO1 | 0.671088392 | glyoxalase I |
| GPX7 | 0.361529489 | glutathione peroxidase 7 |
| GSTK1 | –1.073983673 | glutathione S-transferase kappa 1 |
| GSTM5 | –0.572788673 | glutathione S-transferase mu 5 |
| IPCEF1 | –1.013381673 | interaction protein for cytohesin exchange factors 1 |
Evaluation of the signatures in the training and validation cohorts
Based on the established OS and DFS risk signatures, the risk score for each patient with sarcoma was calculated. The median score was set as the cutoff value for categorizing sarcoma patients into low- (≤ median score) and high-risk (> median score) groups.
The risk score distribution for OS prediction in the TCGA-SARC dataset is shown in Figure 2A, and the distribution of OS status ranked by risk score is presented in Figure 2B. The expression profiles of the five antioxidant genes in the two groups are shown in Figure 2C. Survival analysis revealed that patients in the low-risk group had a better OS than those in the high-risk group (Figure 2D). In time-dependent receiver operating characteristic (ROC) analysis, the areas under the ROC curves (AUCs) for 2-, 4-, and 6-year OS were 0.678, 0.668, and 0.726, respectively (Figure 2E).
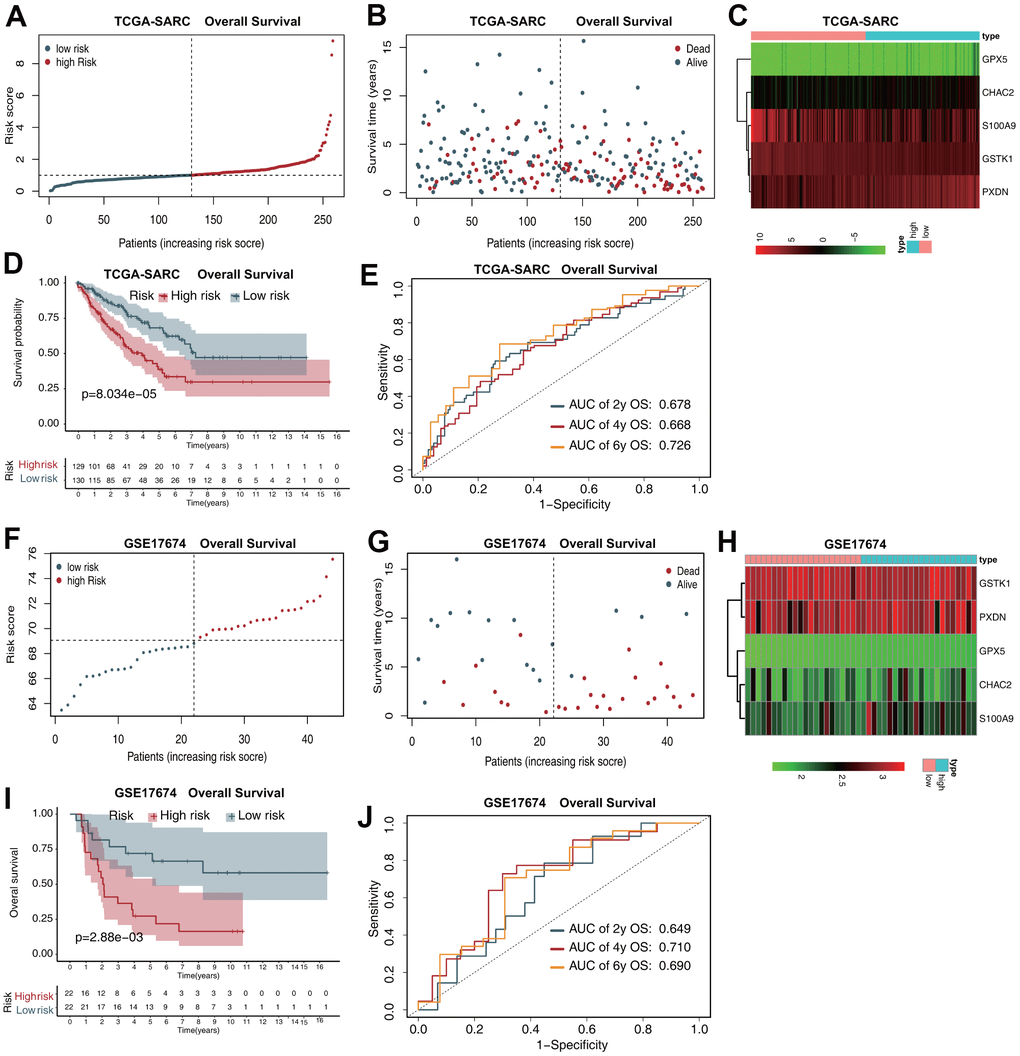
Figure 2. The five-gene prognostic signature predicts the OS of patients with sarcoma. (A) Risk score distribution in the TCGA-SARC dataset. (B) OS time distribution in the TCGA-SARC dataset. (C) Expression heatmap of the five genes in the TCGA-SARC dataset. (D) Kaplan–Meier analysis of OS based on the signature in the TCGA-SARC cohort. (E) Receiver operating characteristic (ROC) analysis of OS prediction in the TCGA-SARC cohort. (F) Risk score distribution in the GSE17674 dataset. (G) OS time distribution in the GSE17674 dataset. (H) Expression heatmap of the five genes in the TCGA-SARC dataset. (I) Kaplan–Meier analysis of OS based on the signature in the GSE17674 cohort. (J) ROC analysis of OS prediction in the GSE17674 cohort.
The risk score distribution for OS prediction in the GSE17674 dataset is shown in Figure 2F, and the distribution of OS status ranked by risk score is presented in Figure 2G. The expression profiles of the five antioxidant genes in the two groups are shown in Figure 2H. Survival analysis revealed that patients in the low-risk group had a better OS than those in the high-risk group (Figure 2I). The AUCs in time-dependent ROC analysis for 2-, 4-, and 6-year OS were 0.649, 0.710, and 0.690, respectively (Figure 2J).
The risk score distribution for DFS prediction in the TCGA-SARC dataset is shown in Figure 3A, and the distribution of DFS status ranked by risk score is presented in Figure 3B. The expression profiles of the five antioxidant genes in the two groups are shown in Figure 3C. Survival analysis revealed that patients in the low-risk group had a better DFS than those in the high-risk group (Figure 3D). The AUCs in time-dependent ROC analysis for 2-, 4-, and 6-year DFS were 0.654, 0.668, and 0.743, respectively (Figure 3E).
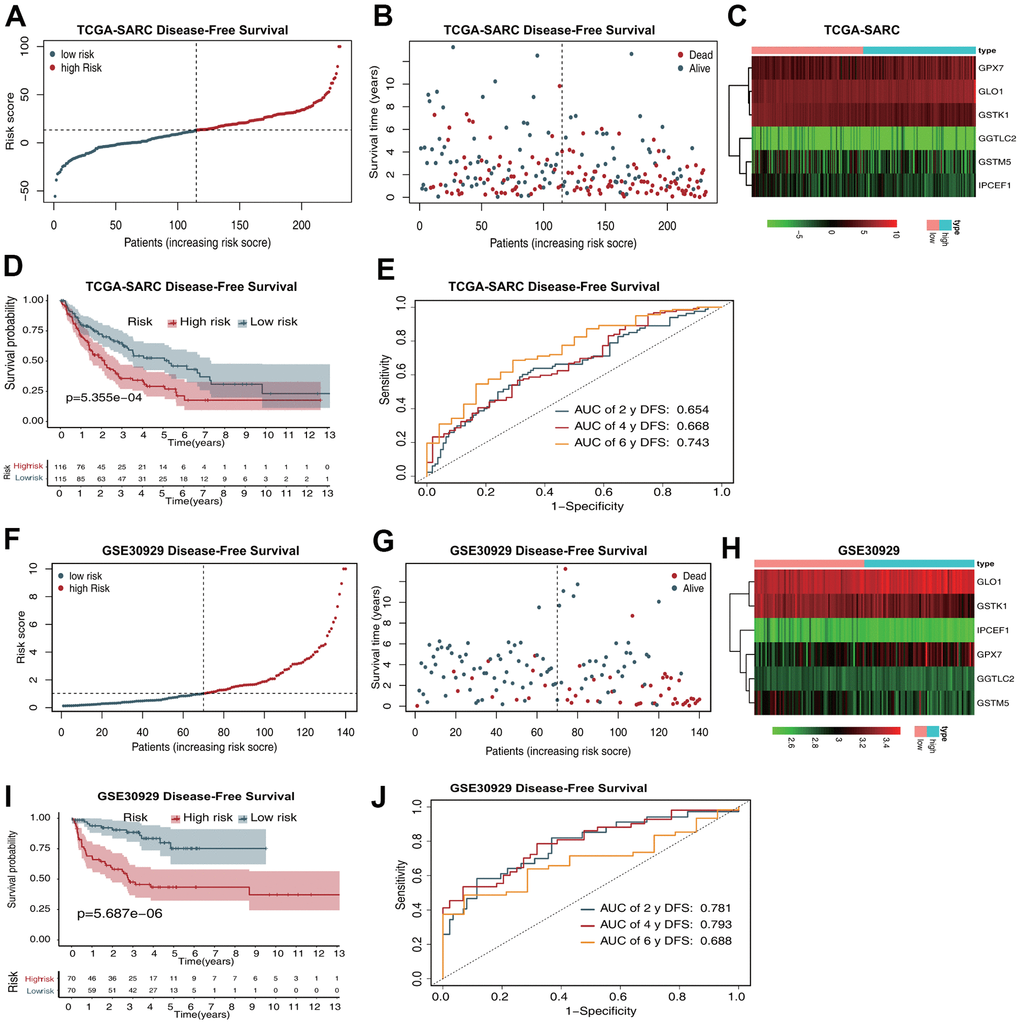
Figure 3. The six-gene prognostic signature predicts the DFS of patients with sarcoma. (A) Risk score distribution in the TCGA-SARC dataset. (B) OS time distribution in the TCGA-SARC dataset. (C) Expression heatmap of the six genes in the TCGA-SARC dataset. (D) Kaplan–Meier analysis of OS based on the signature in the TCGA-SARC cohort. (E) ROC analysis of OS prediction in the TCGA-SARC cohort. (F) Risk score distribution in the GSE30929 dataset. (G) OS time distribution in the GSE30929 dataset. (H) Expression heatmap of the six genes in the TCGA-SARC dataset. (I) Kaplan–Meier analysis of OS based on the signature in the GSE30929 cohort. (J) ROC analysis of OS prediction in the GSE30929 cohort.
The risk score distribution for DFS prediction in the GSE17674 dataset is shown in Figure 3F, and the distribution of DFS status ranked by risk score is presented in Figure 3G. The expression profiles of the five antioxidant genes in the two groups are shown in Figure 3H. Survival analysis revealed that patients in the low-risk group had a better DFS than those in the high-risk group (Figure 3I). The AUCs in time-dependent ROC analysis for 2-, 4-, and 6-year DFS were 0.781, 0.793, and 0.688, respectively (Figure 3J).
Gene mutation analysis and gene set enrichment analysis (GSEA)
Gene mutation analysis of the 10 antioxidant genes included in the OS and DFS signatures showed that S100A9, GPX7, IPCEF1, PXDN, and GPX5 were the most frequently mutated genes. Notably, amplification was the most common type of mutation, and S100A9, IPCEF1, and GPX7 were frequently amplified in sarcoma (Figure 4A). Subsequently, we performed GSEA based on Gene Ontology (GO) functional annotation and Kyoto Encyclopedia of Genes and Genomes (KEGG) pathway annotation in the low- and high-risk groups. The top five GO terms and KEGG pathways that were significantly enriched in the high-risk group are shown in Figure 4B, 4C.
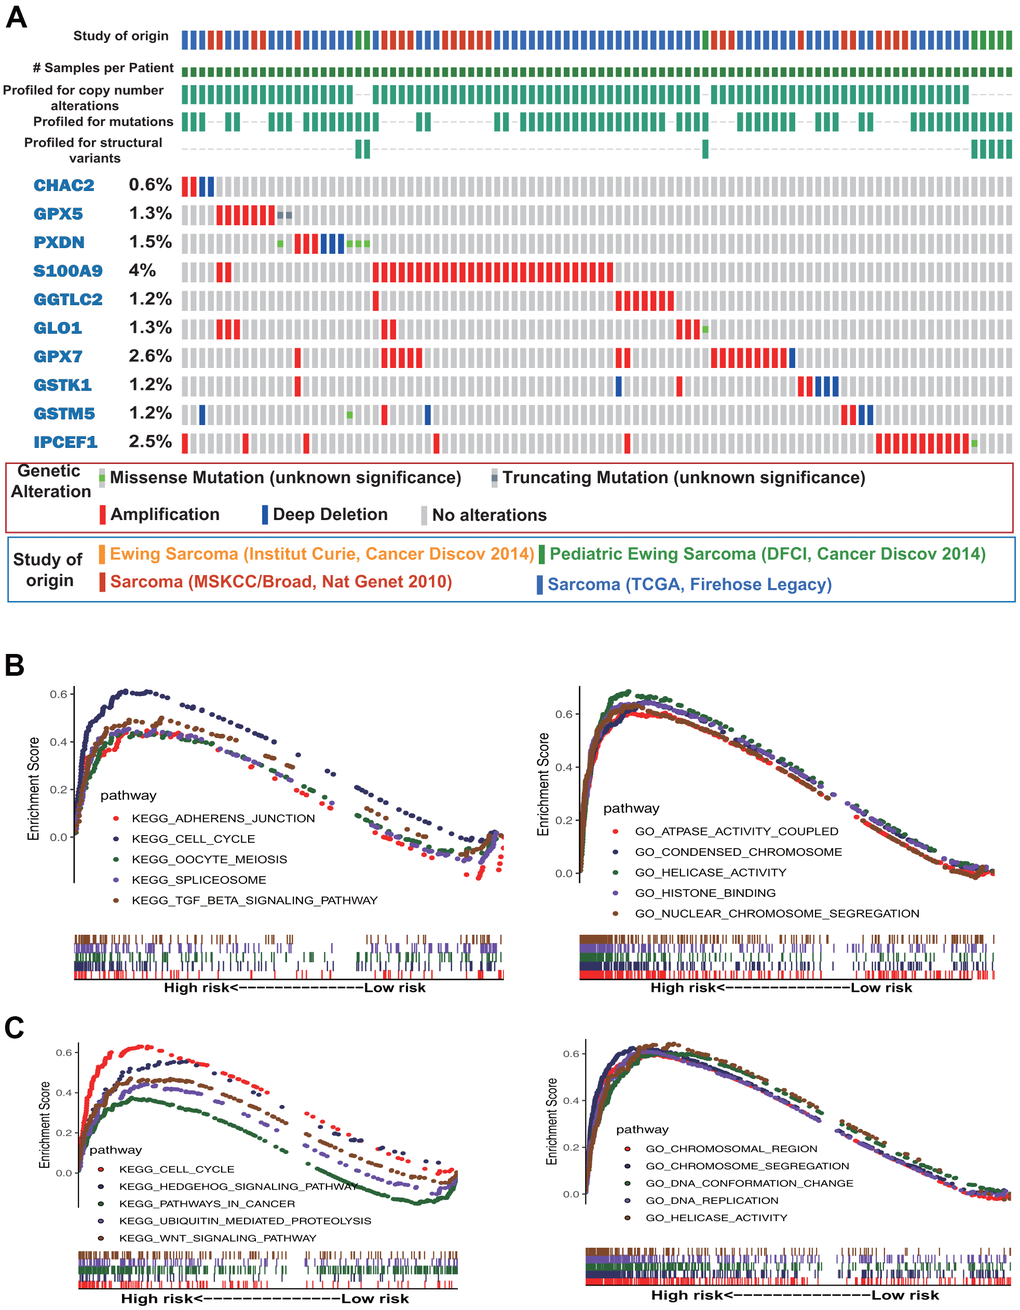
Figure 4. Gene mutation and gene set enrichment analyses. (A) Mutational profiles of the antioxidant genes included in the signature of sarcoma (obtained from cBioPortal). (B) Gene ontology (GO) functional annotation terms and Kyoto Encyclopedia of Genes and Genomes (KEGG) pathways enriched in the OS high-risk group. (C) GO functional annotation terms and KEGG pathways enriched in the DFS high-risk group.
Immune characteristics of sarcomas
CIBERSORT was used to compare the level of infiltration of 22 immune cell types between the low- and high-risk groups in the TCGA-SARC samples. Figure 5A shows the tumor-infiltrating immune cell composition in each sample. Among the 22 immune cell types, the levels of infiltration of plasma cells, non-activated macrophages (M0), and cytotoxic CD8+ T cells were significantly different between the OS low- and high-risk groups (Figure 5B). For DFS, the levels of infiltration of memory CD4+ T cells and M0 and proinflammatory (M1) macrophages were significantly different between the two groups (Figure 5C).
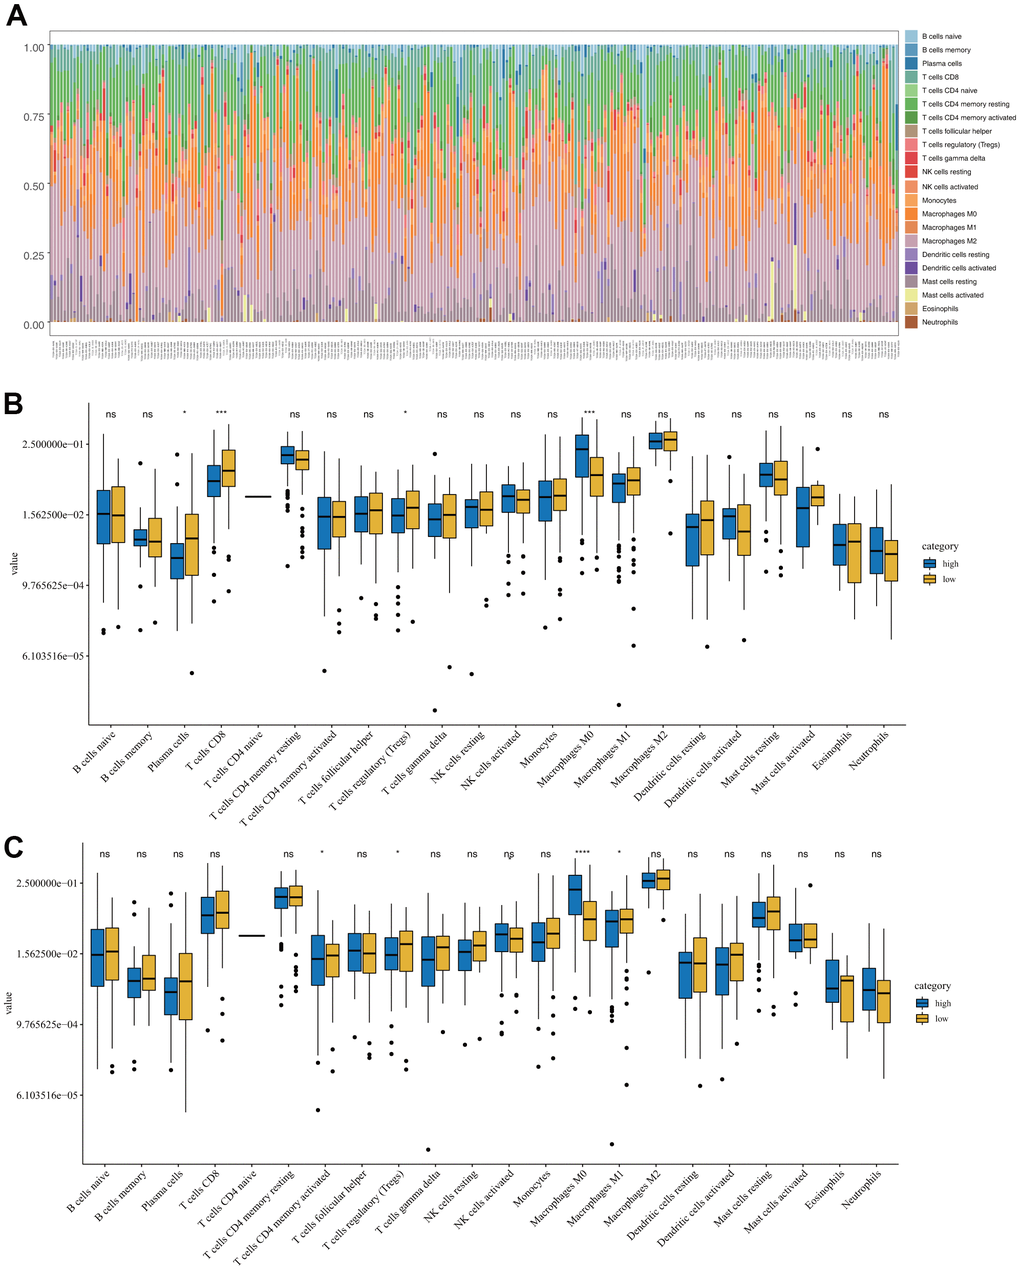
Figure 5. Immune characteristics of sarcomas in the low- and high-risk groups. (A) Tumor-infiltrating immune cell composition in each sarcoma sample. (B) Distribution of 22 types of immune cells in the OS low- and high-risk groups. (C) Distribution of 22 types of immune cells in the DFS low- and high-risk groups.
Development of individualized prediction nomograms and web-based calculators
To construct the nomograms, independent OS and DFS prognostic factors were identified by Cox proportional hazards regression analyses and further analyzed using multivariate Cox regression. Based on the results, age, metastasis, margin status, multifocal indicator, and antioxidant gene signature were independent predictors of OS (Table 3), whereas metastasis, margin status, and antioxidant gene signature were independent predictors of DFS (Table 4). These factors were integrated into the nomogram.
Table 3. Overall survival based on the antioxidant gene signature and clinical data for sarcoma.
| Univariate Cox analysis | Multivariate Cox analysis | ||||||||||||||||||||||||||||||||||||||||||||||||||||||||||||||||||||||||||||||||||||||||||||||||||
| HR | 95%CI | P | HR | 95%CI | P | ||||||||||||||||||||||||||||||||||||||||||||||||||||||||||||||||||||||||||||||||||||||||||||||
| Age | 1.020 | 1.005–1.036 | 0.010 | 1.040 | 1.017–1.062 | 0.000 | |||||||||||||||||||||||||||||||||||||||||||||||||||||||||||||||||||||||||||||||||||||||||||||
| Sex (Female) | 0.853 | 0.571–1.275 | 0.439 | ||||||||||||||||||||||||||||||||||||||||||||||||||||||||||||||||||||||||||||||||||||||||||||||||
| Ethnicity (Asian) | |||||||||||||||||||||||||||||||||||||||||||||||||||||||||||||||||||||||||||||||||||||||||||||||||||
| Black | 1.085 | 0.132–8.924 | 0.939 | ||||||||||||||||||||||||||||||||||||||||||||||||||||||||||||||||||||||||||||||||||||||||||||||||
| White | 0.791 | 0.108–5.771 | 0.817 | ||||||||||||||||||||||||||||||||||||||||||||||||||||||||||||||||||||||||||||||||||||||||||||||||
| Histological type (DLP) | |||||||||||||||||||||||||||||||||||||||||||||||||||||||||||||||||||||||||||||||||||||||||||||||||||
| LMS | 0.844 | .513–1.389 | 0.505 | ||||||||||||||||||||||||||||||||||||||||||||||||||||||||||||||||||||||||||||||||||||||||||||||||
| MFS | 0.703 | .328–1.507 | 0.365 | ||||||||||||||||||||||||||||||||||||||||||||||||||||||||||||||||||||||||||||||||||||||||||||||||
| Other | 0.739 | .319–1.710 | 0.480 | ||||||||||||||||||||||||||||||||||||||||||||||||||||||||||||||||||||||||||||||||||||||||||||||||
| UPS | 0.901 | .481–1.691 | 0.746 | ||||||||||||||||||||||||||||||||||||||||||||||||||||||||||||||||||||||||||||||||||||||||||||||||
| Tumor site (Extremity) | 0.813 | 0.524–1.260 | 0.354 | ||||||||||||||||||||||||||||||||||||||||||||||||||||||||||||||||||||||||||||||||||||||||||||||||
| Metastasis (No) | 3.009 | 1.831–4.946 | 0.000 | 3.702 | 2.089–6.562 | 0.000 | |||||||||||||||||||||||||||||||||||||||||||||||||||||||||||||||||||||||||||||||||||||||||||||
| Margin status (R0) | 2.553 | 1.668–3.909 | 0.000 | 2.356 | 1.351–4.111 | 0.003 | |||||||||||||||||||||||||||||||||||||||||||||||||||||||||||||||||||||||||||||||||||||||||||||
| Multifocal indicator (No) | 2.400 | 1.500–3.841 | 0.000 | 1.256 | 0.601–2.627 | 0.544 | |||||||||||||||||||||||||||||||||||||||||||||||||||||||||||||||||||||||||||||||||||||||||||||
| Radiotherapy (No) | 0.992 | 0.621–1.585 | 0.973 | ||||||||||||||||||||||||||||||||||||||||||||||||||||||||||||||||||||||||||||||||||||||||||||||||
| Pharmacotherapy (No) | 1.380 | 0.814–2.339 | 0.231 | ||||||||||||||||||||||||||||||||||||||||||||||||||||||||||||||||||||||||||||||||||||||||||||||||
| Risk score | 1.552 | 1.331–1.808 | 0.000 | 1.450 | 1.184–1.776 | 0.000 | |||||||||||||||||||||||||||||||||||||||||||||||||||||||||||||||||||||||||||||||||||||||||||||
| HR, hazard ratio; CI, confidence interval; DLP, dedifferentiated liposarcoma; LMS, leiomyosarcoma; MFS, myxofibrosarcoma; UPS, undifferentiated pleomorphic sarcoma. | |||||||||||||||||||||||||||||||||||||||||||||||||||||||||||||||||||||||||||||||||||||||||||||||||||
Table 4. Disease-free survival based on the antioxidant gene signature and clinical data for sarcoma.
| Univariate Cox analysis | Multivariate Cox analysis | ||||||||||||||||||||||||||||||||||||||||||||||||||||||||||||||||||||||||||||||||||||||||||||||||||
| HR | 95%CI | P | HR | 95%CI | P | ||||||||||||||||||||||||||||||||||||||||||||||||||||||||||||||||||||||||||||||||||||||||||||||
| Age | 1.010 | 0.998–1.023 | 0.112 | ||||||||||||||||||||||||||||||||||||||||||||||||||||||||||||||||||||||||||||||||||||||||||||||||
| Sex (Female) | 1.086 | 0.765–1.543 | 0.644 | ||||||||||||||||||||||||||||||||||||||||||||||||||||||||||||||||||||||||||||||||||||||||||||||||
| Ethnicity (Asian) | |||||||||||||||||||||||||||||||||||||||||||||||||||||||||||||||||||||||||||||||||||||||||||||||||||
| Black | 2.125 | 0.265–17.053 | 0.478 | ||||||||||||||||||||||||||||||||||||||||||||||||||||||||||||||||||||||||||||||||||||||||||||||||
| White | 1.915 | 0.266–13.795 | 0.519 | ||||||||||||||||||||||||||||||||||||||||||||||||||||||||||||||||||||||||||||||||||||||||||||||||
| Histological type (DLP) | |||||||||||||||||||||||||||||||||||||||||||||||||||||||||||||||||||||||||||||||||||||||||||||||||||
| LMS | 0.799 | 0.514–1.243 | 0.320 | ||||||||||||||||||||||||||||||||||||||||||||||||||||||||||||||||||||||||||||||||||||||||||||||||
| MFS | 0.735 | 0.378–1.429 | 0.364 | ||||||||||||||||||||||||||||||||||||||||||||||||||||||||||||||||||||||||||||||||||||||||||||||||
| Other | 0.702 | 0.345–1.430 | 0.330 | ||||||||||||||||||||||||||||||||||||||||||||||||||||||||||||||||||||||||||||||||||||||||||||||||
| UPS | 0.775 | 0.439–1.368 | 0.380 | ||||||||||||||||||||||||||||||||||||||||||||||||||||||||||||||||||||||||||||||||||||||||||||||||
| Tumor site (Extremity) | 0.977 | 0.675–1.414 | 0.902 | ||||||||||||||||||||||||||||||||||||||||||||||||||||||||||||||||||||||||||||||||||||||||||||||||
| Metastasis (No) | 4.915 | 3.126–7.728 | 0.000 | 3.942 | 3.942–6.524 | 0.000 | |||||||||||||||||||||||||||||||||||||||||||||||||||||||||||||||||||||||||||||||||||||||||||||
| Margin status (R0) | 2.085 | 1.422–3.056 | 0.000 | 1.971 | 1.971–3.306 | 0.010 | |||||||||||||||||||||||||||||||||||||||||||||||||||||||||||||||||||||||||||||||||||||||||||||
| Multifocal indicator (No) | 2.075 | 1.309–3.289 | 0.002 | 1.493 | 1.493–3.077 | 0.277 | |||||||||||||||||||||||||||||||||||||||||||||||||||||||||||||||||||||||||||||||||||||||||||||
| Radiotherapy (No) | 1.175 | 0.788–1.752 | 0.430 | ||||||||||||||||||||||||||||||||||||||||||||||||||||||||||||||||||||||||||||||||||||||||||||||||
| Pharmacotherapy (No) | 1.385 | 0.865–2.219 | 0.175 | ||||||||||||||||||||||||||||||||||||||||||||||||||||||||||||||||||||||||||||||||||||||||||||||||
| Risk score | 1.005 | 1.003–1.007 | 0.000 | 1.016 | 1.007–1.025 | 0.000 | |||||||||||||||||||||||||||||||||||||||||||||||||||||||||||||||||||||||||||||||||||||||||||||
| HR, hazard ratio; CI, confidence interval; DLP, dedifferentiated liposarcoma; LMS, leiomyosarcoma; MFS, myxofibrosarcoma; UPS, undifferentiated pleomorphic sarcoma. | |||||||||||||||||||||||||||||||||||||||||||||||||||||||||||||||||||||||||||||||||||||||||||||||||||
The OS nomogram that integrated the four independent factors is shown in Figure 6A. The predictive value of the nomogram was validated using ROC analysis, a calibration plot, and decision curve analysis (DCA). The AUCs of 2-, 4-, and 6-year OS prediction were 0.794, 0.779, and 0.862, respectively (Figure 6B). A calibration plot showed excellent calibration of the nomogram (Figure 6C). The results of DCA of the OS nomogram and other clinical features are presented in Figure 6D–6F. For the convenience of clinical application, we constructed a web-based tool (https://quankun.shinyapps.io/sarcOS/) for predicting the OS of patients with sarcoma (Figure 7A, 7B).
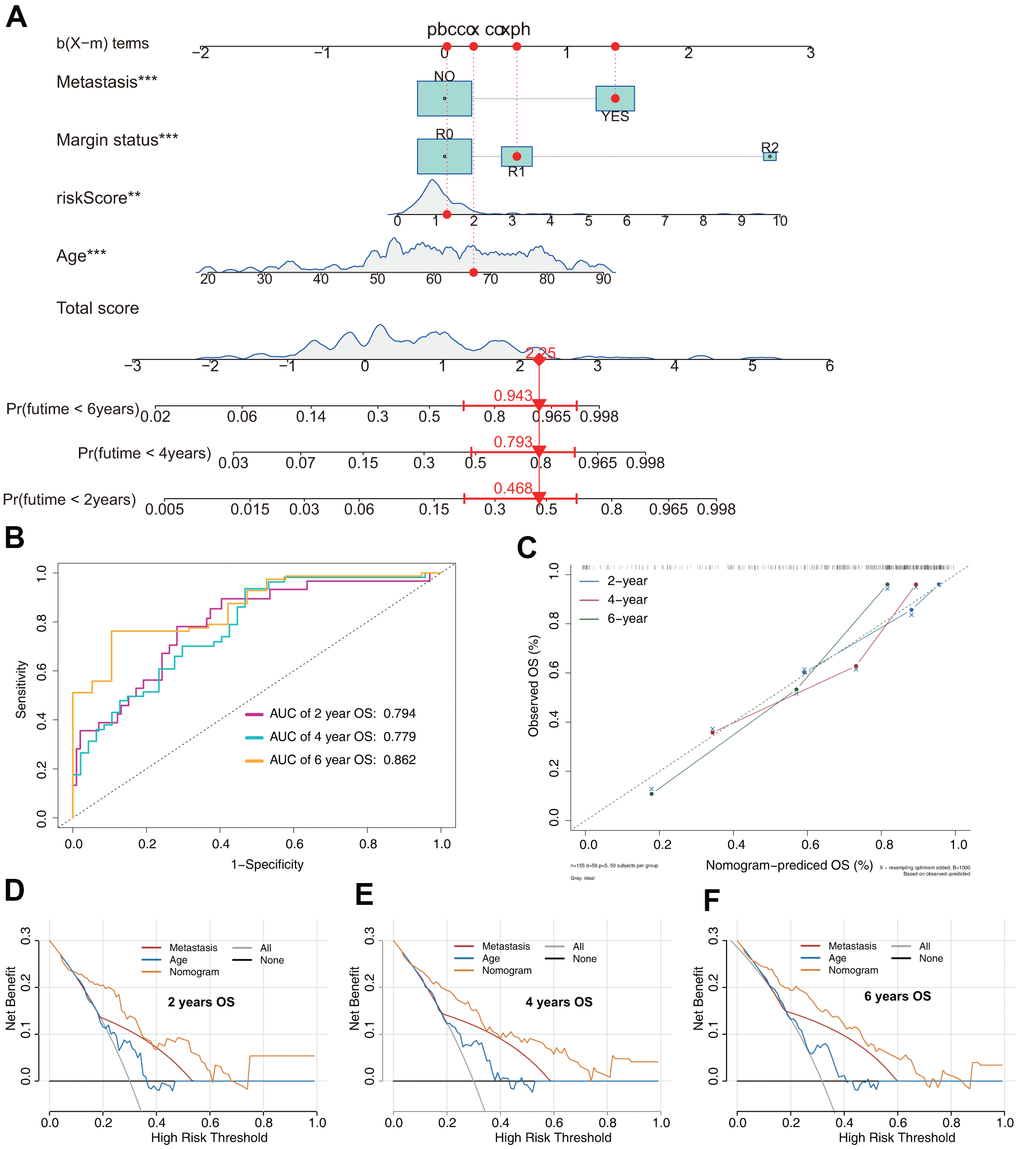
Figure 6. Prediction model of OS in patients with sarcoma. (A) Nomogram constructed based on the risk signature and other independent risk factors identified by Cox analysis. (B) ROC analysis of OS prediction in patients with sarcoma. (C) Calibration plot for evaluating the estimation accuracy of the nomogram. (D) Two-year decision curve analysis (DCA) comparing the model and other clinical features. (E) Four-year DCA comparing the model and other clinical features. (F) Six-year DCA comparing the model and other clinical features.
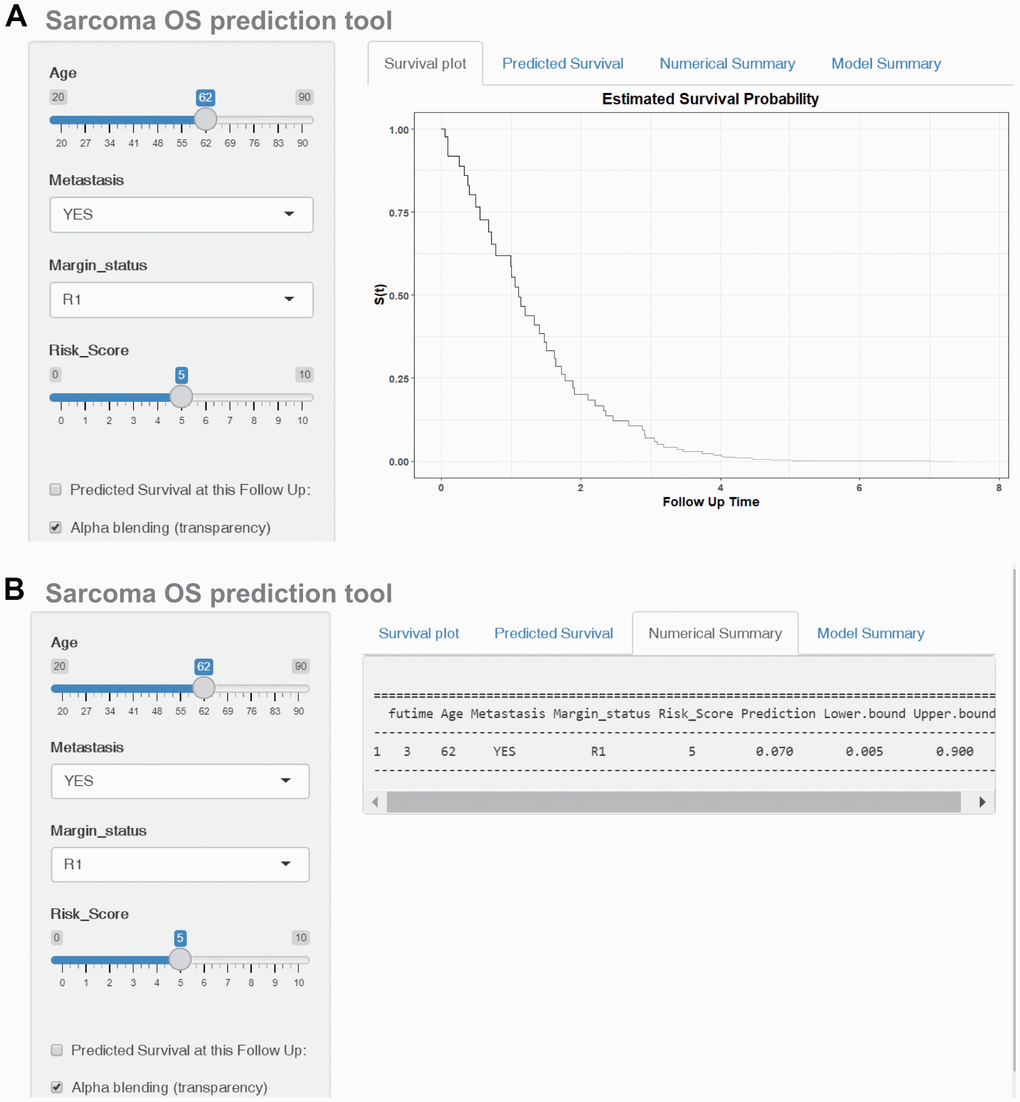
Figure 7. Construction of a web-based tool (https://quankun.shinyapps.io/sarcOS/) for predicting the OS of patients with sarcoma. (A) Web OS rate calculator. (B) Confidence interval at 95% of the web OS rate.
The DFS nomogram that integrated the three independent factors is shown in Figure 8A. ROC analysis, a calibration plot, and DCA were used to evaluate the nomogram. The AUCs of 2-, 4-, and 6-year DFS prediction were 0.917, 0.814, and 0.808, respectively (Figure 8B). A calibration plot showed excellent calibration of the nomogram (Figure 8C). The results of DCA of the DFS nomogram and other clinical features are presented in Figure 6D–6F. A web-based tool (https://quankun.shinyapps.io/sarcDFS/) was established for predicting the DFS of sarcoma patients (Figure 9A, 9B).

Figure 8. Prediction model of DFS in patients with sarcoma. (A) Nomogram constructed based on the three independent risk factors identified by Cox hazards analysis. (B) ROC analysis of DFS prediction in patients with sarcoma. (C) Calibration plot for evaluating the estimation accuracy of the nomogram. (D) Two-year DCA comparing the model and other clinical features. (E) Four-year DCA comparing the model and other clinical features. (F) Six-year DCA comparing the model and other clinical features.
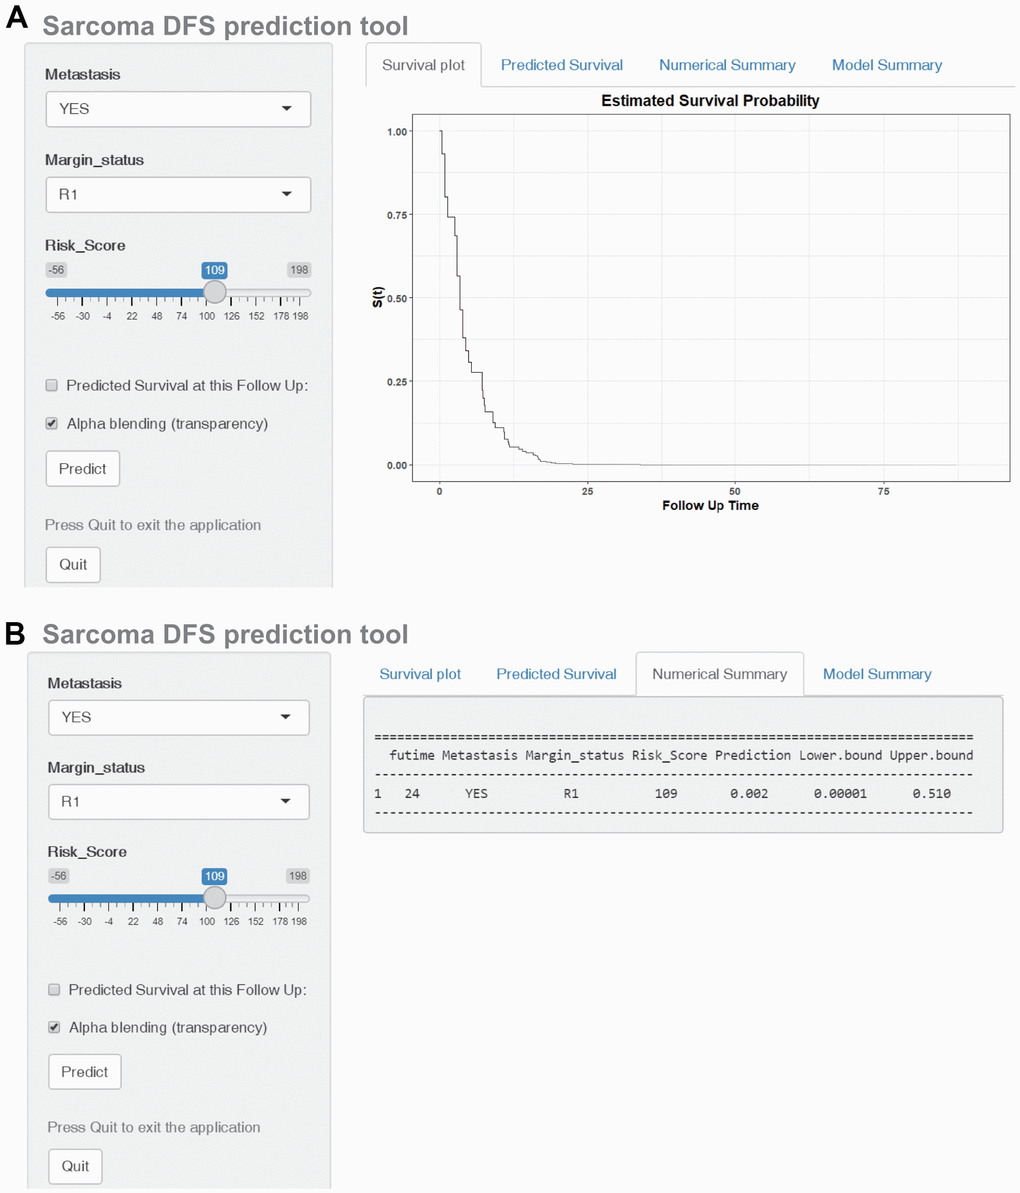
Figure 9. Construction of a web-based tool (https://quankun.shinyapps.io/sarcDFS/) for predicting the DFS of patients with sarcoma. (A) Web DFS rate calculator. (B) Confidence interval at 95% of the web DFS rate.
Discussion
Given the complex molecular regulatory mechanism of sarcoma, it is currently widely accepted that traditional tumor pathological staging cannot adequately predict the survival of patients with sarcoma [19–21]. Thus, there is a compelling need to develop novel prognostic biomarkers for sarcoma. A multitude of evidence suggests that increased ROS production plays an important role in tumor initiation and progression. The antioxidant system controls ROS production and consequently can modulate intracellular signaling pathways. Numerous antioxidant genes encode proteins involved in the antioxidant signaling pathway [22]. However, research exploring prognostic antioxidant gene signatures for sarcoma is currently lacking.
In the present study, we thoroughly investigated the implications of antioxidant genes in OS and DFS in patients with sarcoma. We systematically analyzed antioxidant gene expression profiles and survival times by LASSO regression and identified a five-gene OS signature: CHAC2, GPX5, GSTK1, PXDN, and S100A9. Similarly, we constructed a six-gene DFS signature: GGTLC2, GLO1, GPX7, GSTK1, GSTM5, and IPCEF1. Kaplan–Meier survival and ROC curve analyses indicated that both signatures exhibited excellent fitting and predictive ability. These results may help develop new biomarkers for the prevention and diagnosis of sarcoma and provide clinical research ideas.
Among the 10 antioxidant genes included in the OS and DFS risk signatures, few have previously been explored in terms of their association with sarcoma tumorigenesis. Liu et al. reported that S100A9 expression was significantly increased in osteosarcoma and may be a potential marker for its diagnosis [23]. Chen et al. further investigated the underlying mechanisms and found that S100A9 inhibited osteosarcoma cell proliferation, migration, invasion, and cell cycle by suppressing the mitogen-activated protein kinase and nuclear factor kappa B signaling pathways [24]. GLO1 expression reportedly is upregulated in several malignant tumors [25, 26]. Wang et al. explored the role of GLO1 in sarcoma development and progression and found that GLO1 knockdown inhibited cell proliferation and migration in fibrosarcoma [27]. Although they did not evaluate the critical roles of other antioxidant genes in sarcoma development and progression, most of them are involved in malignant tumors [28–33].
To clarify the molecular mechanisms underlying the risk score, we performed GSEA and found that poor prognosis of high-risk patients with sarcoma was associated with tumor initiation, proliferation, and metastasis. In recent years, increasing attention has been paid to immune infiltration of the tumor microenvironment, which influences biological processes in the tumor. In the present study, the levels of infiltration of plasma cells, M0 and M1 macrophages, and CD8+ and CD4+ T cells were significantly different between the two risk groups. These immune cells may therefore be involved in the development of sarcoma, but this requires further investigation. A better understanding of their roles in sarcoma development may provide new prospects for immunotherapy of sarcoma.
To improve the accuracy of the prediction model, we established nomograms based on the risk scores and other independent risk factors, and these models showed good calibration and discrimination. DCA indicated that the nomograms showed higher clinical benefit and utility than simple clinical features. In addition, the AUCs for 2-, 4-, and 6-year OS prediction were 0.794, 0.779, and 0.862 for OS and 0.917, 0.814, and 0.808 for DFS, respectively. More importantly, to facilitate clinical application, we established two web-based tools to provide free services for OS and DFS prediction.
To the best of our knowledge, this study was the first to construct antioxidant gene signatures for predicting the survival of patients with sarcoma. However, the study had some limitations. First, the demographic and clinical patient data were not comprehensive. Therefore, we could not evaluate additional possible prognostic factors. The limited numbers of factors included in the models may have, at least in part, affected the precision of the nomograms. Second, only two GEO datasets were used for validation; further validation using larger datasets is needed. Third, as the prognostic roles of most of the antioxidant genes were identified for the first time in this study, in vitro or in vivo studies are needed to elucidate their specific mechanisms.
In summary, we established two antioxidant gene signatures and survival models to predict the prognosis of patients with sarcoma. These risk prediction models may serve as effective tools for designing personalized therapies and guiding medical decisions.
Materials and Methods
Data collection
Transcriptomic (HTSeq-FPKM), demographic, and clinical data of patients with sarcoma were collected from the TCGA-SARC database (training cohort, https://portal.gdc.cancer.gov/) and the GEO database (validation cohorts, https://www.ncbi.nlm.nih.gov/geo/). In the TCGA-SARC dataset, after excluding cases with incomplete survival status and follow-up time, a total of 259 patients with sarcoma were included. Two GEO datasets, GSE17674 and GSE30929, comprising 44 and 140 sarcoma patients, respectively, were used to validate the OS and DFS signatures, respectively.
One hundred thirty antioxidant genes were obtained from four gene sets in the molecular signature database for GSEA (Supplementary Table 1). Data for the mutation analysis were derived from the cBioPortal for Cancer Genomics (https://www.cbioportal.org/).
Establishment of the prognostic antioxidant gene signatures
To narrow down candidate antioxidant genes, we conducted univariate Cox regression analysis based on the TCGA-SARC dataset. OS and DFS prognostic were selected for further study. Subsequently, tenfold cross-validated LASSO regression was performed to identify potential predictors with nonzero coefficients using the R packages ‘glmnet’ and ‘survival’ [34, 35]. Finally, multivariate Cox regression analysis was performed to identify highly correlated genes and construct the OS and DFS gene signatures according to the following risk score model:
where N represents the number of antioxidant genes included in the signature, Expi represents the mRNA level of the antioxidant genes included, and βi represents the regression coefficient obtained by Cox regression analysis.
Validation and assessment of the antioxidant gene signatures
To validate the antioxidant gene signatures and evaluate their prognostic value, patients with sarcoma in the TCGA-SARC and GEO datasets were classified into low- and high-risk groups according to the median value of the risk score calculated from the identified antioxidant gene signatures [36]. Survival analysis was then performed using the log-rank test to compare the difference in OS or DFS between the two risk groups. Furthermore, we investigated the time-dependent prognostic value of the signatures using time-dependent ROC curves by “survival” and “timeROC” R packages.
GSEA
The GSEA software ((v4.0.3; http://software.broadinstitute.org/gsea/index.jsp) was used to investigate the mechanism underlying the difference in survival between the low- and high-risk groups from the training set using the KEGG gene set (c2.cp.kegg.v7.1.symbols) and GO gene set (c5.all.v7.1.symbols) [37]. For each analysis, 1,000 gene-set permutations were performed. The top five terms in each analysis were employed in multiple GSEA gene sets to demonstrate the range of biological functions and signaling pathways involved in the antioxidant gene signatures in SARC.
Evaluation of immune cell infiltration
CIBERSORT is an analytical tool for determining the proportions of 22 immune cell types in tissues using 547 barcode gene expression values. In this study, the CIBERSORT algorithm (version 1.03; http://cibersort.stanford.edu/) was employed to determine the proportions of the 22 immune cell types in sarcoma samples [38].
Construction of the models and web-based calculators
To obtain subsets of predictors for OS and DFS, univariate and multivariate Cox proportional hazards analyses were performed using the TCGA-SARC dataset to determine independent risk factors for nomogram construction [39]. Factors determined to be significant (p < 0.05) in univariate Cox regression were subjected to multivariate Cox regression analysis. Using the variables selected on the basis of the Cox regression results, we constructed combined prognostic models to evaluate the 2-, 4-, and 6-year OS and DFS of patients with sarcoma using “rms,” “Hmisc,” “lattice,” “Formula,” and “foreign” R packages. Model performance was assessed using calibration plots, time-dependent ROC analysis, and DCA. For the convenience of clinical application, web-based calculators for predicting the OS and DFS of patients with sarcoma were built using the R packages ‘DynNom’ and ‘survival’ [40].
Supplementary Materials
Author Contributions
Min Dai and Xuqiang Liu conceived and designed the study. Kun Quan, Zhiyou Cao, and Qiang Xu analyzed and interpreted the data. Kun Quan and Meisong Zhu wrote the manuscript. All authors read and approved the final manuscript.
Conflicts of Interest
The authors declare that the research was conducted in the absence of any commercial or financial relationships that could be construed as a potential conflict of interest.
References
- 1. Hui JY. Epidemiology and Etiology of Sarcomas. Surg Clin North Am. 2016; 96:901–14. https://doi.org/10.1016/j.suc.2016.05.005 [PubMed]
- 2. Burningham Z, Hashibe M, Spector L, Schiffman JD. The epidemiology of sarcoma. Clin Sarcoma Res. 2012; 2:14. https://doi.org/10.1186/2045-3329-2-14 [PubMed]
- 3. Sinha S, Peach AH. Diagnosis and management of soft tissue sarcoma. BMJ. 2010; 341:c7170. https://doi.org/10.1136/bmj.c7170 [PubMed]
- 4. Whelan J, McTiernan A, Cooper N, Wong YK, Francis M, Vernon S, Strauss SJ. Incidence and survival of malignant bone sarcomas in England 1979-2007. Int J Cancer. 2012; 131:E508–17. https://doi.org/10.1002/ijc.26426 [PubMed]
- 5. Siegel RL, Miller KD, Fuchs HE, Jemal A. Cancer Statistics, 2021. CA Cancer J Clin. 2021; 71:7–33. https://doi.org/10.3322/caac.21654 [PubMed]
- 6. Cipriano CA, Jang E, Tyler W. Sarcoma Surveillance: A Review of Current Evidence and Guidelines. J Am Acad Orthop Surg. 2020; 28:145–56. https://doi.org/10.5435/JAAOS-D-19-00002 [PubMed]
- 7. Hamad M, Mohammed AK, Hachim MY, Mukhopadhy D, Khalique A, Laham A, Dhaiban S, Bajbouj K, Taneera J. Heme Oxygenase-1 (HMOX-1) and inhibitor of differentiation proteins (ID1, ID3) are key response mechanisms against iron-overload in pancreatic β-cells. Mol Cell Endocrinol. 2021; 538:111462. https://doi.org/10.1016/j.mce.2021.111462 [PubMed]
- 8. Babaei AA, Rafiee M, Khodagholi F, Ahmadpour E, Amereh F. Nanoplastics-induced oxidative stress, antioxidant defense, and physiological response in exposed Wistar albino rats. Environ Sci Pollut Res Int. 2022; 29:11332–44. https://doi.org/10.1007/s11356-021-15920-0 [PubMed]
- 9. Sezgin-Bayindir Z, Losada-Barreiro S, Bravo-Díaz C, Sova M, Kristl J, Saso L. Nanotechnology-Based Drug Delivery to Improve the Therapeutic Benefits of NRF2 Modulators in Cancer Therapy. Antioxidants (Basel). 2021; 10:685. https://doi.org/10.3390/antiox10050685 [PubMed]
- 10. Tien Vo TT, Vo QC, Tuan VP, Wee Y, Cheng HC, Lee IT. The potentials of carbon monoxide-releasing molecules in cancer treatment: An outlook from ROS biology and medicine. Redox Biol. 2021; 46:102124. https://doi.org/10.1016/j.redox.2021.102124 [PubMed]
- 11. Prasad S, Gupta SC, Tyagi AK. Reactive oxygen species (ROS) and cancer: Role of antioxidative nutraceuticals. Cancer Lett. 2017; 387:95–105. https://doi.org/10.1016/j.canlet.2016.03.042 [PubMed]
- 12. Mesmar J, Fardoun MM, Abdallah R, Al Dhaheri Y, Yassine HM, Iratni R, Badran A, Eid AH, Baydoun E. Ziziphus nummularia Attenuates the Malignant Phenotype of Human Pancreatic Cancer Cells: Role of ROS. Molecules. 2021; 26:4295. https://doi.org/10.3390/molecules26144295 [PubMed]
- 13. Huang H, Yi JK, Lim SG, Park S, Zhang H, Kim E, Jang S, Lee MH, Liu K, Kim KR, Kim EK, Lee Y, Kim SH, et al. Costunolide Induces Apoptosis via the Reactive Oxygen Species and Protein Kinase B Pathway in Oral Cancer Cells. Int J Mol Sci. 2021; 22:7509. https://doi.org/10.3390/ijms22147509 [PubMed]
- 14. Panji M, Behmard V, Zare Z, Malekpour M, Nejadbiglari H, Yavari S, Nayerpour Dizaj T, Safaeian A, Maleki N, Abbasi M, Abazari O, Shabanzadeh M, Khanicheragh P. Suppressing effects of green tea extract and Epigallocatechin-3-gallate (EGCG) on TGF-β- induced Epithelial-to-mesenchymal transition via ROS/Smad signaling in human cervical cancer cells. Gene. 2021; 794:145774. https://doi.org/10.1016/j.gene.2021.145774 [PubMed]
- 15. Yi L, Zongyuan Y, Cheng G, Lingyun Z, Guilian Y, Wei G. Quercetin enhances apoptotic effect of tumor necrosis factor-related apoptosis-inducing ligand (TRAIL) in ovarian cancer cells through reactive oxygen species (ROS) mediated CCAAT enhancer-binding protein homologous protein (CHOP)-death receptor 5 pathway. Cancer Sci. 2014; 105:520–7. https://doi.org/10.1111/cas.12395 [PubMed]
- 16. Sriram N, Kalayarasan S, Ashokkumar P, Sureshkumar A, Sudhandiran G. Diallyl sulfide induces apoptosis in Colo 320 DM human colon cancer cells: involvement of caspase-3, NF-kappaB, and ERK-2. Mol Cell Biochem. 2008; 311:157–65. https://doi.org/10.1007/s11010-008-9706-8 [PubMed]
- 17. Wu J, Wang X, Wang N, Ma L, Xie X, Zhang H, Kang H, Zhou Z. Identification of novel antioxidant gene signature to predict the prognosis of patients with gastric cancer. World J Surg Oncol. 2021; 19:219. https://doi.org/10.1186/s12957-021-02328-w [PubMed]
- 18. Ren X, Ma L, Wang N, Zhou R, Wu J, Xie X, Zhang H, Liu D, Ma X, Dang C, Kang H, Zhou Z. Antioxidant Gene Signature Impacts the Immune Infiltration and Predicts the Prognosis of Kidney Renal Clear Cell Carcinoma. Front Genet. 2021; 12:721252. https://doi.org/10.3389/fgene.2021.721252 [PubMed]
- 19. Ozaniak A, Vachtenheim J
Jr , Lischke R, Bartunkova J, Strizova Z. Novel Insights into the Immunotherapy of Soft Tissue Sarcomas: Do We Need a Change of Perspective? Biomedicines. 2021; 9:935. https://doi.org/10.3390/biomedicines9080935 [PubMed] - 20. Sousa LM, Almeida JS, Fortes-Andrade T, Santos-Rosa M, Freitas-Tavares P, Casanova JM, Rodrigues-Santos P. Tumor and Peripheral Immune Status in Soft Tissue Sarcoma: Implications for Immunotherapy. Cancers (Basel). 2021; 13:3885. https://doi.org/10.3390/cancers13153885 [PubMed]
- 21. Xu F, Zhao F, Feng X, Li C, Han D, Zheng S, Liu Y, Lyu J. Nomogram for predicting cancer-specific survival in undifferentiated pleomorphic sarcoma: A Surveillance, Epidemiology, and End Results -based study. Cancer Control. 2021; 28:10732748211036775. https://doi.org/10.1177/10732748211036775 [PubMed]
- 22. Wang Z, Yu K, Hu Y, Su F, Gao Z, Hu T, Yang Y, Cao X, Qian F. Schisantherin A induces cell apoptosis through ROS/JNK signaling pathway in human gastric cancer cells. Biochem Pharmacol. 2020; 173:113673. https://doi.org/10.1016/j.bcp.2019.113673 [PubMed]
- 23. Liu Y, Luo G, He D. Clinical importance of S100A9 in osteosarcoma development and as a diagnostic marker and therapeutic target. Bioengineered. 2019; 10:133–41. https://doi.org/10.1080/21655979.2019.1607709 [PubMed]
- 24. Cheng S, Zhang X, Huang N, Qiu Q, Jin Y, Jiang D. Down-regulation of S100A9 inhibits osteosarcoma cell growth through inactivating MAPK and NF-κB signaling pathways. BMC Cancer. 2016; 16:253. https://doi.org/10.1186/s12885-016-2294-1 [PubMed]
- 25. Bair WB 3rd, Cabello CM, Uchida K, Bause AS, Wondrak GT. GLO1 overexpression in human malignant melanoma. Melanoma Res. 2010; 20:85–96. https://doi.org/10.1097/CMR.0b013e3283364903 [PubMed]
- 26. Sakamoto H, Mashima T, Kizaki A, Dan S, Hashimoto Y, Naito M, Tsuruo T. Glyoxalase I is involved in resistance of human leukemia cells to antitumor agent-induced apoptosis. Blood. 2000; 95:3214–8. https://doi.org/10.1182/blood.V95.10.3214 [PubMed]
- 27. Wang Y, Kuramitsu Y, Tokuda K, Okada F, Baron B, Akada J, Kitagawa T, Nakamura K. Proteomic analysis indicates that overexpression and nuclear translocation of lactoylglutathione lyase (GLO1) is associated with tumor progression in murine fibrosarcoma. Electrophoresis. 2014; 35:2195–202. https://doi.org/10.1002/elps.201300497 [PubMed]
- 28. Chu C, Yu L, Henry-Berger J, Ru YF, Kocer A, Champroux A, Li ZT, He M, Xie SS, Ma WB, Ni MJ, Ni ZM, Guo YL, et al. Knockout of glutathione peroxidase 5 down-regulates the piRNAs in the caput epididymidis of aged mice. Asian J Androl. 2020; 22:590–601. https://doi.org/10.4103/aja.aja_3_20 [PubMed]
- 29. Liu G, Zeng X, Wu B, Zhao J, Pan Y. RNA-Seq analysis of peripheral blood mononuclear cells reveals unique transcriptional signatures associated with radiotherapy response of nasopharyngeal carcinoma and prognosis of head and neck cancer. Cancer Biol Ther. 2020; 21:139–46. https://doi.org/10.1080/15384047.2019.1670521 [PubMed]
- 30. Bulus H, Oguztuzun S, Güler Simsek G, Kilic M, Ada AO, Göl S, Kocdogan AK, Kaygın P, Bozer B, Iscan M. Expression of CYP and GST in human normal and colon tumor tissues. Biotech Histochem. 2019; 94:1–9. https://doi.org/10.1080/10520295.2018.1493220 [PubMed]
- 31. Gunn SR, Bolla AR, Barron LL, Gorre ME, Mohammed MS, Bahler DW, Mellink CH, van Oers MH, Keating MJ, Ferrajoli A, Coombes KR, Abruzzo LV, Robetorye RS. Array CGH analysis of chronic lymphocytic leukemia reveals frequent cryptic monoallelic and biallelic deletions of chromosome 22q11 that include the PRAME gene. Leuk Res. 2009; 33:1276–81. https://doi.org/10.1016/j.leukres.2008.10.010 [PubMed]
- 32. Butrym A, Łacina P, Bogunia-Kubik K, Mazur G. ABCC3 and GSTM5 gene polymorphisms affect overall survival in Polish acute myeloid leukaemia patients. Curr Probl Cancer. 2021; 45:100729. https://doi.org/10.1016/j.currproblcancer.2021.100729 [PubMed]
- 33. Marks KE, Flaherty S, Patterson KM, Stratton M, Martinez GJ, Reynolds JM. Toll-like receptor 2 induces pathogenicity in Th17 cells and reveals a role for IPCEF in regulating Th17 cell migration. Cell Rep. 2021; 35:109303. https://doi.org/10.1016/j.celrep.2021.109303 [PubMed]
- 34. Zhang JX, Song W, Chen ZH, Wei JH, Liao YJ, Lei J, Hu M, Chen GZ, Liao B, Lu J, Zhao HW, Chen W, He YL, et al. Prognostic and predictive value of a microRNA signature in stage II colon cancer: a microRNA expression analysis. Lancet Oncol. 2013; 14:1295–306. https://doi.org/10.1016/S1470-2045(13)70491-1 [PubMed]
- 35. Tibshirani R. The lasso method for variable selection in the Cox model. Stat Med. 1997; 16:385–95. https://doi.org/10.1002/(sici)1097-0258(19970228)16:4<385::aid-sim380>3.0.co;2-3 [PubMed]
- 36. Zeng F, Su J, Peng C, Liao M, Zhao S, Guo Y, Chen X, Deng G. Prognostic Implications of Metabolism Related Gene Signature in Cutaneous Melanoma. Front Oncol. 2020; 10:1710. https://doi.org/10.3389/fonc.2020.01710 [PubMed]
- 37. Pan X, Ma X. A Novel Six-Gene Signature for Prognosis Prediction in Ovarian Cancer. Front Genet. 2020; 11:1006. https://doi.org/10.3389/fgene.2020.01006 [PubMed]
- 38. Newman AM, Liu CL, Green MR, Gentles AJ, Feng W, Xu Y, Hoang CD, Diehn M, Alizadeh AA. Robust enumeration of cell subsets from tissue expression profiles. Nat Methods. 2015; 12:453–7. https://doi.org/10.1038/nmeth.3337 [PubMed]
- 39. Iasonos A, Schrag D, Raj GV, Panageas KS. How to build and interpret a nomogram for cancer prognosis. J Clin Oncol. 2008; 26:1364–70. https://doi.org/10.1200/JCO.2007.12.9791 [PubMed]
- 40. Xu Q, Wang Y, Fang Y, Feng S, Chen C, Jiang Y. An easy-to-operate web-based calculator for predicting the progression of chronic kidney disease. J Transl Med. 2021; 19:288. https://doi.org/10.1186/s12967-021-02942-y [PubMed]