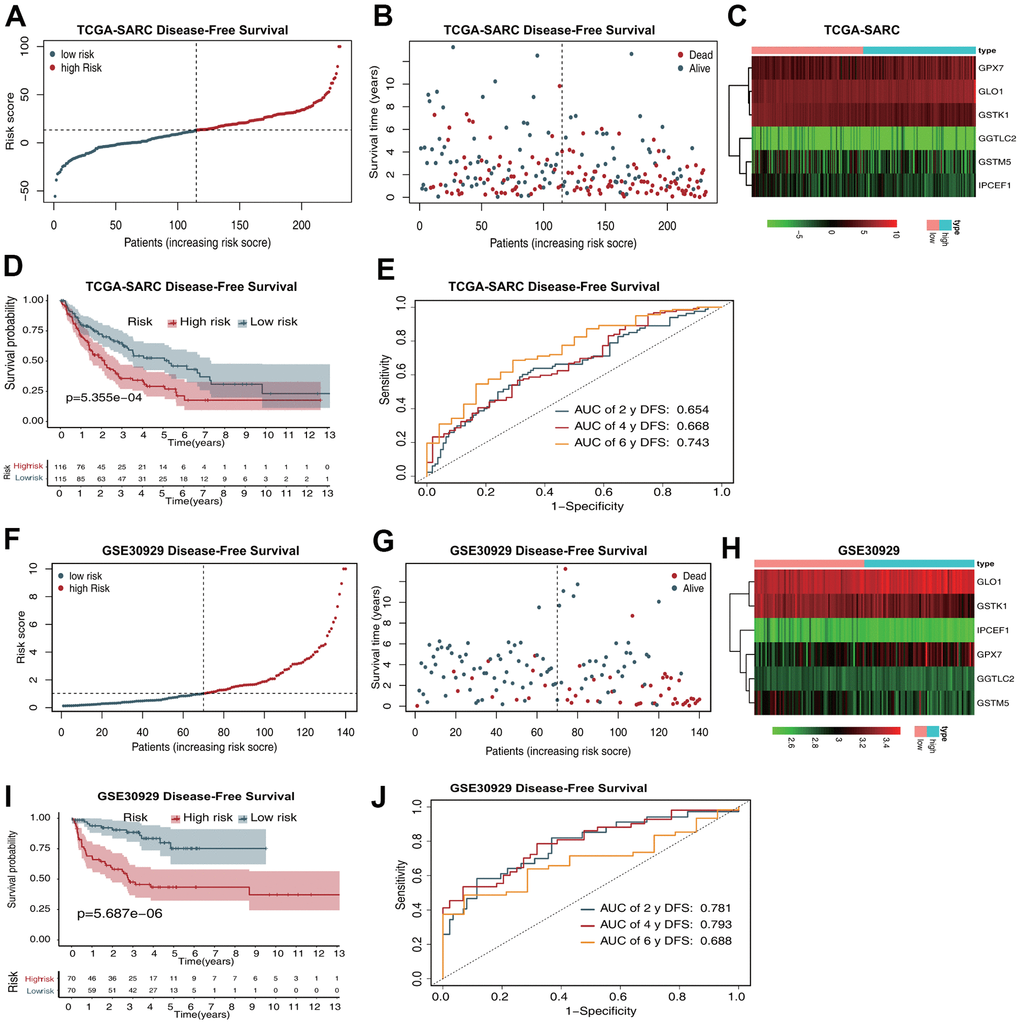
Figure 3.The six-gene prognostic signature predicts the DFS of patients with sarcoma. (A) Risk score distribution in the TCGA-SARC dataset. (B) OS time distribution in the TCGA-SARC dataset. (C) Expression heatmap of the six genes in the TCGA-SARC dataset. (D) Kaplan–Meier analysis of OS based on the signature in the TCGA-SARC cohort. (E) ROC analysis of OS prediction in the TCGA-SARC cohort. (F) Risk score distribution in the GSE30929 dataset. (G) OS time distribution in the GSE30929 dataset. (H) Expression heatmap of the six genes in the TCGA-SARC dataset. (I) Kaplan–Meier analysis of OS based on the signature in the GSE30929 cohort. (J) ROC analysis of OS prediction in the GSE30929 cohort.