


Introduction
DNA methylation-based biomarkers of biological age [1] - epigenetic clocks - have become very popular and have been found to be associated with several risk factors for non-communicable diseases and longevity [2]. Epigenetic clocks are a composite score of DNA methylation levels at different CpG sites in the genome. The differences between epigenetic clocks and chronological age have been defined as epigenetic age acceleration (EAA). Positive values of EAA indicate that an individual is experiencing accelerated aging. EAA has been found to predict all-cause mortality, frailty, psychosocial stress [3, 4], cardiovascular disease [5], diabetes, cancer [1, 6], and higher values are associated with a decline in cognitive ability, depression and anxiety [7, 8].
Previous studies [9–13] has suggested that low socio-economic status (SES) is associated with EAA, using different proxies such as education, parental occupation, income, and combined measures like the relative index of inequality. It emerges that the detrimental effect of low SES positions starting early in life are detectable through epigenetic clocks [14]. Based on recent literature, EAA has been suggested as an intermediate biological mechanism linking environmental exposures (including stress) with poor health outcomes and mortality later in life.
However, most studies investigated older populations, while only a few studies have investigated younger subjects. Based on a sample of middle-aged women, Simons et al. [15] have found an association between income and accelerated aging, that was unaffected by controlling for other SES-related factors (i.e., education, marital status, and childhood adversity). They concluded that chronic financial pressures associated with low income exert a weathering effect that results in premature aging. Using data on age acceleration from the UK Household Longitudinal Study, Hughes et al. [16] confirmed the association of EEA and low SES in early life, but no associations were found with current/adult measures of social position on a sample aged less than 65 years old.
Little is known whether current occupational characteristics or job-related stress - crucial SES characteristics - are associated with EAA. Among the few available studies, a recent study reported an increase in the GrimAge marker, but not in the other two AA markers (DNAm age, PhenoAge), associated with high occupational physical activity [17]. In a US study, performing shift work or night shift work for more than 10 years was associated with an increased EAA PhenoAge marker [10]. Carugno et al. [18], in a study on female nurses, found that night shift work was associated with an increased age acceleration, measured through analysis of five CpG islands in five genes, but limited to subjects with overweight/obesity or exposed to high work stress.
DNA methylation levels (not EAA) have been associated with stress-related conditions. Based on their systematic review of human and animal studies on work stress, burnout and depression, Bakusic et al. [19] concluded that DNA methylation changes are possible biomarkers of stress-related mental disorders. Among human studies, Duman et al. [20] reported a significant increase in global DNA methylation associated with perceived work stress. In a Finnish study on nurses, hypomethylation of the promoter of the serotonin transporter gene (SLC6A4) was associated with both increased burnout symptoms and perceived work stress when mutually adjusted for [21]. Furthermore, in a Japanese study on manufacturing workers, methylation of most CpG islands in the tyrosine hydroxylase gene, promoter included, was significantly increased among those exposed to high job strain [22].
There is ample evidence from the literature on work stress that exposure to psychosocial stressors in the workplace, like those measured using work-stress models such as the demand-control [23] and the effort-reward-Imbalance [24] model, is associated with clinical biomarkers and adverse outcomes. According to the former, the combination of demands and control defines the job strain; it posits that people working in jobs characterized by high demands and low control are at risk of stress-related ill health and disease. Support to this model comes from studies showing that workers exposed to high strain increased risks of coronary heart disease [23, 24], diabetes [25], atherosclerosis in its early non-symptomatic stages [26], as well as increased levels of brain-derived neurotrophic factor [27]. The effort-reward imbalance model, which stems from the social exchange theory [28], captures an employee dissatisfaction about the perceived imbalance between the reward received, in terms of money, career, recognition and job security, and the effort made that would affect well-being and health-related behaviour. In 2017, a review found that effort-reward imbalance was associated with several biological changes in pathways, leading to stress-related conditions: including decreased heart rate variability, increased blood lipids, blood pressure and cortisol release, altered immune function, inflammation, increased risk of metabolic syndrome [29]. Furthermore, a large multicohort study found an increased risk of coronary heart disease associated with high effort-reward imbalance [30].
In this context, to contribute elucidating potential mechanisms through which life-stressing conditions and job stress may impact health, we investigated the relation of EAA with psychosocial and other work characteristics. In relation to epigenetic clocks, we examined the distribution of work-related stress and well-being indicators in the Northern Finland Birth cohort 1966 (NFBC 1966), adjusting for known risk factors for accelerated ageing.
We analyzed well-known work-related stress indicators such as job strain, effort-reward imbalance and overcommitment, discontinuous work history, excessive working hours, shift work, and other work characteristics, including two indicators of positive occupational psychology: work engagement and work favouring attitude. We evaluated the epigenetic age acceleration using five epigenetic ageing biomarkers: Horvath and Hannum first-generation clocks, Levine DNA methylation PhenoAge and Lu's DNA methylation GrimAge (the last two known as the second-generation clocks), and the newly developed pace of aging biomarker, DunedinPoAm, trained on longitudinal data [1, 6, 31–33].
Results
Descriptive summary of epigenetic age acceleration and pace of ageing
Table 1 contains detailed definitions and interpretations of the two work stress indicators and the other work characteristics examined.
Table 1. Job exposure definitions.
| Concept | Description |
| Job strain | Depicts an individual’s experience of a psychosocial work environment that entails a high level of job demands combined with a low level of job control, resulting in job strain. Originally suggested by Karasek in 1979, the demands-control model highlights the role of job control, as not only buffering for stress but resulting in active, healthy work in circumstances where high demands and high control prevail simultaneously. A large body of evidence has linked job strain with excess morbidity and mortality [24, 34, 35] |
| Effort-reward Imbalance (ERI) | Captures an individual’s perception of reciprocity between high effort at work and the actual/expected rewards received in turn. As suggested by Siegrist in 1990s, an imbalance between these two, effort not met with sufficient rewards, is considered a source of work stress. ERI has been linked with both cardiovascular and mental health outcomes [29, 36]. |
| Overcommitment | An addition to the ERI model. Represents an individual’s tendency to put high effort at work even in circumstances of low rewards. Overcommitment is considered a toxic component, increasing the work stress related to ERI. |
| Occupational physical activity (OPA) | Physical activity in the domain of work, in opposition to leisure-time physical activity. High levels of OPA (lifting, standing, heavy manual work) indicate high physical job demands. OPA may not be associated with good health, in contrast with leisure-time physical activity [37]. |
| Work-favouring attitude | Refers to high personal meaning of work as a way to exercise and master skills or even as a calling, as opposed to seeing work merely as a source of income [38]. |
| Work engagement | A concept of positive occupational psychology and work-related well-being [39]. Depicts experience of the following three dimensions at work: vigor, dedication and absorption (flow). |
| Job security | Captures an individual’s perception of the stability of one’s job contract [40]. |
Table 2 reports the descriptive statistics for the epigenetic age acceleration markers and the pace of aging at 46 years for the NFBC data. Women represent 55% of the sample, with a BMI <24.9 for 47%, mainly with a secondary education level (68%) and moderate alcohol consumption (81%), physically very active during leisure time (55%) and never smoked (53%). Men show a similar pattern; however, a higher proportion was overweight (46%). Overall, 87% had a permanent job contract. A higher proportion of men were unemployed (7.1%, compared to 4.7% among women), while women showed a higher percentage in a temporary job (10%, compared to 3% among men). We evaluated the association between job exposures and risk factors using Chi-Square test, Student t-test or ANOVA depending on the variable characteristics (categorical or continuous; see Supplementary Table 1 in Supplementary Materials). We found statistically significant association of smoking with effort and effort-reward Imbalance, type of employer (private or state/municipality) and occupational group.
Table 2. Descriptive statistics of the study population, mean and standard deviation (sd) for continuous variables and frequency and percentage for categorical variables.
| All N=604 | Females N = 337 | Males N = 267 | |
| HorvathAA, mean (sd) | 0.0(4.0) | -0.4 (3.9) | 0.5 (4.1) |
| HannumAA, mean (sd) | -0.01(2.99) | -0.32 (2.92) | 0.39(3.04) |
| PhenoAgeAA, mean (sd) | -0.1(4.8) | 0.2 (4.8) | -0.5 (4.8) |
| GrimAgeAA, mean (sd) | -0.1(4.1) | -0.8(3.9) | 0.9 (4.1) |
| DunedinPoAm, mean (sd) | 1.00(0.07) | 1.01 (0.07) | 1.00(0.07) |
| BMI n(%) | |||
| Optimal< 24.9 | 248 (41%) | 158 (47%) | 90 (34%) |
| Overweight 25-29.9 | 232 (39%) | 111 (33%) | 121 (46%) |
| Obese >= 30 | 118 (20%) | 64 (19%) | 54 (20%) |
| Missing | 6 | 4 | 2 |
| Educational Level n (%) | |||
| Basic | 28 (4.7%) | 15 (4.6%) | 13 (4.9%) |
| Secondary | 409 (69%) | 221 (68%) | 188 (71%) |
| Tertiary | 154 (26%) | 91 (28%) | 63 (24%) |
| Missing | 13 | 10 | 3 |
| Alcohol consumption n (%) | |||
| Never | 53 (8.8%) | 35 (10%) | 18 (6.7%) |
| Moderate | 493 (82%) | 273 (81%) | 220 (82%) |
| Heavy | 56 (9.3%) | 27 (8.1%) | 29 (11%) |
| Missing | 2 | 2 | 0 |
| Smoking n (%) | |||
| Never | 322 (53%) | 199 (59%) | 123 (46%) |
| Past | 155 (26%) | 71 (21%) | 84 (31%) |
| Current | 127 (21%) | 67 (20%) | 60 (22%) |
| Physical Activity (leisure) n (%) | |||
| Inactive | 145 (24%) | 71 (21%) | 74 (28%) |
| Moderately Active | 124 (21%) | 66 (20%) | 58 (22%) |
| Active/Very Active | 335 (55%) | 200 (59%) | 135 (51%) |
| Job status n (%) | |||
| Permanent | 526 (87%) | 286 (85%) | 240 (90%) |
| Temporary | 43 (7.1%) | 35 (10%) | 8 (3.0%) |
| Unemployed | 35 (5.8%) | 16 (4.7%) | 19 (7.1%) |
| Employer | |||
| private employer | 322 (57%) | 133 (42%) | 189 (78%) |
| state/municipality | 240 (43%) | 186 (58%) | 54 (22%) |
| Missing | 42 | 18 | 24 |
| Occupational group | |||
| White collars | 244 (46%) | 163 (55%) | 129 (54%) |
| Blue collars | 292 (54%) | 135 (45%) | 109 (46%) |
| Missing | 68 | 39 | 29 |
| Job Control mean(sd) | 3.83 (0.77) | 3.77 (0.77) | 3.90 (0.76) |
| Missing | 54 | 31 | 23 |
| Job Demands mean(sd) | 4.21 (0.67) | 4.31 (0.64) | 4.07 (0.68) |
| Missing | 51 | 27 | 24 |
| Job strain Linear | 0.19 (0.44) | 0.27 (0.44) | 0.08 (0.41) |
| Missing | 58 | 33 | 25 |
| Job strain n (%) | |||
| Active work | 128 (23%) | 97 (32%) | 77 (32%) |
| High strain | 174 (32%) | 93 (31%) | 29 (12%) |
| Low strain | 122 (22%) | 53 (17%) | 75 (31%) |
| Passive work | 122 (22%) | 61 (20%) | 61 (25%) |
| Missing | 58 | 33 | 25 |
| Job strain Quotient | 1.14 (0.29) | 1.19 (0.30) | 1.08 (0.27) |
| Missing | 58 | 33 | 25 |
| Job strain Tertile n (%) | |||
| High strain | 172 (32%) | 131 (43%) | 57 (24%) |
| Intermediate strain | 186 (34%) | 98 (32%) | 88 (36%) |
| Low strain | 188 (34%) | 75 (25%) | 97 (40%) |
| Missing | 58 | 33 | 25 |
| Effort mean(sd) | 2.10 (0.67) | 2.04 (0.67) | 2.18 (0.66) |
| Missing | 48 | 27 | 21 |
| Reward mean(sd) | 2.50 (0.55) | 2.52 (0.54) | 2.47 (0.55) |
| Missing | 63 | 33 | 30 |
| Effort-Reward Imbalance mean(sd) | 0.90 (0.40) | 0.87 (0.39) | 0.94 (0.41) |
| Missing | 66 | 36 | 30 |
| Overcommitment mean(sd) | 2.10 (0.67) | 2.93 (0.65) | 3.05 (0.61) |
| Missing | 48 | 27 | 28 |
| Employment history n (%) | |||
| At least temporarily unemployed | 269 (45%) | 157 (47%) | 112 (42%) |
| Continuously employed | 333 (55%) | 178 (53%) | 155 (58%) |
| Missing | 2 | 2 | 0 |
| Occupational s Physical Activity n (%) | |||
| Low Intensity | 421 (75%) | 244 (78%) | 177 (72%) |
| Intermediate Intensity | 68 (12%) | 36 (12%) | 32 (13%) |
| High Intensity | 70 (13%) | 33 (11%) | 37 (15%) |
| Missing | 45 | 24 | 21 |
| Working Hours per week n (%) | |||
| Less than 31 hours | 32 (5.7%) | 24 (7.7%) | 8 (3.3%) |
| 31-40 hours | 402 (72%) | 244 (78%) | 158 (64%) |
| More than 40 hours | 124 (22%) | 45 (14%) | 79 (32%) |
| Missing | 46 | 24 | 22 |
| Shifts n (%) | |||
| Day job | 446 (81%) | 253 (82%) | 193 (79%) |
| Evening/shift | 108 (19%) | 57 (18%) | 51 (21%) |
| Missing | 50 | 27 | 23 |
| Work attitude mean(sd) | 17.5 (3.5) | 17.9 (3.6) | 17.0 (3.3) |
| Missing | 8 | 6 | 2 |
| Work engagement mean(sd) | 41 (10) | 42 (10) | 39 (11) |
| Missing | 55 | 29 | 26 |
| Good job security n (%) | |||
| No | 83(15%) | 45(15%) | 38(15%) |
| Yes | 474 (85%) | 266(85%) | 208(85%) |
| Missing | 47 | 26 | 21 |
Additionally, we estimated the effect of non-occupational risk factors for aging on the biomarkers (sex, education, smoking habit, alcohol consumption, BMI, physical activity, see Figure 1). We observed higher EAA in men for all but PhenoAge biomarkers, which were positively associated with smoking and BMI. GrimAgeAA and DunedinPoAm also showed a positive association with smoking and BMI and a negative association with physical activity. Pearson correlations among EAA measures (Supplementary Table 2 in Supplementary Materials) show the highest coefficients were found between Horvath and Hannum AA (ρ=0.96) and between GrimAgeAA and DunedinPoAm (ρ=0.78). The remaining pairwise correlations were in the range 0.20-0.48.
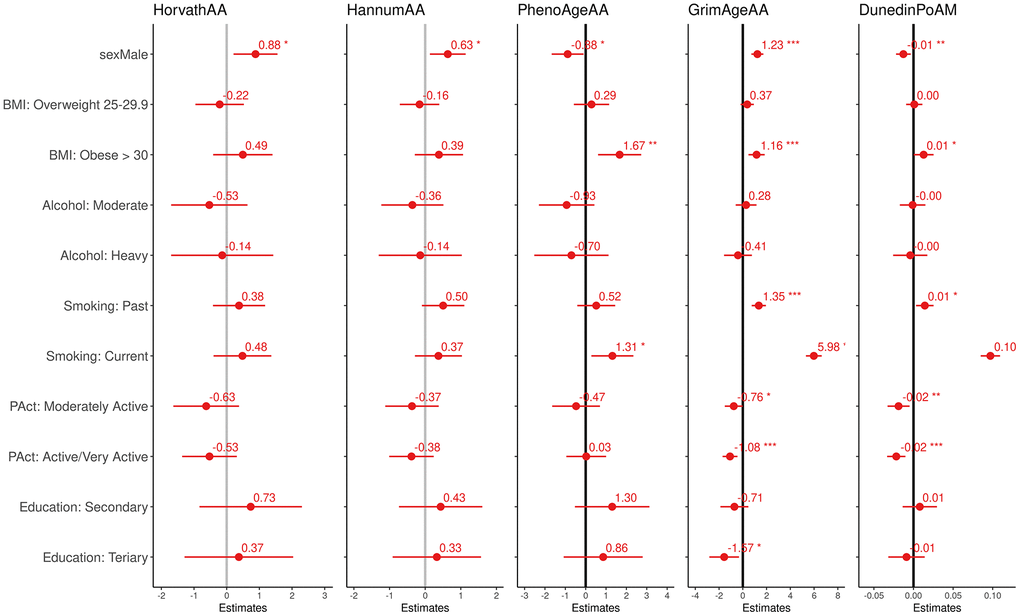
Figure 1. Effect size and 95% confidence intervals (interpretable as years of increase/decreasing epigenetic age and rate of aging) of the association between the four epigenetic aging biomarkers and the pace of aging and modifiable risk factor.
Multivariate models
Results are reported as estimates and 95% confidence intervals from linear regression, where EAA is the dependent variable and work characteristics the predictors. The estimates are interpretable as years of increase/decrease for epigenetic age: positive coefficients indicate increased age acceleration and negative coefficients indicate a decrease of the estimated biological age compared to the chronological age. For DunedinPoAm, the effect size indicates the rate of increasing biological aging (in percentage) comparing a group with the reference category. In Supplementary Materials, we have provided the results as standardized coefficients estimates for the adjusted and unadjusted models for each epigenetic biomarker (Supplementary Tables 4, 5 in Supplementary Materials); these results are interpretable with regard of the EEA standard deviations (Table 1).
Horvath and Hannum AA
The two EEA are highly correlated, so the pattern of exposure to which they are associated are similar. In unadjusted models (Table 3), we have found that being in a temporary versus a permanent job showed a negative association with Horvath age acceleration (β = -1.28 95%CI -2.527, -0.034), hence slowing aging. Both biomarkers, Horvath and Hannum AA were associated with working for more than 40 hours per week that increased the EAA over 1.5 years, (HorvathAA β =2.058 95%CI 0.517,3.599), HannumAA β=1.567, 95%CI 0.415,2.719)) when compared with working less than 31 hours per week. In the adjusted models (Supplementary Table 3 in Supplementary Material), only good job security remained significant for HorvathAA (β=1.511 95%CI -0.001,3.022) HannumAA (β=1.171 95%CI 0.042,2.3).
Table 3. Unadjusted coefficient estimates form linear regression with 95% confidence intervals.
| HorvathAA | HannumAA | PhenoAgeAA | GrimAgeAA | DunedinPoAm | ||
| Estimates (95% CI) | Estimates (95% CI) | Estimates (95% CI) | Estimates (95% CI) | Estimates (95% CI) | ||
| Job Status | permanent | Ref. | Ref. | Ref. | Ref. | Ref. |
| temporary | -1.28 (-2.527,-0.034) * | -0.823 (-1.754,0.108) | 0.132 (-1.365,1.629) | 0.607 (-0.66,1.873) | 0.014 (-0.008,0.036) | |
| unemployed | 0.21 (-1.161,1.582) | 0.105 (-0.92,1.129) | 0.895 (-0.752,2.543) | 1.741 (0.347,3.135) * | 0.019 (-0.005,0.043) | |
| Employer | private employer | Ref. | Ref. | Ref. | Ref. | Ref. |
| state/municipality | -0.34 (-1.012,0.333) | -0.253 (-0.756,0.249) | 0.187 (-0.62,0.994) | -1.219 (-1.885,-0.552) * | -0.006 (-0.017,0.006) | |
| Occupational group | Blue collars | Ref. | Ref. | Ref. | Ref. | Ref. |
| White collars | 0.136 (-0.55,0.822) | 0.088 (-0.425,0.602) | 0.006 (-0.816,0.828) | -1.447 (-2.127,-0.768) * | -0.015 (-0.026,-0.003) * | |
| Job control | 0.328 (-0.109,0.765) | 0.199 (-0.128,0.526) | -0.226 (-0.751,0.299) | -0.225 (-0.665,0.214) | -0.004 (-0.012,0.003) | |
| Job demand | 0.022 (-0.478,0.522) | 0.048 (-0.325,0.422) | -0.307 (-0.907,0.292) | -0.356 (-0.857,0.145) | -0.005 (-0.013,0.004) | |
| Job strain Linear | -0.488 (-1.257,0.281) | -0.27 (-0.845,0.305) | -0.095 (-1.014,0.823) | -0.153 (-0.921,0.615) | 0 (-0.014,0.013) | |
| Job strain | Low strain | Ref. | Ref. | Ref. | Ref. | Ref. |
| active work | 0.151 (-0.767,1.069) | 0.169 (-0.517,0.855) | -1.201 (-2.292,-0.11) * | -0.342 (-1.258,0.573) | -0.008 (-0.024,0.008) | |
| passive work | 0.112 (-0.886,1.109) | 0.139 (-0.606,0.884) | -0.685 (-1.871,0.501) | 0.21 (-0.784,1.205) | 0.004 (-0.013,0.021) | |
| high strain | -0.355 (-1.353,0.643) | -0.225 (-0.971,0.52) | -0.262 (-1.448,0.924) | 0.016 (-0.979,1.011) | 0.005 (-0.012,0.022) | |
| Job strain quotient | -0.938 (-2.087,0.211) | -0.557 (-1.417,0.302) | -0.232 (-1.606,1.143) | 0.059 (-1.09,1.208) | 0.001 (-0.019,0.021) | |
| Job strain tertile | Low strain | Ref. | Ref. | Ref. | Ref. | Ref. |
| Intermediate strain | -0.48 (-1.313,0.353) | -0.237 (-0.86,0.386) | -1.026 (-2.017,-0.035) * | 0.041 (-0.79,0.872) | 0 (-0.014,0.014) | |
| high strain | -0.442 (-1.273,0.389) | -0.253 (-0.875,0.368) | -0.193 (-1.182,0.795) | -0.441 (-1.27,0.388) | -0.001 (-0.015,0.014) | |
| Effort | -0.413 (-0.909,0.084) | -0.312 (-0.683,0.059) | -0.246 (-0.848,0.356) | 0.758 (0.259,1.258) * | 0.009 (0.001,0.018) * | |
| Reward | 0.087 (-0.53,0.704) | 0.177 (-0.284,0.639) | 0.237 (-0.505,0.979) | 0.327 (-0.292,0.946) | 0.002 (-0.009,0.013) | |
| Effort-Reward Imbalance | -0.524 (-1.365,0.318) | -0.451 (-1.08,0.178) | -0.396 (-1.411,0.619) | 0.795 (-0.05,1.639) | 0.011 (-0.003,0.026) | |
| Overcommitment | 0.171 (-0.353,0.694) | 0.102 (-0.29,0.494) | 0.131 (-0.498,0.76) | 0.148 (-0.384,0.68) | 0 (-0.009,0.009) | |
| Work history | At least temporary unemployed | Ref. | Ref. | Ref. | Ref. | Ref. |
| Continuously Employed | 0.236 (-0.41,0.882) | 0.238 (-0.244,0.72) | -0.11 (-0.883,0.662) | -0.665 (-1.321,-0.008) * | -0.01 (-0.021,0.001) | |
| Occupational Physical Activity | Low Intensity | Ref. | Ref. | Ref. | Ref. | Ref. |
| Intermediate Intensity | -0.282 (-1.304,0.74) | -0.149 (-0.913,0.615) | 0.446 (-0.787,1.679) | 1.369 (0.342,2.395) * | 0.013 (-0.005,0.031) | |
| High Intensity | 0.066 (-0.944,1.076) | 0.158 (-0.597,0.913) | 0.753 (-0.465,1.971) | 0.68 (-0.334,1.693) | -0.003 (-0.021,0.014) | |
| Working hours per week | less than 31 hours | Ref. | Ref. | Ref. | Ref. | Ref. |
| 31-40 hours | 1.247 (-0.181,2.675) | 0.959 (-0.108,2.026) | -0.521 (-2.254,1.213) | 0.044 (-1.407,1.495) | -0.002 (-0.027,0.024) | |
| more than 40 hours | 2.058 (0.517,3.599) * | 1.567 (0.415,2.719) * | 0.085 (-1.786,1.956) | 0.573 (-0.994,2.139) | 0.001 (-0.026,0.028) | |
| Working shift | Day job | Ref. | Ref. | Ref. | Ref. | Ref. |
| Evening/shift | 0.455 (-0.383,1.293) | 0.391 (-0.236,1.019) | 0.585 (-0.428,1.598) | 0.733 (-0.114,1.58) | 0.015 (0.001,0.03) * | |
| Work attitude | -0.004 (-0.097,0.089) | -0.01 (-0.079,0.059) | -0.006 (-0.117,0.105) | -0.041 (-0.135,0.052) | -0.001 (-0.003,0.001) | |
| Work engagement | 0.005 (-0.028,0.037) | 0.003 (-0.021,0.028) | 0.009 (-0.03,0.049) | -0.049 (-0.081,-0.016) * | -0.001 (-0.001,0) * | |
| Good job security | No | Ref. | Ref. | Ref. | Ref. | Ref. |
| Yes | 1.016 (0.089,1.944) * | 0.778 (0.084,1.471) * | 0.872 (-0.251,1.996) | -0.11 (-1.052,0.831) | -0.005 (-0.021,0.011) |
PhenoAge and GrimaAge AA
PhenoAgeAA was associated with job strain, active work- compared to reference low strain- in both unadjusted (β=-1.201 95%CI -2.292, -0.11) and adjusted (β=-1.301 95%CI -2.391, -0.212)) models.
In the unadjusted models, GrimAgeAA was associated with several exposures among which unemployment increase of more than 1.5 years β=1.741 (0.347,3.135) compared to employed, belonging to the white-collar occupational group decreases the aging of almost 1.5 years (β=-1.447, 95%CI -2.127, -0.768) and working for the state/municipality as well slowed the aging similarly (β=-1.219, 95%CI -1.885, -0.552). However, upon adjustment, only working as white-collar remained statistically significant a little above six months (β=-0.683, 95%CI -1.264, -0.102) when compared to blue collars.
Rate of aging: DunedinPoAm
For the unadjusted fit, we found a statistically significant association for being working as white-collar - β=-0.015, 95%CI -0.026, -0.003) compared with being blue-collar. Effort (β=0.009, 95%CI 0.001,0.018) and evening shift increase the rate of aging of less than 2% (β=0.015, 95%CI 0.001,0.03). No statistically significant association was found once we adjusted for all the known risk factors.
Sensitivity analysis: sex-stratified
Adjusted models were fitted for women and men separately. Among women (Supplementary Table 6 in Supplementary Materials), we found that being in a temporary job versus a permanent one presented a negative association with Horvath age acceleration (β=-1.484 95%CI -2.922, -0.047), whereas the estimate obtained for being continuously employed versus discontinuously with GrimAge (β= -0.696, 95%CI -1.309, -0.009) decreased the AA.
In contrast to our expectations, higher Effort-Reward Imbalance was associated with a decrease by approximately one year in the AA for both Horvath (β=-1.292, 95%CI -2.486, -0.099) and Hannum markers (β= -0.915, 95%CI -1.812, -0.019). It is worth underlying that if the effort-reward imbalance has a value below or close to zero, it indicates a favourable condition (low effort, high reward), whereas values above 1.0 indicate exposure to work stress, according to the model.
Long working hours and strenuous occupational physical activity (OPA) increased the AA of these markers by more than 2 years: for working more than 40 hours/week versus <31 hours/week we observed increases in Horvath AA (β=2.075, 95%CI 0.534, 3.616) and Hannum AA (β=2.483, 95%CI 0.421, 4.546), and for high-intensity strenuous physical effort and increase in Hannum AA (β=1.248 95%CI 0.088,2408).
For men (Supplementary Table 7 in Supplementary Materials), DunedinPoAm showed a decreased rate in job demand (β=-0.012, 95%CI -0.023, -0.001), but no effect was found for job control. An increase was observed for evening jobs compared with day ones (β=0.021, 95%CI 0.002, 0.039). Nevertheless, unlike observed among women, no significant effects were found for working hours in any of the outcomes analyzed.
Occupational physical activity seems to be beneficial in men, where high-intensity strenuous physical effort decreases AA for Horvath (β=-1.775, 95%CI -3.282, -0.267) and Hannum (β=-1.22, 95%CI -2.348, -0.092) with an opposite effect for GrimaAge in intermediate intensity (β=1.651 95%CI 0.4, 2.901). GrimAge was also negatively associated with white-collar occupational class (β=-1.245, 95%CI -2.164, -0.325). Lack of job security increased by more than one year the Hannum marker (β=1.132, 95%CI 2.191, 0.072), although it was expected to capture a stressful condition.
Discussion
In this work, we assessed the association (and its magnitude) of five biomarkers of epigenetic age acceleration with work-related stress and well-being indicators (as well as other employment characteristics) in the Northern Finland Birth Cohort 1966, at 46 years old. Overall, we have observed small magnitude of age acceleration for job-related stress variables in the range of ±2 years, compared with those of non-communicable disease risk factors (e.g. current smoking is associated with 4.73 years increasing GrimAge age acceleration (AA) marker).
Pooled linear regression results (men and women jointly) showed inconsistent patterns of associations of job stress compared with the current literature, and few statistically significant results once we adjusted for covariates. Horvath and Hannum EAA were positively (accelerating aging) associated with working longer hours, with a significant trend in risk, but in contrast to our expectations, were also positively associated with job security and negatively (decelerating aging) associated with higher effort, high strain and high effort-reward imbalance, although for the latter two differences were not significant. The other biomarkers were statistically significantly associated for job strain (decelerated epigenetic aging in active workers) for PhenoAgeAA and job category (decelerated EEA in white collars compared with blue collars in GrimAgeAA).
Once we stratified analyses by sex, a different pattern of association emerged, with women leading on the statistically significant results. Although job strain was overall not significantly associated with EAA, for some aging biomarkers, the effect size for women and men were in opposite directions. For example, in GrimAgeAA, women showed an accelerating effect for job demands and consequently for two job strain formulations. Among women, effort and effort-reward imbalance presented a less accelerating effect when compared with men, and the same pattern was detected with overcommitment for all the outcomes.
Long working hours(>55hours/week) and shift work have been associated with increased risk of chronic conditions like stroke or breast cancer [41, 42], and working long hours is a risk factor for shortened sleeping hours and difficulty falling asleep [43]. A Japanese study conducted among white-collar factory workers found that long working hours lead to sleep problems in a dose–response manner and impeded adequate recovery from fatigue, resulting in cumulative fatigue [44]. A previous study [45] found that men working long hours showed a worse cardiometabolic and inflammatory profile and increased anthropometric markers compared to those who did not work long hours; this was not confirmed in women, where these relations were absent or weak. Our study found that women have an increase of age acceleration over two years for Hannum and Horvath AA, when working for more than 40 hours/week. While we are not able to understand the biological mechanism, a study in UK found that among women working long hours and weekends deteriorates their mental health and increases depressive symptoms [46]. We hypothesize that mental health is acting as a mediator between the long hours of work and age acceleration, as findings of association between depression and AA start to emerge [47, 48].
High-intensity physical effort at work had an increasing effect for women but a decreasing effect in men. This contrasting result in men and women seems to point to the idea that the effects of job stress are different in the two genders [49], with women being affected more at an emotional level. While our intention was not to assess gender differences, nor we detect any substantial pattern in this sense, other fields such as occupational psychology [50] have assessed differences in work stress management. It has been observed that women express greater psychosomatic complaints when working in high demand, low control, and low support settings than their males [50]. While we have no evidence from our data, the increased effect in OPA seen for women might also be related to the heavy features of their jobs that like cleaning or nursing.
The effort-reward imbalance that represents “the interaction between a person’s cognitions, emotions, and behaviours, and the material and social work context” decreased the AA for both Horvath and Hannum markers in both genders, although significantly only among women. This seems in contrast with results from another study suggesting that women who experienced a higher level of reward showed more positive health functioning. This might be because women seem to experience a higher buffering effect from social support than from job control. Likewise, a recent study [51] conducted on the German socio-economic panel data, reported higher values for men in ‘effort’ and effort-reward ratio but no significant gender differences for the association between effort–reward imbalance model and the risk of self-reported depression.
Different epigenetic age acceleration indicators seem to represent different aspects of aging. HannumAA has been described as a biomarker of immune system ageing and demonstrated sensitivity to variations in the environment and lifestyle. At the same time, HorvathAA is a stable indicator of metabolic aging processes [52]. However, we have found that HorvathAA and HannumAA indicators are highly correlated, as reported by Lau et al. [53], in contrast with others who reported low correlation values [54]. Our results confirmed that the GrimAge clock is higher in smokers (past and current) and in relation to alcohol intake, as also found by Kresovich et al. [54]; in fact, the clock is constructed as the composite of 8 DNA methylation-based markers for plasma proteins and self-reported smoking packs [32] making it more responsive to smokers. Differences by gender were statistically significant for all AA markers, but female gender was positively associated with Horvath, Hannum and GrimAge, and negatively associated with PhenoAge and DunedinPoAm. This points to the observed difference between women and men, who present a diverse pattern in terms of epigenetics [49–51], which was the main reason to add, despite the small sample size, the sex-stratified analysis. Singmann et al. [55] have identified and validated 1,184 CpG sites to be differentially methylated between men and women; for these CpGs there is large overlap with the CpG sites used to define the EEAA. For Hannum the overlap is 28%, for Horvath 17%, for PhenoAge 14%, and for DunedinPoAm is 76%. However, the pace of aging is the indicator that discriminates less across variables.
Lastly, we observed that adjusted associations for the biomarkers with known risk factors are mostly not associated, except for smoking levels in GriamAgeAA and DunedinPoAm. While others have found similar pattern, for example, in Fiorito et al. [9], the effect size of the association of BMI, alcohol consumption, and physical activity was less than one-year comparing extreme categories and similar results have been obtained [56, 57].
This paper is one of the first attempts to address the working dimension of epigenetic age acceleration indicators, to the best of our knowledge. The NFBC 1966 cohort at the age of 46 years offers a rich questionnaire that allows studying a general population-based sample representing all occupations and sectors of economy which makes it an ideal setting of studying employment-related factors in relation to other health predictors. With this study population, where all the participants were born in the same year in the same geographical region, we minimized confounding by changes in working life circumstances along with macroeconomic trends. In other studies [9], the participants usually have different ages, geographical backgrounds, and working life exposures. As pointed out by Belsky et al. [33], the four age acceleration indicators were developed on blood DNA methylation, making them highly sensitive to changes in chronological age. The drawback is that '…clocks confound methylation patterns arising from early-life exposures to methylation-altering factors with methylation patterns related to biological ageing during adulthood' [33].
There are some limitations in this study. The limited sample size of subjects with both DNA methylation data and job variables affected the regression analysis. It could explain the lack of power in identifying robust work-stress associations, as also did the low Cronbach alpha for overcommitment and reward. Although the questionnaire is detailed on work-related factors, established work stress-related scales, details on job typologies, duration of the work stress or financial job insecurity have not been specifically investigated. Job strain was queried on a reduced number of items from the original Job Content Questionnaire [58], accounting for 42 items. Furthermore, due to the small sample size, other work-related indicators have been collapsed in binary variables, implying low variability.
The subjects in NFBC are mostly permanently occupied, with little worries about job security as 85% rated their job as secure. 77% worked less than or up to 40 hours per week and in a diurnal job with no shifts. Overall, the sample is homogenous, and stems from a Nordic welfare society with rather favourable working conditions and women participating in working life equally often as men, although the distribution of occupations is quite gendered as in most societies – women predominate nursing, men construction etc. Nevertheless, the characteristics of the NFBC dataset could be the reason for the inconsistent results observed. In a previous study conducted on the NFBC data (n=6496) Ek et al. [38] evaluated the employment trajectories over 30 years (ages 16 to 45), derived by latent class analysis of retrospective employment history calendars. It emerged that the employment trajectories most favourable for work-related well-being in midlife were rooted in social investments during early life and characterized by attainment of higher education and self-employment.
Nonetheless, this is one of the first studies to quantify the relation between a large variety of job-related variables and epigenetic age acceleration and pace of ageing. Our results suggest that women and men present different associations with different epigenetic distributions regarding work-related stress indicators. We advocate for further studies to be carried out for detailed patterns in different types of jobs [59] and in different societies as well as using measurements that target the longitudinal effects of the work environment and employment histories on stress and health and that account for gender differences.
Materials and Methods
Study population
The study sample consisted of 604 participants from the ongoing Northern Finland Birth Cohort 1966 (NFBC), a longitudinal research program established to promote population-level health and well-being. The NFBC was started as a cohort of mothers and newborns with expected date in 1966 in the provinces of Oulu and Lapland (Finland), including over 95% of births in the region. The initial aim was to examine the risk factors in preterm birth and the consequences of adverse outcomes and subsequent morbidity. Later on, data were collected at 1, 14, 31 and 46 years old through clinical examination, questionnaires (lifestyle, employment and working conditions), and national records to improve population health and well-being [60, 61]. From the 46 years old questionnaires, we selected participants belonging to the work force [employed (part-time, full time, self-employed) and unemployed subjects] for which DNA methylation data [62] were available (a random sample), as shown in the flowchart (see Supplementary Figure 1 in Supplementary Materials).
Computation of epigenetic clock measures
We have calculated four epigenetic age indicators: Horvath [1] DNAm age based on the weighted average of 353 age-related CpG; Hannum [6] DNAm age based on 71 blood specific age-related CpGs; Pheno [63] DNAm age based on 513 phenotypic age-related CpGs and DNAm GrimAge [32].
Based on these epigenetic clocks we defined the extrinsic epigenetic age acceleration (EAA), as the primary outcome, obtained from the residual values of the linear regression of epigenetic age on chronological age. Positive values of EAA indicated faster biological aging, while negative values indicated decelerated aging.
This four EAAs measure how much ageing has occurred in an individual up to the point of measurement. To assess how fast the subject is ageing, we included DunedinPoAm [33] an indicator based on 46 CpGs that is trained on longitudinal data and express a rate of biological aging (compared with the Dunedin sample on which the measure was trained).
Covariates
As additional variables, we have included established lifestyle-related risk factors for poor health and accelerated ageing. Smoking was classified as: never, past and current smoker. Alcohol consumption was categorized as a non-drinker, moderate or heavy drinker, based on questions on how often and what type of drinks (wine, spirits, beer/cider).
Body Mass Index (BMI) is presented in three levels (optimal < 24.9, overweight 25-29.9, obese>=30); the educational level was classified as basic (< 9 years of school and no vocational education or only short course), secondary (vocational school or college degree and/or matriculation examination) or tertiary (polytechnic or university degree) [67]. Leisure-time physical (LPA) activity has been derived by a combination of questions that accounted for the type of activity (brisk/light) and duration and weekly frequency and summarised in three levels: inactive, moderately active, and very active/active [68]. Age was excluded because chronological age has zero correlation with age acceleration measures (by definition) and we defined sex from birth records.
Statistical methods
We computed the descriptive statistics (mean and standard deviation) for all the continuous variables and frequency for categorical variables and the Pearson correlation for the four EEAA measures and DunedinPoAm. To evaluate the association of the epigenetic clocks and DunedinPoAm with job measures, we evaluated the association using the Chi-Square test for categorical exposure, Student t-test or Analysis of variance for continuous ones. Initially, to assess the effect of risk factors on the biomarkers, we fitted linear regression models for all the outcomes. Further linear models were fitted for unadjusted and fully adjusted for sex, alcohol consumption, smoking, BMI, educational levels, and physical activity. As a sensitivity analysis, we investigated fully adjusted models separated by sex. Results are reported as estimates, and 95% confidence intervals and as standardized estimates. Linear regression assumptions were assessed on residual.
Compliance with ethical standards
All participants gave written informed consent in accordance with the Declaration of Helsinki 1975, as revised in 2000, at each stage of the study. The Ethics Committee approved the study of the Northern Ostrobothnia Hospital District.
Data availability
NFBC data is available from the University of Oulu, Infrastructure for Population Studies. Permission to use the data can be applied for research purposes via electronic material request portal. In the use of data, we follow the EU general data protection regulation (679/2016) and Finnish Data Protection Act. The use of personal data is based on cohort participant’s written informed consent at his/her latest follow-up study, which may cause limitations to its use. Please, contact NFBC project center ([email protected]) and visit the cohort website (http://www.oulu.fi/nfbc) for more information.
Author Contributions
AFS drafted the paper and carried out the statistical analysis. GF and OR provided the epigenetic age. ADE, MV, LAM, MRJ provided input in the study design including the construction of indicators of work exposures and features. JR carried DNA analysis for NFBC. PV was the PI of the study. All authors have read and contributed to the final paper.
Acknowledgments
We thank all cohort members and researchers who participated in the 46 years study. We also wish to acknowledge the work of the NFBC project center.
Conflicts of Interest
The authors declare that they have no conflicts of interest.
Funding
This work has been funded by the Colt Foundation with a grant to Paolo Vineis (Project: CF/03/18: Are unstable jobs such as the growing “gig economy” associated with biological age acceleration?”). NFBC1966 received financial support from University of Oulu Grant no. 24000692, Oulu University Hospital Grant no. 24301140, ERDF European Regional Development Fund Grant no. 539/2010 A31592. OR was supported by a UKRI Future Leaders Fellowship (MR/S03532X/1).
References
- 1. Horvath S. DNA methylation age of human tissues and cell types. Genome Biol. 2013; 14:R115. https://doi.org/10.1186/gb-2013-14-10-r115 [PubMed]
- 2. Tan Q. Epigenetic age acceleration as an effective predictor of diseases and mortality in the elderly. EBioMedicine. 2021; 63:103174. https://doi.org/10.1016/j.ebiom.2020.103174 [PubMed]
- 3. Vineis P, Avendano-Pabon M, Barros H, Bartley M, Carmeli C, Carra L, Chadeau-Hyam M, Costa G, Delpierre C, D’Errico A, Fraga S, Giles G, Goldberg M, et al. Special Report: The Biology of Inequalities in Health: The Lifepath Consortium. Front Public Health. 2020; 8:118. https://doi.org/10.3389/fpubh.2020.00118 [PubMed]
- 4. Palma-Gudiel H, Fañanás L, Horvath S, Zannas AS. Psychosocial stress and epigenetic aging. Int Rev Neurobiol. 2020; 150:107–28. https://doi.org/10.1016/bs.irn.2019.10.020 [PubMed]
- 5. Oblak L, van der Zaag J, Higgins-Chen AT, Levine ME, Boks MP. A systematic review of biological, social and environmental factors associated with epigenetic clock acceleration. Ageing Res Rev. 2021; 69:101348. https://doi.org/10.1016/j.arr.2021.101348 [PubMed]
- 6. Hannum G, Guinney J, Zhao L, Zhang L, Hughes G, Sadda S, Klotzle B, Bibikova M, Fan JB, Gao Y, Deconde R, Chen M, Rajapakse I, et al. Genome-wide methylation profiles reveal quantitative views of human aging rates. Mol Cell. 2013; 49:359–67. https://doi.org/10.1016/j.molcel.2012.10.016 [PubMed]
- 7. Robinson O, Chadeau Hyam M, Karaman I, Climaco Pinto R, Ala-Korpela M, Handakas E, Fiorito G, Gao H, Heard A, Jarvelin MR, Lewis M, Pazoki R, Polidoro S, et al. Determinants of accelerated metabolomic and epigenetic aging in a UK cohort. Aging Cell. 2020; 19:e13149. https://doi.org/10.1111/acel.13149 [PubMed]
- 8. McCrory C, Fiorito G, Hernandez B, Polidoro S, O'Halloran AM, Hever A, NiCheallaigh C, Lu AT, Horvath S, Vineis P. Association of 4 epigenetic clocks with measures of functional health, cognition, and all-cause mortality in The Irish Longitudinal Study on Ageing (TILDA). bioRxiv. 2020. https://doi.org/10.1101/2020.04.27.063164
- 9. Fiorito G, McCrory C, Robinson O, Carmeli C, Ochoa-Rosales C, Zhang Y, Colicino E, Dugué PA, Artaud F, McKay GJ, Jeong A, Mishra PP, Nøst TH, et al, and BIOS Consortium, and Lifepath consortium. Socioeconomic position, lifestyle habits and biomarkers of epigenetic aging: a multi-cohort analysis. Aging (Albany NY). 2019; 11:2045–70. https://doi.org/10.18632/aging.101900 [PubMed]
- 10. White AJ, Kresovich JK, Xu Z, Sandler DP, Taylor JA. Shift work, DNA methylation and epigenetic age. Int J Epidemiol. 2019; 48:1536–44. https://doi.org/10.1093/ije/dyz027 [PubMed]
- 11. McCrory C, Fiorito G, Ni Cheallaigh C, Polidoro S, Karisola P, Alenius H, Layte R, Seeman T, Vineis P, Kenny RA. How does socio-economic position (SEP) get biologically embedded? A comparison of allostatic load and the epigenetic clock(s). Psychoneuroendocrinology. 2019; 104:64–73. https://doi.org/10.1016/j.psyneuen.2019.02.018 [PubMed]
- 12. Lawrence KG, Kresovich JK, O’Brien KM, Hoang TT, Xu Z, Taylor JA, Sandler DP. Association of Neighborhood Deprivation With Epigenetic Aging Using 4 Clock Metrics. JAMA Netw Open. 2020; 3:e2024329. https://doi.org/10.1001/jamanetworkopen.2020.24329 [PubMed]
- 13. McGuinness D, McGlynn LM, Johnson PC, MacIntyre A, Batty GD, Burns H, Cavanagh J, Deans KA, Ford I, McConnachie A, McGinty A, McLean JS, Millar K, et al. Socio-economic status is associated with epigenetic differences in the pSoBid cohort. Int J Epidemiol. 2012; 41:151–60. https://doi.org/10.1093/ije/dyr215 [PubMed]
- 14. Fiorito G, Polidoro S, Dugué PA, Kivimaki M, Ponzi E, Matullo G, Guarrera S, Assumma MB, Georgiadis P, Kyrtopoulos SA, Krogh V, Palli D, Panico S, et al. Social adversity and epigenetic aging: a multi-cohort study on socioeconomic differences in peripheral blood DNA methylation. Sci Rep. 2017; 7:16266. https://doi.org/10.1038/s41598-017-16391-5 [PubMed]
- 15. Simons RL, Lei MK, Beach SR, Philibert RA, Cutrona CE, Gibbons FX, Barr A. Economic hardship and biological weathering: The epigenetics of aging in a U.S. sample of black women. Soc Sci Med. 2016; 150:192–200. https://doi.org/10.1016/j.socscimed.2015.12.001 [PubMed]
- 16. Hughes A, Smart M, Gorrie-Stone T, Hannon E, Mill J, Bao Y, Burrage J, Schalkwyk L, Kumari M. Socioeconomic Position and DNA Methylation Age Acceleration Across the Life Course. Am J Epidemiol. 2018; 187:2346–54. https://doi.org/10.1093/aje/kwy155 [PubMed]
- 17. Kankaanpää A, Tolvanen A, Bollepalli S, Leskinen T, Kujala UM, Kaprio J, Ollikainen M, Sillanpää E. Leisure-Time and Occupational Physical Activity Associates Differently with Epigenetic Aging. Med Sci Sports Exerc. 2021; 53:487–95. https://doi.org/10.1249/MSS.0000000000002498 [PubMed]
- 18. Carugno M, Maggioni C, Ruggiero V, Crespi E, Monti P, Ferrari L, Pesatori AC. Can Night Shift Work Affect Biological Age? Hints from a Cross-Sectional Study on Hospital Female Nurses. Int J Environ Res Public Health. 2021; 18:10639. https://doi.org/10.3390/ijerph182010639 [PubMed]
- 19. Bakusic J, Schaufeli W, Claes S, Godderis L. Stress, burnout and depression: A systematic review on DNA methylation mechanisms. J Psychosom Res. 2017; 92:34–44. https://doi.org/10.1016/j.jpsychores.2016.11.005 [PubMed]
- 20. Duman EA, Canli T. Influence of life stress, 5-HTTLPR genotype, and SLC6A4 methylation on gene expression and stress response in healthy Caucasian males. Biol Mood Anxiety Disord. 2015; 5:2. https://doi.org/10.1186/s13587-015-0017-x [PubMed]
- 21. Alasaari JS, Lagus M, Ollila HM, Toivola A, Kivimäki M, Vahtera J, Kronholm E, Härmä M, Puttonen S, Paunio T. Environmental stress affects DNA methylation of a CpG rich promoter region of serotonin transporter gene in a nurse cohort. PLoS One. 2012; 7:e45813. https://doi.org/10.1371/journal.pone.0045813 [PubMed]
- 22. Miyaki K, Song Y, Suzuki T, Eguchi H, Kawakami N. DNA Methylation Status of the Methylenetetrahydrofolate Reductase Gene is associated with Depressive Symptoms in Japanese Workers: A Cross-Sectional Study. J Neurol Neurol Disord. 2015; 2:304. https://doi.org/10.15744/2454-4981.2.304
- 23. Emeny RT, Zierer A, Lacruz ME, Baumert J, Herder C, Gornitzka G, Koenig W, Thorand B, Ladwig KH, and KORA Investigators. Job strain-associated inflammatory burden and long-term risk of coronary events: findings from the MONICA/KORA Augsburg case-cohort study. Psychosom Med. 2013; 75:317–25. https://doi.org/10.1097/PSY.0b013e3182860d63 [PubMed]
- 24. Kivimäki M, Nyberg ST, Batty GD, Fransson EI, Heikkilä K, Alfredsson L, Bjorner JB, Borritz M, Burr H, Casini A, Clays E, De Bacquer D, Dragano N, et al, and IPD-Work Consortium. Job strain as a risk factor for coronary heart disease: a collaborative meta-analysis of individual participant data. Lancet. 2012; 380:1491–7. https://doi.org/10.1016/S0140-6736(12)60994-5 [PubMed]
- 25. Nyberg ST, Fransson EI, Heikkilä K, Ahola K, Alfredsson L, Bjorner JB, Borritz M, Burr H, Dragano N, Goldberg M, Hamer M, Jokela M, Knutsson A, et al, and IPD-Work Consortium. Job strain as a risk factor for type 2 diabetes: a pooled analysis of 124,808 men and women. Diabetes Care. 2014; 37:2268–75. https://doi.org/10.2337/dc13-2936 [PubMed]
- 26. Hintsanen M, Kivimäki M, Elovainio M, Pulkki-Råback L, Keskivaara P, Juonala M, Raitakari OT, Keltikangas-Järvinen L. Job strain and early atherosclerosis: the Cardiovascular Risk in Young Finns study. Psychosom Med. 2005; 67:740–7. https://doi.org/10.1097/01.psy.0000181271.04169.93 [PubMed]
- 27. Song Y, Miyaki K, Suzuki T, Sasaki Y, Tsutsumi A, Kawakami N, Shimazu A, Takahashi M, Inoue A, Kan C, Kurioka S, Shimbo T. Altered DNA methylation status of human brain derived neurotrophis factor gene could be useful as biomarker of depression. Am J Med Genet B Neuropsychiatr Genet. 2014; 165:357–64. https://doi.org/10.1002/ajmg.b.32238 [PubMed]
- 28. Cosmides L, Tooby J. Cognitive adaptations for social exchange. The adapted mind: Evolutionary psychology and the generation of culture. 1992; 163:163–228.
- 29. Dragano N, Siegrist J, Nyberg ST, Lunau T, Fransson EI, Alfredsson L, Bjorner JB, Borritz M, Burr H, Erbel R, Fahlén G, Goldberg M, Hamer M, et al, and IPD-Work consortium. Effort-Reward Imbalance at Work and Incident Coronary Heart Disease: A Multicohort Study of 90,164 Individuals. Epidemiology. 2017; 28:619–26. https://doi.org/10.1097/EDE.0000000000000666 [PubMed]
- 30. Siegrist J, Li J. Work Stress and Altered Biomarkers: A Synthesis of Findings Based on the Effort-Reward Imbalance Model. Int J Environ Res Public Health. 2017; 14:1373. https://doi.org/10.3390/ijerph14111373 [PubMed]
- 31. Levine ME, Lu AT, Quach A, Chen BH, Assimes TL, Bandinelli S, Hou L, Baccarelli AA, Stewart JD, Li Y, Whitsel EA, Wilson JG, Reiner AP, et al. An epigenetic biomarker of aging for lifespan and healthspan. Aging (Albany NY). 2018; 10:573–91. https://doi.org/10.18632/aging.101414 [PubMed]
- 32. Lu AT, Quach A, Wilson JG, Reiner AP, Aviv A, Raj K, Hou L, Baccarelli AA, Li Y, Stewart JD, Whitsel EA, Assimes TL, Ferrucci L, Horvath S. DNA methylation GrimAge strongly predicts lifespan and healthspan. Aging (Albany NY). 2019; 11:303–27. https://doi.org/10.18632/aging.101684 [PubMed]
- 33. Belsky DW, Caspi A, Arseneault L, Baccarelli A, Corcoran DL, Gao X, Hannon E, Harrington HL, Rasmussen LJ, Houts R, Huffman K, Kraus WE, Kwon D, et al. Quantification of the pace of biological aging in humans through a blood test, the DunedinPoAm DNA methylation algorithm. Elife. 2020; 9:e54870. https://doi.org/10.7554/eLife.54870 [PubMed]
- 34. Duchaine CS, Aubé K, Gilbert-Ouimet M, Vézina M, Ndjaboué R, Massamba V, Talbot D, Lavigne-Robichaud M, Trudel X, Pena-Gralle AB, Lesage A, Moore L, Milot A, et al. Psychosocial Stressors at Work and the Risk of Sickness Absence Due to a Diagnosed Mental Disorder: A Systematic Review and Meta-analysis. JAMA Psychiatry. 2020; 77:842–51. https://doi.org/10.1001/jamapsychiatry.2020.0322 [PubMed]
- 35. Madsen IE, Nyberg ST, Magnusson Hanson LL, Ferrie JE, Ahola K, Alfredsson L, Batty GD, Bjorner JB, Borritz M, Burr H, Chastang JF, de Graaf R, Dragano N, et al, and IPD-Work Consortium. Job strain as a risk factor for clinical depression: systematic review and meta-analysis with additional individual participant data. Psychol Med. 2017; 47:1342–56. https://doi.org/10.1017/S003329171600355X [PubMed]
- 36. Rugulies R, Aust B, Madsen IE. Effort-reward imbalance at work and risk of depressive disorders. A systematic review and meta-analysis of prospective cohort studies. Scand J Work Environ Health. 2017; 43:294–306. https://doi.org/10.5271/sjweh.3632 [PubMed]
- 37. Cillekens B, Huysmans MA, Holtermann A, van Mechelen W, Straker L, Krause N, van der Beek AJ, Coenen P. Physical activity at work may not be health enhancing. A systematic review with meta-analysis on the association between occupational physical activity and cardiovascular disease mortality covering 23 studies with 655 892 participants. Scand J Work Environ Health. 2021; 3993. https://doi.org/10.5271/sjweh.3993 [PubMed]
- 38. Ek E, Ala-Mursula L, Velázquez RG, Tolvanen A, Salmela-Aro K. Employment trajectories until midlife associate with early social role investments and current work-related well-being. Advances in Life Course Research. 2021; 47:100391. https://doi.org/10.1016/j.alcr.2020.100391
- 39. Schaufeli WB, Bakker AB, Van Rhenen W. How changes in job demands and resources predict burnout, work engagement, and sickness absenteeism. Journal of Organizational Behavior: The International Journal of Industrial, Occupational and Organizational Psychology and Behavior. 2009; 30:893–917. https://doi.org/10.1002/job.595
- 40. Virtanen M, Nyberg ST, Batty GD, Jokela M, Heikkilä K, Fransson EI, Alfredsson L, Bjorner JB, Borritz M, Burr H, Casini A, Clays E, De Bacquer D, et al, and IPD-Work Consortium. Perceived job insecurity as a risk factor for incident coronary heart disease: systematic review and meta-analysis. BMJ. 2013; 347:f4746. https://doi.org/10.1136/bmj.f4746 [PubMed]
- 41. Rivera AS, Akanbi M, O’Dwyer LC, McHugh M. Shift work and long work hours and their association with chronic health conditions: A systematic review of systematic reviews with meta-analyses. PLoS One. 2020; 15:e0231037. https://doi.org/10.1371/journal.pone.0231037 [PubMed]
- 42. Virtanen M, Kivimäki M. Long Working Hours and Risk of Cardiovascular Disease. Curr Cardiol Rep. 2018; 20:123. https://doi.org/10.1007/s11886-018-1049-9 [PubMed]
- 43. Virtanen M, Ferrie JE, Gimeno D, Vahtera J, Elovainio M, Singh-Manoux A, Marmot MG, Kivimäki M. Long working hours and sleep disturbances: the Whitehall II prospective cohort study. Sleep. 2009; 32:737–45. https://doi.org/10.1093/sleep/32.6.737 [PubMed]
- 44. Nakashima M, Morikawa Y, Sakurai M, Nakamura K, Miura K, Ishizaki M, Kido T, Naruse Y, Suwazono Y, Nakagawa H. Association between long working hours and sleep problems in white-collar workers. J Sleep Res. 2011; 20:110–6. https://doi.org/10.1111/j.1365-2869.2010.00852.x [PubMed]
- 45. Virtanen M, Magnusson Hansson L, Goldberg M, Zins M, Stenholm S, Vahtera J, Westerlund H, Kivimäki M. Long working hours, anthropometry, lung function, blood pressure and blood-based biomarkers: cross-sectional findings from the CONSTANCES study. J Epidemiol Community Health. 2019; 73:130–5. https://doi.org/10.1136/jech-2018-210943 [PubMed]
- 46. Weston G, Zilanawala A, Webb E, Carvalho LA, McMunn A. Long work hours, weekend working and depressive symptoms in men and women: findings from a UK population-based study. J Epidemiol Community Health. 2019; 73:465–74. https://doi.org/10.1136/jech-2018-211309 [PubMed]
- 47. Beydoun MA, Hossain S, Chitrala KN, Tajuddin SM, Beydoun HA, Evans MK, Zonderman AB. Association between epigenetic age acceleration and depressive symptoms in a prospective cohort study of urban-dwelling adults. J Affect Disord. 2019; 257:64–73. https://doi.org/10.1016/j.jad.2019.06.032 [PubMed]
- 48. Han LK, Aghajani M, Clark SL, Chan RF, Hattab MW, Shabalin AA, Zhao M, Kumar G, Xie LY, Jansen R, Milaneschi Y, Dean B, Aberg KA, et al. Epigenetic Aging in Major Depressive Disorder. Am J Psychiatry. 2018; 175:774–82. https://doi.org/10.1176/appi.ajp.2018.17060595 [PubMed]
- 49. Rivera-Torres P, Araque-Padilla RA, Montero-Simó MJ. Job stress across gender: the importance of emotional and intellectual demands and social support in women. Int J Environ Res Public Health. 2013; 10:375–89. https://doi.org/10.3390/ijerph10010375 [PubMed]
- 50. Gadinger MC, Fischer JE, Schneider S, Terris DD, Krückeberg K, Yamamoto S, Frank G, Kromm W. Gender moderates the health-effects of job strain in managers. Int Arch Occup Environ Health. 2010; 83:531–41. https://doi.org/10.1007/s00420-009-0477-7 [PubMed]
- 51. Wege N, Li J, Siegrist J. Are there gender differences in associations of effort-reward imbalance at work with self-reported doctor-diagnosed depression? Prospective evidence from the German Socio-Economic Panel. Int Arch Occup Environ Health. 2018; 91:435–43. https://doi.org/10.1007/s00420-018-1293-8 [PubMed]
- 52. Gibson J, Russ TC, Clarke TK, Howard DM, Hillary RF, Evans KL, Walker RM, Bermingham ML, Morris SW, Campbell A, Hayward C, Murray AD, Porteous DJ, et al. A meta-analysis of genome-wide association studies of epigenetic age acceleration. PLoS Genet. 2019; 15:e1008104. https://doi.org/10.1371/journal.pgen.1008104 [PubMed]
- 53. Lau CE, Robinson O. DNA methylation age as a biomarker for cancer. Int J Cancer. 2021; 148:2652–63. https://doi.org/10.1002/ijc.33451 [PubMed]
- 54. Kresovich JK, Martinez Lopez AM, Garval EL, Xu Z, White AJ, Sandler DP, Taylor JA. Alcohol Consumption and Methylation-Based Measures of Biological Age. J Gerontol A Biol Sci Med Sci. 2021; 76:2107–11. https://doi.org/10.1093/gerona/glab149 [PubMed]
- 55. Singmann P, Shem-Tov D, Wahl S, Grallert H, Fiorito G, Shin SY, Schramm K, Wolf P, Kunze S, Baran Y, Guarrera S, Vineis P, Krogh V, et al. Characterization of whole-genome autosomal differences of DNA methylation between men and women. Epigenetics Chromatin. 2015; 8:43. https://doi.org/10.1186/s13072-015-0035-3 [PubMed]
- 56. Quach A, Levine ME, Tanaka T, Lu AT, Chen BH, Ferrucci L, Ritz B, Bandinelli S, Neuhouser ML, Beasley JM, Snetselaar L, Wallace RB, Tsao PS, et al. Epigenetic clock analysis of diet, exercise, education, and lifestyle factors. Aging (Albany NY). 2017; 9:419–46. https://doi.org/10.18632/aging.101168 [PubMed]
- 57. McCrory C, Fiorito G, Hernandez B, Polidoro S, O'Halloran AM, Hever A, Ni Cheallaigh C, Lu AT, Horvath S, Vineis P, Kenny RA. GrimAge Outperforms Other Epigenetic Clocks in the Prediction of Age-Related Clinical Phenotypes and All-Cause Mortality. J Gerontol A Biol Sci Med Sci. 2021; 76:741–9. https://doi.org/10.1093/gerona/glaa286 [PubMed]
- 58. Karasek R, Brisson C, Kawakami N, Houtman I, Bongers P, Amick B. The Job Content Questionnaire (JCQ): an instrument for internationally comparative assessments of psychosocial job characteristics. J Occup Health Psychol. 1998; 3:322–55. https://doi.org/10.1037//1076-8998.3.4.322 [PubMed]
- 59. Freni-Sterrantino A, Salerno V. A Plea for the Need to Investigate the Health Effects of Gig-Economy. Front Public Health. 2021; 9:638767. https://doi.org/10.3389/fpubh.2021.638767 [PubMed]
- 60. Rantakallio P. Groups at risk in low birth weight infants and perinatal mortality. Acta Paediatr Scand. 1969; 193. [PubMed]
- 61. Rantakallio P. The longitudinal study of the northern Finland birth cohort of 1966. Paediatr Perinat Epidemiol. 1988; 2:59–88. https://doi.org/10.1111/j.1365-3016.1988.tb00180.x [PubMed]
- 62. Wiklund P, Karhunen V, Richmond RC, Parmar P, Rodriguez A, De Silva M, Wielscher M, Rezwan FI, Richardson TG, Veijola J, Herzig KH, Holloway JW, Relton CL, et al. DNA methylation links prenatal smoking exposure to later life health outcomes in offspring. Clin Epigenetics. 2019; 11:97. https://doi.org/10.1186/s13148-019-0683-4 [PubMed]
- 63. Levine ME. Modeling the rate of senescence: can estimated biological age predict mortality more accurately than chronological age? J Gerontol A Biol Sci Med Sci. 2013; 68:667–74. https://doi.org/10.1093/gerona/gls233 [PubMed]
- 64. Siegrist J. Adverse health effects of high-effort/low-reward conditions. J Occup Health Psychol. 1996; 1:27–41. https://doi.org/10.1037//1076-8998.1.1.27 [PubMed]
- 65. Kahn H, Wiener AJ. year 2000; a framework for speculation on the next thirty-three years 1967. FAO of UN. https://agris.fao.org/agris-search/search.do?recordID=US201300314687.
- 66. Schaufeli W, Salanova M, González-Romà, Bakker A. The measurement of Engagement and Burnout: A two sample confirmatory factor anañytic approach. 2008; 3:71–92. https://doi.org/10.1023/A:1015630930326
- 67. Rautio N, Varanka-Ruuska T, Vaaramo E, Palaniswamy S, Nedelec R, Miettunen J, Karppinen J, Auvinen J, Järvelin MR, Keinänen-Kiukaanniemi S, Sebert S, Ala-Mursula L. Accumulated exposure to unemployment is related to impaired glucose metabolism in middle-aged men: A follow-up of the Northern Finland Birth Cohort 1966. Prim Care Diabetes. 2017; 11:365–72. https://doi.org/10.1016/j.pcd.2017.03.010 [PubMed]
- 68. Tammelin T, Näyhä S, Hills AP, Järvelin MR. Adolescent participation in sports and adult physical activity. Am J Prev Med. 2003; 24:22–8. https://doi.org/10.1016/s0749-3797(02)00575-5 [PubMed]