


Introduction
Nonalcoholic hepatic steatosis (NHS) is the most common liver disease in the world and is associated with increased the risk of cardiovascular disease, type-2 diabetes, and liver-related complications such as hepatocellular carcinoma [1–3]. The occurrence and progression of NHS result from a combination of multiple genetic and environmental factors [1]. However, the factors that are currently known represent only a small fraction of those involved in disease onset and progression. Thus, the mechanisms underlying the pathogenesis of NHS are not fully understood, which limits the development of drugs for this disease.
Several studies have explored the characteristics of the gut microbiota in patients with NHS [1, 4]. Compared to healthy individuals, a consistently altered microbiome signature, characterized by increased abundance of Proteobacteria, Enterobacteriaceae, Dorea, and Escherichia and decreased abundance of Ruminococcaceae, Rikenellaceae, and Coprococcus, is found in NHS patients [4–9]. However, large discrepancies are still observed across studies [4, 5, 7–10], which may be attributed to the heterogeneity arising from distinct geographical regions, ethnicity, and population characteristics [4]. Long-term hyperglycemia or medications such as metformin were in turn reported to be important confounding factors [5].
Accumulating evidence indicates that the gut microbiota affects the health of the host by activating signaling along the gut-liver, gut-brain, gut-renal, and gut-lung axes [11–14]. Signaling through the gut-liver axis plays important roles in NHS by regulating glucose, lipid, and amino acid metabolism [5, 15–17]. In this regard, several metabolites produced by gut bacteria, notably short-chain fatty acids (SCFAs), as well as metabolic intermediates of the tryptophan and phenylalanine degradation cycles, have been associated with hepatic steatosis risk and development [5, 15–17]. However, the mechanisms underlying gut-liver signaling pathways relevant to NHS in nondiabetic adults are still far from clear. Through an integrative multi-omics approach combining clinical phenotyping, gut microbiota analysis, fecal metabolomics, and fecal microbiota transplantation (FMT) assays in germ-free (GF) mice, the present study highlights the potential contribution of gut microbiota changes and differentially expressed microbial-associated metabolites to NHS pathology in nondiabetic adults.
Results
Characteristics of the study participants
Sex distribution, but not age, was significantly different between controls and NHS patients (P < 0.05). Body mass index (BMI), triglyceride (TG), total cholesterol (TC), high-density lipoprotein cholesterol (HDL-C), low-density lipoprotein cholesterol (LDL-C), fasting blood glucose, alanine aminotransferase (ALT), aspartate aminotransferase (AST), gamma glutamyl transferase (GGT), and uric acid were higher in NHS patients than in controls (P < 0.05) (Supplementary Table 1).
Gut microbiota composition is altered in NHS patients
To identify whether NHS is associated with changes in gut microbiota composition, we performed amplification of variable regions 3 and 4 of the 16S rRNA gene in fecal samples from 91 Chinese individuals. Species diversity, indicated by the Shannon index, showed no significant differences between groups (Figure 1A). However, marked changes in the gut microbiota composition of NHS patients were revealed by taxon-based analysis. Linear discriminant analysis effect size (LefSe) showed that the abundance of phyla Proteobacteria and Fusobacteria was higher in NHS than in controls. The abundance of families Enterobacteriaceae, Coriobacteriaceae, Fusobacteriaceae, Moraxellaceae, Actinomycetaceae, and Carnobacteriaceae was higher, while the abundance of the Dehalobacteriaceae family was lower, in NHS compared to control samples. Genera analysis showed in turn increased abundance of Shigella, Collinsella, Megamonas, Leuconostoc, Acinetobacter, and Actinomyces and decreased abundance of Lachnospira, Anaerostipes, Butyricimonas, Odoribacter, Anaerofustis, and Dehalobacterium in NHS subjects relative to controls (Figure 1B).
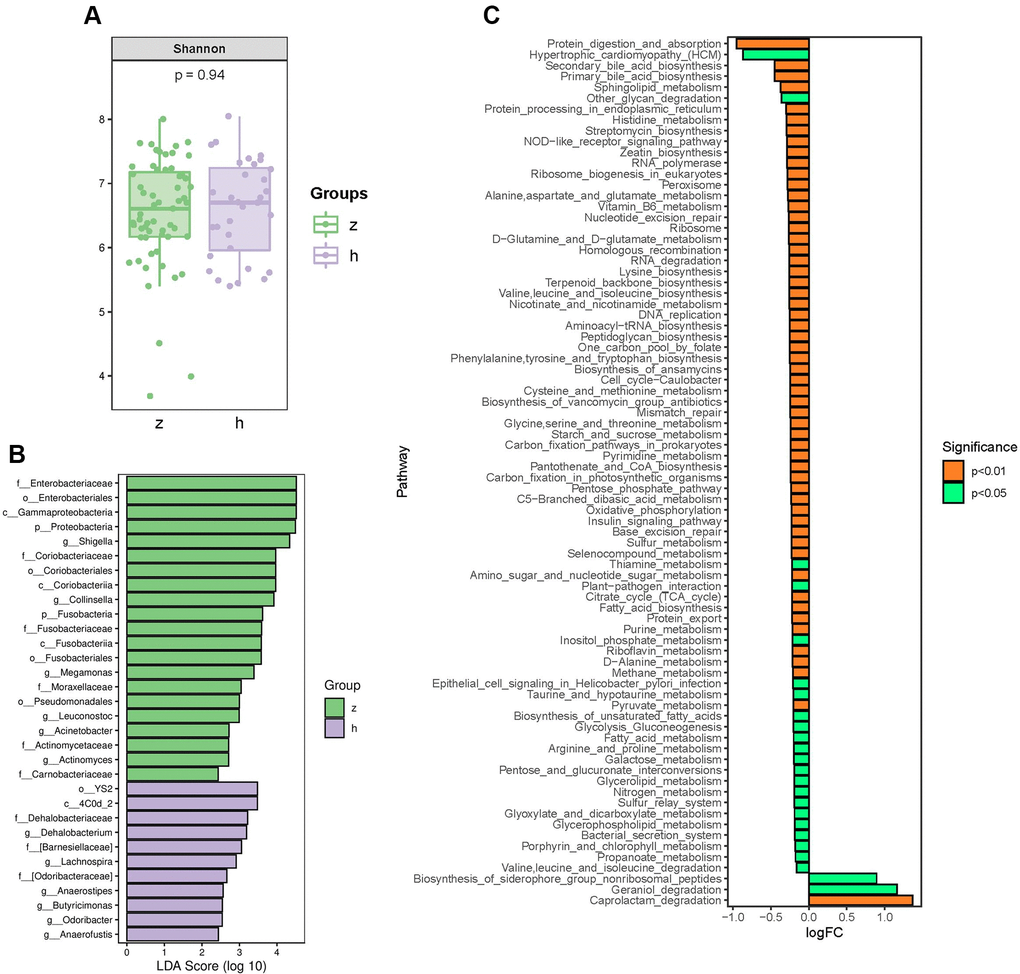
Figure 1. Analysis of bacterial community structure by 16S rRNA sequencing. (A) Alpha diversity analysis of gut microbiome in control and NHS stool samples. (B) LefSe analysis of gut microbiota composition in NHS. (C) KEGG pathway analysis of differentially abundant gut microbiota between control and NHS; h: control group; z: NHS group.
Logistic regression analyses with steatosis as the dependent variable showed that the changes observed in the family Coriobacteriaceae and the genera Collinsella, Acinetobacter, and Lachnospira were still significant after adjusting for age, sex, and BMI (P < 0.05) (Supplementary Table 2). Based on self-reported dietary intake data, Collinsella abundance was associated with intake of processed meat, meat, and beverages, while Acinetobacter abundance was associated with intake of meat (P < 0.05) (Supplementary Figure 1).
Functional alterations in gut microbiota from NHS patients
To identify functional NHS-related changes in gut microbiota, the Welch’s t-test was applied to examine group differences in the relative abundance of Kyoto Encyclopedia of Genes and Genomes (KEGG) pathways. Significantly differentially enriched pathways between controls and NHS subjects included protein digestion and absorption; alanine, aspartate and glutamate metabolism; histidine metabolism; valine, leucine and isoleucine biosynthesis; valine, leucine and isoleucine degradation; glycine, serine and threonine metabolism; lysine biosynthesis; cysteine and methionine metabolism; D-alanine metabolism; arginine and proline metabolism; phenylalanine, tyrosine and tryptophan biosynthesis; secondary bile acid biosynthesis; and primary bile acid biosynthesis (P < 0.05) (Figure 1C).
Association of gut microbiota with clinical indices
To identify correlations between gut microbiota patterns and clinical indices, we performed Spearman’s rank correlation analysis. As shown in Figure 2, the genus Collinsella had positive associations with TG, uric acid, ALT, AST, and GGT; the genus Acinetobacter was positively associated with TG, HDL-C, ALT, AST, and GGT; and the Lachnospira genus was negatively associated with ALT and AST (P < 0.05).
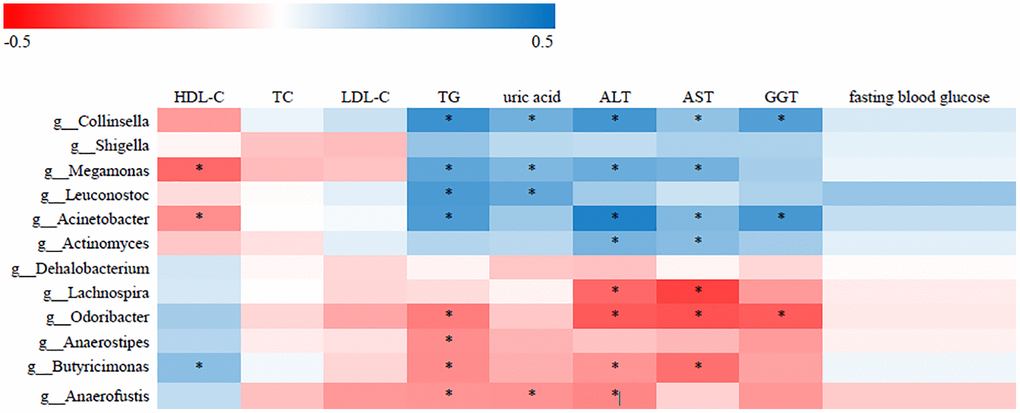
Figure 2. Correlative relationships between discriminatory gut microbiota and clinical indices. X-axis: clinical indices; Y-axis: genus; color scale represents Spearman’s correlation coefficient; red denotes strong negative correlations; blue denotes strong positive correlations; *P < 0.05).
Fecal metabolomics analysis
To investigate more comprehensively the microbe-host interactions with potential impact on NHS, we conducted fecal metabolic profiling in the 91 study subjects by LC-MS/MS, using both positive and negative ion modes. Supervised clustering based on orthogonal partial least square-discriminant analysis (OPLS-DA) was then performed to discriminate the metabolic profiles across groups. OPLS-DA score plots for fecal samples from the NHS and control groups are shown in Figure 3A and 3B. There were 530 upregulated and 240 downregulated metabolites in positive ion mode and 200 upregulated and 68 downregulated metabolites in negative ion mode between NHS and controls (Figure 3C and 3D). KEGG analysis revealed that ‘phenylalanine, tyrosine and tryptophan biosynthesis’ and ‘biosynthesis of secondary metabolites’ were the main pathways enriched by the differentially expressed metabolites (Figure 3E and 3F). Based on the results of our KEGG pathway analysis of gut microbiota and fecal metabolomics, as well as published reports, we focused on phenylalanine, tyrosine, and tryptophan biosynthesis and metabolism, bile acid biosynthesis and metabolism, and SCFAs. With this criterion, representative differentially upregulated metabolites included kynurenine, 3-indoleacetonitrile, tryptamine, 3-(3-indolyl)-2-oxopropanoic acid, L-phenylalanine, L-homophenylalanine, 3-(2-Hydroxyphenyl)propanoic acid, chenodeoxycholic acid, and cholic acid, whereas representative differentially downregulated metabolites included L-tryptophan and acetate (Figure 3G).
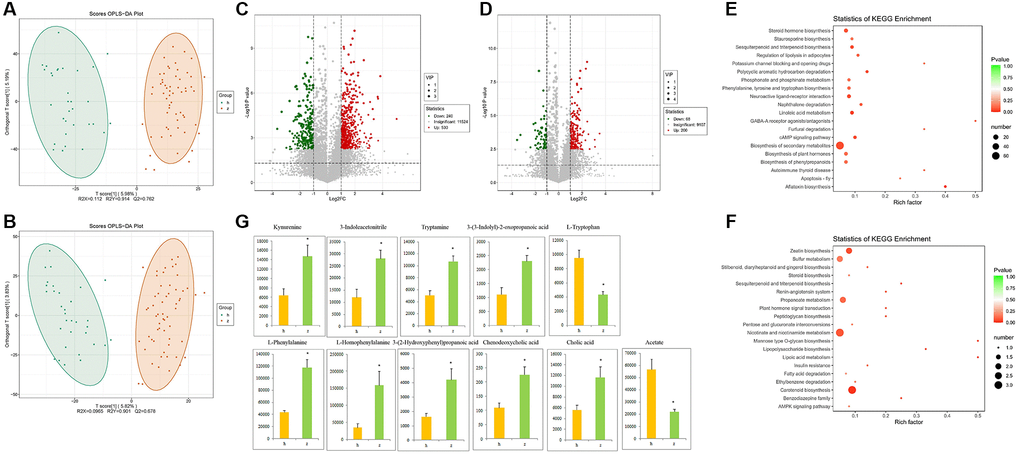
Figure 3. Fecal metabolomics analysis. (A) OPLS-DA score plots in positive ion mode. (B) OPLS-DA score plots in negative ion mode. (C) Differentially regulated metabolites in positive ion mode. (D) Differentially regulated metabolites in negative ion mode. (E–F) KEGG pathway analysis of differentially expressed metabolites in positive and negative ion modes. (G) Representative differential metabolites. Data are mean ± SE; h: control group; z: NHS group; *P < 0.05.
Associations of gut microbiota with fecal metabolites
The relationship between the 12 most differentially represented genera and the 11 representative differential metabolites identified in NHS patients was then examined by correlation analysis. Results showed that abundance of the genus Collinsella was positively associated with the levels of kynurenine, 3-indoleacetonitrile, tryptamine, and 3-(3-indolyl)-2-oxopropanoic acid, and negatively associated with L-tryptophan level (P < 0.05). Abundance of the genus Acinetobacter was in turn positively associated with the levels of kynurenine, 3-indoleacetonitrile, and 3-(3-indolyl)-2-oxopropanoic acid (P < 0.05). The genera Collinsella and Acinetobacter were both associated with tryptophan metabolism. Among the tryptophan metabolites assessed, only with 3-(3-indolyl)-2-oxopropanoic acid showed an association with diet (Supplementary Figure 2). Over 95% of tryptophan is metabolized by the kynurenine pathway. Interestingly, ROC analysis demonstrated that the combination of tryptophan and kynurenine could discriminate NHS patients from controls with good statistical power [P < 0.05; AUC = 0.833 (95% CI, 0.747 to 0.918)] (Supplementary Figure 3).
Chenodeoxycholic acid level was positively associated with the abundance of Collinsella and Acinetobacter and negatively associated with the abundance of Lachnospira (P < 0.05). Cholic acid level was positively associated with the abundance of Acinetobacter and negatively associated with the abundance of Lachnospira (p < 0.05). L-Homophenylalanine level was positively associated with the abundance of both Collinsella and Acinetobacter (P < 0.05) (Figure 4).
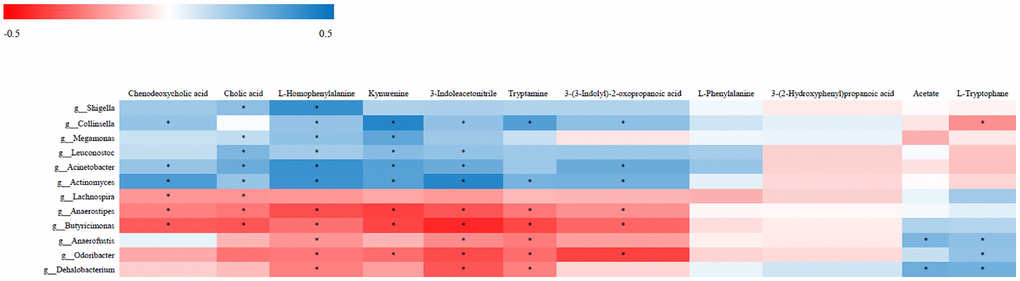
Figure 4. Correlative relationships between discriminatory gut microbiota and representative fecal metabolites. X-axis: fecal metabolites; Y-axis: genus; color scale represents Spearman’s correlation coefficient; red denotes strong negative correlations; blue denotes strong positive correlations; *P < 0.05.
FMT reproduces clinical and metabolic features of NHS in germ-free mice
To further investigate whether activation of gut microbiota-kynurenine-liver axis contributes to the development of NHS, fecal bacteria from control and NHS patients were transplanted into GF mice. Oil Red O staining revealed significant intrahepatic lipid accumulation in GF mice colonized by gut bacteria from NHS patients, compared to mice that received gut microbiota from control subjects (Figure 5A). In addition, serum kynurenine levels were significantly increased in GF mice transplanted with NHS samples (P < 0.05), while no significant difference was found between the two groups regarding serum L-tryptophan levels (Figure 5B).
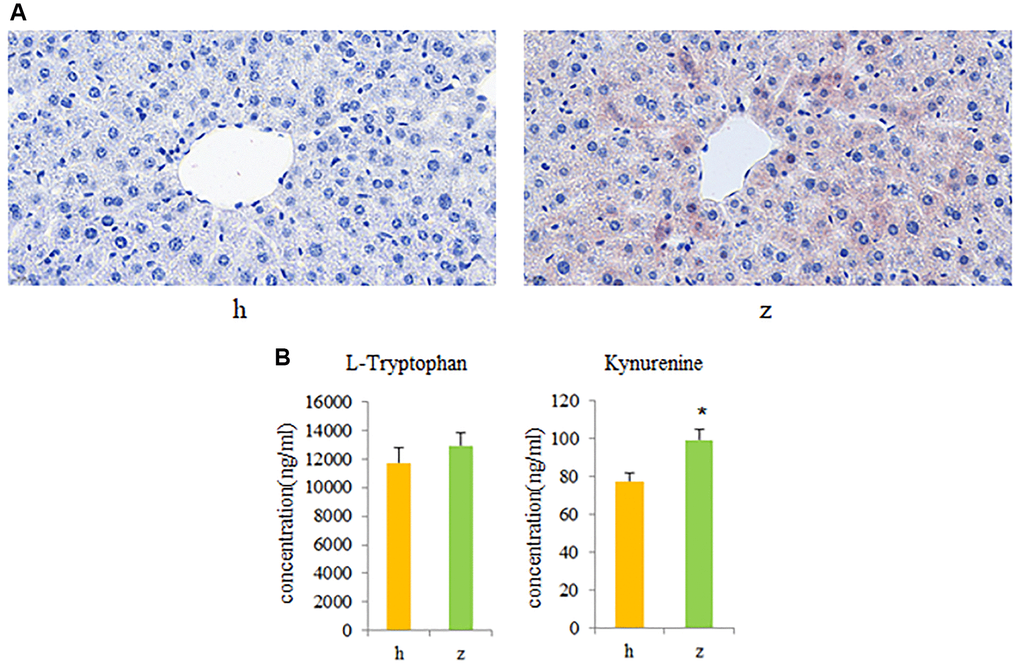
Figure 5. Fecal microbiota transplantation (FMT) findings. (A) Histopathological examination of liver tissue in GF mice colonized with gut microbiota from healthy controls or NHS patients (Oil Red O staining). (B) L-tryptophan and kynurenine quantification by UPLC-MS/MS. Data are mean ± SE; h: control group; z: NHS group; *P < 0.05.
Discussion
Clinical and animal studies have shown that dysbiosis of the gut microbiota represents an independent risk factor for NHS [1, 5]. Indeed, since alterations the gut microbiota can contribute to insulin resistance, chronic inflammation, and disorders of glucose, lipid, and amino acid metabolism, the gut microbiota is considered an important target for NHS treatment [1, 18]. Our study showed that the phylum Proteobacteria, the family Enterobacteriaceae, and the genera Collinsella and Acinetobacter were enriched, while the abundance of the genus Lachnospira was decreased, in nondiabetic adults with NHS. The observed increase in the relative abundance of Proteobacteria and Enterobacteriaceae was indeed consistent with the results of previous studies [5, 8]. Research showed that Proteobacteria facilitate the development of hepatic steatosis by regulating endotoxin production and the immune response [19, 20]. The risk of developing NHS is also increased by overrepresentation of Enterobacteriaceae, which augment endogenous ethanol production [21]. Increased abundance of the genus Collinsella was reported in type 2 diabetes, non-alcoholic steatohepatitis, and rheumatoid arthritis, among other inflammatory conditions [22–27]. Collinsella (7α-dehydroxylating bacteria) was reported to metabolize bile acids to oxo-bile acid intermediates [28–30]. The production of these secondary bile acids may disrupt the intestinal mucosal barrier and participate in the development of NHS [28–30]. Accordingly, reduced Collinsella abundance following administration of the antibiotic rifaximin was associated with a drop in secondary fecal bile acid concentrations [30]. NHS patient samples showed also decreased abundance of Lachnospira, which are SCFA-producing bacteria. SCFAs have shown to confer many beneficial health effects, including maintaining the gut barrier, providing energy sources for enterocytes and colonocytes, inhibiting the proliferation of hepatic cells, and preventing inflammation [31–34].
Fecal metabolomics results showed that the levels of L-phenylalanine and cholic acid were upregulated, while those of acetate were downregulated, in fecal samples from NHS patients. L-phenylalanine, an essential amino acid, may be converted into tyrosine by phenylalanine hydroxylase [35]. Abnormal phenylalanine levels are associated with many health conditions, such as heart failure, obesity, hypertriglyceridemia, and type 2 diabetes [36–39]. Hoyles et al. found that plasma PAA, a phenylalanine-derived bacterial metabolite, was positively associated with liver steatosis severity. They further showed that mice treated with PAA for 2 weeks had significantly increased hepatic triglyceride accumulation [5]. Previous studies reported that increased cholic acid levels were associated with dyslipidemia, atherosclerosis, and non-alcoholic fatty liver disease (NAFLD) [40–44]. Cholic acid, a primary bile acid, is formed in the liver by cholesterol 7-hydroxylase (CYP7A1), the rate-limiting enzyme that regulates the synthesis of bile acids from cholesterol [44]. Yamada et al. showed that dietary cholic acid promoted NAFLD in pigs by activating local and systemic oxidative stress-induced signaling leading to macrophage mobilization [41]. Decreased production of acetate, a major intestinal and circulating SCFA produced by gut bacteria from dietary fiber metabolism, was also reported in many diseases, including NAFLD, obesity, cardiovascular disease, and type 2 diabetes [45–47]. In this regard, Sun et al. found that changes in the gut microbiota induced by a high-sucrose diet promoted the development of NAFLD in rats by reducing microbial production of SCFAs [16].
Several metabolites related to tryptophan metabolism, such as L-tryptophan, kynurenine, 3-indoleacetonitrile, tryptamine, and 3-(3-indolyl)-2-oxopropanoic acid, were also altered in fecal samples from NHS subjects. Three metabolic pathways of tryptophan in the intestine are directly and indirectly controlled by the gut microbiota: (a) direct conversion of tryptophan into several molecules, including indole-3-aldehyde (IAld) and indole-3-acetic acid (IAA); (b) the kynurenine pathway in epithelial and immune cells, initiated by indoleamine 2, 3-dioxygenase (IDO) 1; and (c) the 5-hydroxytryptamine (5-HT) production pathway in enterochromaffin cells, mediated by Trp hydroxylase 1 (TpH 1) [48]. Alterations in tryptophan metabolism are involved in the occurrence and development of many diseases, such as inflammatory bowel disease, irritable bowel syndrome, metabolic syndrome, obesity, infectious diseases, and neuropsychiatric disorders [48]. Our study revealed that fecal kynurenine level was higher in NHS patients than in controls. Correlation analysis showed that kynurenine level was positively associated with the abundance of genera Collinsella, Megamonas, Leuconostoc, Acinetobacter, and Actinomyces and negatively associated with abundance of the genera Anaerostipes, Butyricimonas, and Odoribacter. Consistently, FMT experiments showed that compared to controls, serum kynurenine was increased in GF mice colonized with gut bacteria from NHS patients. Kynurenine is a gut microbiota-derived metabolite of tryptophan via IDO1 catalysis. IDO1 upregulation is a hallmark of obesity, and its deletion or inhibition improves insulin sensitivity, preserves the gut mucosal barrier, decreases chronic inflammation, and regulates lipid metabolism in liver and adipose tissues [49]. Notably, kynurenine was shown to trigger obesity by binding to the aryl hydrocarbon receptor (AhR), and blocking IDO or AhR in mice significantly attenuated long-term high-fat diet-induced obesity and liver steatosis [50]. The abundance of the genus Collinsella was positively associated with the levels of kynurenine, 3-indoleacetonitrile, tryptamine, and 3-(3-indolyl)-2-oxopropanoic acid, and negatively associated with L-tryptophane. Although the association between increased Collinsella abundance and NAFLD has been reported [25], further work is required to determine whether Collinsella promotes the development of NHS in nondiabetic adults via the kynurenine pathway.
We acknowledge several limitations in this study. First, there was an unequal sex distribution in our study, which included more females in the control group and more males in the NHS group. Although our regression models were adjusted for sex, the effect of sex on gut microbiota is well established and may therefore affect our results [51]. Second, in our study sample NHS was proven by ultrasonic diagnosis. Unlike histology, which allows distinguishing between simple steatosis and steatohepatitis, ultrasonography allows for reliable and accurate detection of moderate-severe fatty liver [52].
In summary, this study revealed that alterations in the gut microbiota are associated with differential expression of fecal metabolites in nondiabetic adults with NHS. Specifically, our data supports a contributing role for kynurenine, a gut microbiota-derived tryptophan metabolite, in the pathogenesis of non-diabetic NHS and suggests that tryptophan/kynurenine levels may be reliable clinical biomarkers for this condition.
Materials and Methods
Samples
A total of 91 subjects were enrolled in this case-control study between March 2019 and March 2020 at the Sixth People’s Hospital of Shenyang, China. Fifty-nine patients proven by ultrasonic diagnosis were included. The inclusion criteria were: (1) Age 18–72 years; (2) no alcohol, or alcohol consumption equivalent to <210 g and <140 g of ethanol per week, for men and women, respectively; and (3) non-alcoholic hepatic steatosis proven by ultrasonic diagnosis. The exclusion criteria were: (1) hepatic steatosis caused by alcoholic liver disease, genotype 3 hepatitis C virus infection, autoimmune hepatitis, hepatolenticular degeneration, drugs (tamoxifen, amiodarone, sodium valproate, methotrexate, glucocorticoids, etc.), total parenteral nutrition, inflammatory bowel disease, celiac disease, hypothyroidism, Cushing’s syndrome, beta lipoprotein deficiency, lipid atrophy diabetes, Mauriac syndrome, etc.; (2) long-term drinkers (≥210 g ethanol/week for men, ≥140 g ethanol/week for women); (3) liver cirrhosis, liver malignant tumor, acute biliary tract infectious disease, and those who were taking or have taken hepatotoxic Chinese medicine and/or Western medicine in the past 3 months; (4) systolic blood pressure higher than 160 mm Hg and/or diastolic blood pressure higher than 100 mm Hg after standard antihypertensive treatment; (5) malignant tumors, congenital heart disease, acute myocardial infarction, post-PCI, severe arrhythmia, acute cerebral infarction and brain bleeding, chronic obstructive pulmonary disease, pulmonary heart disease, respiratory failure, renal insufficiency (blood BUN or Cr exceeding 1.5 times the upper limit of the reference value), and hematopoietic system diseases; (6) psychiatric disorders; (7) diabetes; (8) severe diarrhea (3 or more watery stools per day in the past 3 months); (9) severe constipation (2 or fewer bowel movements per week in the past 3 months, accompanied by difficulty in defecation); (10) pregnant and lactating women; (11) subjects who have taken antibiotics, steroidal anti-inflammatory drugs and probiotics in the past 3 months; (12) diets containing probiotics such as yogurt for the past 1 week. The control group consisted of 32 age-matched healthy volunteers from the Sixth People’s Hospital of Shenyang with normal serum lipids, blood glucose, liver enzymes and abdominal ultrasonography findings. This study was approved by the Ethics Committee of the Sixth People’s Hospital of Shenyang (No.2018-05-002-02), and informed consent was obtained from all subjects.
Biochemical measurements
Blood samples were drawn after an overnight fast from an antecubital vein. TG, TC, HDL-C, LDL-C, fasting blood glucose, ALT, AST, GGT, and uric acid were determined using biochemical kits. The experimental procedures followed the corresponding specifications.
Diet assessment
Dietary intake assessment over the past year referred to the semi-quantitative food frequency questionnaire [53–54]. Diet items included rice, flour, dessert, fried foods, coarse grains, tubers, processed meat, meat, seafood, nuts and legumes, vegetables, mushrooms, fruits, dairy foods, beverages, and eggs. Frequency of food intake ranged from “≤1/month” to “≥3/day”. Portion size ranged from “50 g or below” to “250 g or above”. For dairy foods, portion size ranged from “50 ml or below” to “400 ml or above”; for beverages, intake per serving ranged from “100 ml” to “550 ml or above”; for eggs, portion size ranged from “half and below” to “three or above”.
16S ribosomal RNA (rRNA) sequencing
Total genomic DNA samples were extracted from stool samples using the OMEGA Soil DNA Kit (D5625-01) (Omega Bio-Tek, USA) according to the manufacturer’s instructions. The quality and quantity of extracted DNA were measured using agarose gel electrophoresis and a NanoDrop ND-1000 spectrophotometer (Thermo Fisher Scientific, USA), respectively. PCR amplification was performed for the V3-V4 regions of bacterial 16S rRNA genes. PCR amplicons were purified and quantified. Sequencing libraries were prepared with Illumina's TruSeq Nano DNA LT Library Prep Kit. Pair-end 2 × 250 bp sequencing was performed using the Illumina MiSeq platform. QIIME2 and R packages (v3.2.0) were used for sequence data analyses. Raw sequence data were demultiplexed using the demux plugin. Sequences were then quality filtered, denoised, and merged, and chimeras were removed using the DADA2 plugin.
Metabolomics analysis
Stool (100 mg) was homogenized with ice-cold water (300 μl) and mixed and vortexed with cold steel balls (5 min). The homogenized stool was then added to pure methanol (500 μl), vortexed, incubated on ice (10 min), and centrifuged (12,000 rpm, 4°C, 10 min). Then, 600 μl of supernatant was added to another centrifuge tube and concentrated. The dried product was added to 5% methanol-water (100 μl), vortexed and centrifuged (12,000 rpm, 4°C, 10 min). Finally, the supernatant was used for LC-MS/MS analysis using a Waters ACQUITY UPLC HSS T3 C18 column (1.8 μm, 2.1 mm×100 mm). Spectral data were obtained in positive and negative ion modes. The original data file was converted into mzML format by Proteo Wizard software. Then, the XCMS program was used to perform peak extraction and alignment and retention time correction. Peak area was corrected by the “SVR” method and peaks with deletion rates >50% in each group of samples were filtered. Metabolic identification information was obtained by searching the public database metDNA (http://metdna.zhulab.cn) and our laboratory’s self-built database.
GF mice and FMT procedures
Fifteen six-week-old GF male mice were fed in a sterile isolator in the Experimental Animal Center at Shanghai Shrek Experimental Animal Co., Ltd. (temperature: 20–22°C; humidity: 50–60%; day/night cycle: 12 h/12 h). Drinking bottles and cages were sterilized under high temperature and pressure (121°C, 60 min) and water, feed, and bedding materials were irradiated (50 kGy) prior to use or administration. Donors with nonalcoholic hepatic steatosis (n = 4, two men and two women) and control subjects (n = 2, one man and one woman) were randomly selected. For each group, 100 mg of combined stool samples were resuspended with a vortex in 600 μl of reduced PBS (PBS with 0.5 g/l cysteine and 0.2 g/l Na2S). The mixture was centrifuged (2500 rpm, 1 min) to remove insoluble materials and the supernatant was transferred to a new sterile test tube. GF mice were fed with a balanced diet for 4 weeks and gavaged once daily with 100 μL of fecal suspension over the first 4 days of this feeding cycle. On the day of sampling, the mice were anesthetized using 1% pentobarbital (0.2 ml/mouse). Mice were then sacrificed by CO2 euthanasia method and liver histology and serum L-tryptophan and kynurenine quantification performed as described below.
Oil Red O staining
Liver samples were dehydrated in 15% and 30% sucrose and then embedded with optimal cutting temperature compound (OCT) to prepare frozen sections (8–10 μm). The frozen sections were stained with Oil Red O and a Nikon E100 microscope was used to acquire images.
L-tryptophan and kynurenine quantification by UPLC–MS/MS
Standard mix solution and 50 μL serum with 50 μL protein precipitation agent (including NVL) were mixed and centrifuged (13,200 rpm, 4 min). Eight microliters of supernatant and 42 μL of labeling buffer were then mixed and centrifuged. Then, 20 μL of derivatization solution was added, centrifuged, and the sample was derivatized (55°C, 15 min). After derivatization, the sample was cooled in a refrigerator, centrifuged at 13,500 rpm instantly, and 50 μL collected for UPLC–MS/MS analysis using a Waters MSLab 45+AA-C18 column (5 μm, 150 mm × 4.6 mm).
Statistical analysis
ASV-level alpha diversity indices (Shannon diversity index) were calculated. LEfSe was performed to detect differentially abundant taxa across groups using the default parameters (LDA Effect Size >2 and P < 0.05). Logistic regression was performed to investigate the association between steatosis and gut microbiota after adjusting for age, sex, and BMI. Phylogenetic reconstruction of unobserved states (PICRUSt2) was used to predict and analyze species functions according to amplicon sequencing data. For metabolomics analysis, univariate analysis (Student’s t-test) and multivariate analysis (orthogonal partial least squares discriminant analysis; OPLS-DA) were applied. Correlations between gut microbiota at genera level, clinical indices, and fecal metabolites were tested with Spearman’s correlation. The latter was also used to explore correlations between gut microbiota at genera level, fecal metabolites, and diet. Receiver-operating characteristic (ROC) curves were plotted and area under the ROC curve (AUC) was used as an accuracy index for evaluating the diagnostic performance of the tryptophan-kynurenine metabolites. Student’s t-test was used to detect differences in serum L-tryptophan and kynurenine values across groups. QIIME2, R packages (v3.2.0), and SPSS 21.0 were used for data analyses.
Data sharing statement
The datasets used in our study are available from the corresponding author on reasonable request.
Author Contributions
G.Y.S., L.Q.J., G.L.Y.: Obtained funding and designed the study. D.M.Q.: Collect clinical samples. G.Y.S., N.Z.: Performed fecal microbiota transplantation; G.Y.S., N.Z., L.Q.J.: Analysed and interpreted the data and drafted the manuscript. All authors reviewed and revised the final manuscript.
Acknowledgments
The authors would like to thank all persons in the Sixth People’s Hospital of Shenyang who helped to collect samples.
Conflicts of Interest
The authors declare no conflicts of interest related to this study.
Funding
The current study was supported by the National Natural Science Foundation of China (grant no.81803860; grant no. 81774022; grant no. 81974548; grant no. 82074145; Projects jointly built by central and local governments; Xingliao Talent Program of Liaoning Province; the Natural Science Foundation of Liaoning Province (grant no. 2019-MS-288).
References
- 1. Alferink LJM, Radjabzadeh D, Erler NS, Vojinovic D, Medina-Gomez C, Uitterlinden AG, de Knegt RJ, Amin N, Ikram MA, Janssen HLA, Kiefte-de Jong JC, Metselaar HJ, van Duijn CM, et al. Microbiomics, Metabolomics, Predicted Metagenomics, and Hepatic Steatosis in a Population-Based Study of 1,355 Adults. Hepatology. 2021; 73:968–82. https://doi.org/10.1002/hep.31417 [PubMed]
- 2. Chalasani N, Younossi Z, Lavine JE, Charlton M, Cusi K, Rinella M, Harrison SA, Brunt EM, Sanyal AJ. The diagnosis and management of nonalcoholic fatty liver disease: Practice guidance from the American Association for the Study of Liver Diseases. Hepatology. 2018; 67:328–57. https://doi.org/10.1002/hep.29367 [PubMed]
- 3. Toplak H, Stauber R, Sourij H. EASL-EASD-EASO Clinical Practice Guidelines for the management of non-alcoholic fatty liver disease: guidelines, clinical reality and health economic aspects. Diabetologia. 2016; 59:1148–49. https://doi.org/10.1007/s00125-016-3941-4 [PubMed]
- 4. Aron-Wisnewsky J, Vigliotti C, Witjes J, Le P, Holleboom AG, Verheij J, Nieuwdorp M, Clément K. Gut microbiota and human NAFLD: disentangling microbial signatures from metabolic disorders. Nat Rev Gastroenterol Hepatol. 2020; 17:279–97. https://doi.org/10.1038/s41575-020-0269-9 [PubMed]
- 5. Hoyles L, Fernández-Real JM, Federici M, Serino M, Abbott J, Charpentier J, Heymes C, Luque JL, Anthony E, Barton RH, Chilloux J, Myridakis A, Martinez-Gili L, et al. Molecular phenomics and metagenomics of hepatic steatosis in non-diabetic obese women. Nat Med. 2018; 24:1070–80. https://doi.org/10.1038/s41591-018-0061-3 [PubMed]
- 6. Raman M, Ahmed I, Gillevet PM, Probert CS, Ratcliffe NM, Smith S, Greenwood R, Sikaroodi M, Lam V, Crotty P, Bailey J, Myers RP, Rioux KP. Fecal microbiome and volatile organic compound metabolome in obese humans with nonalcoholic fatty liver disease. Clin Gastroenterol Hepatol. 2013; 11:868–75.e1-3. https://doi.org/10.1016/j.cgh.2013.02.015 [PubMed]
- 7. Wang B, Jiang X, Cao M, Ge J, Bao Q, Tang L, Chen Y, Li L. Altered Fecal Microbiota Correlates with Liver Biochemistry in Nonobese Patients with Non-alcoholic Fatty Liver Disease. Sci Rep. 2016; 6:32002. https://doi.org/10.1038/srep32002 [PubMed]
- 8. Shen F, Zheng RD, Sun XQ, Ding WJ, Wang XY, Fan JG. Gut microbiota dysbiosis in patients with non-alcoholic fatty liver disease. Hepatobiliary Pancreat Dis Int. 2017; 16:375–81. https://doi.org/10.1016/S1499-3872(17)60019-5 [PubMed]
- 9. Del Chierico F, Nobili V, Vernocchi P, Russo A, De Stefanis C, Gnani D, Furlanello C, Zandonà A, Paci P, Capuani G, Dallapiccola B, Miccheli A, Alisi A, Putignani L. Gut microbiota profiling of pediatric nonalcoholic fatty liver disease and obese patients unveiled by an integrated meta-omics-based approach. Hepatology. 2017; 65:451–64. https://doi.org/10.1002/hep.28572 [PubMed]
- 10. Mouzaki M, Comelli EM, Arendt BM, Bonengel J, Fung SK, Fischer SE, McGilvray ID, Allard JP. Intestinal microbiota in patients with nonalcoholic fatty liver disease. Hepatology. 2013; 58:120–27. https://doi.org/10.1002/hep.26319 [PubMed]
- 11. Wang K, Liao M, Zhou N, Bao L, Ma K, Zheng Z, Wang Y, Liu C, Wang W, Wang J, Liu SJ, Liu H. Parabacteroides distasonis Alleviates Obesity and Metabolic Dysfunctions via Production of Succinate and Secondary Bile Acids. Cell Rep. 2019; 26:222–35.e5. https://doi.org/10.1016/j.celrep.2018.12.028 [PubMed]
- 12. Schroeder BO, Bäckhed F. Signals from the gut microbiota to distant organs in physiology and disease. Nat Med. 2016; 22:1079–89. https://doi.org/10.1038/nm.4185 [PubMed]
- 13. De Vadder F, Kovatcheva-Datchary P, Goncalves D, Vinera J, Zitoun C, Duchampt A, Bäckhed F, Mithieux G. Microbiota-generated metabolites promote metabolic benefits via gut-brain neural circuits. Cell. 2014; 156:84–96. https://doi.org/10.1016/j.cell.2013.12.016 [PubMed]
- 14. Scales BS, Dickson RP, Huffnagle GB. A tale of two sites: how inflammation can reshape the microbiomes of the gut and lungs. J Leukoc Biol. 2016; 100:943–50. https://doi.org/10.1189/jlb.3MR0316-106R [PubMed]
- 15. Krishnan S, Ding Y, Saedi N, Choi M, Sridharan GV, Sherr DH, Yarmush ML, Alaniz RC, Jayaraman A, Lee K. Gut Microbiota-Derived Tryptophan Metabolites Modulate Inflammatory Response in Hepatocytes and Macrophages. Cell Rep. 2018; 23:1099–111. https://doi.org/10.1016/j.celrep.2018.03.109 [PubMed]
- 16. Sun S, Araki Y, Hanzawa F, Umeki M, Kojima T, Nishimura N, Ikeda S, Mochizuki S, Oda H. High sucrose diet-induced dysbiosis of gut microbiota promotes fatty liver and hyperlipidemia in rats. J Nutr Biochem. 2021; 93:108621. https://doi.org/10.1016/j.jnutbio.2021.108621 [PubMed]
- 17. Hendrikx T, Schnabl B. Indoles: metabolites produced by intestinal bacteria capable of controlling liver disease manifestation. J Intern Med. 2019; 286:32–40. https://doi.org/10.1111/joim.12892 [PubMed]
- 18. Lang S, Schnabl B. Microbiota and Fatty Liver Disease-the Known, the Unknown, and the Future. Cell Host Microbe. 2020; 28:233–44. https://doi.org/10.1016/j.chom.2020.07.007 [PubMed]
- 19. Sharifnia T, Antoun J, Verriere TG, Suarez G, Wattacheril J, Wilson KT, Peek RM
Jr , Abumrad NN, Flynn CR. Hepatic TLR4 signaling in obese NAFLD. Am J Physiol Gastrointest Liver Physiol. 2015; 309:G270–78. https://doi.org/10.1152/ajpgi.00304.2014 [PubMed] - 20. Cani PD, Amar J, Iglesias MA, Poggi M, Knauf C, Bastelica D, Neyrinck AM, Fava F, Tuohy KM, Chabo C, Waget A, Delmée E, Cousin B, et al. Metabolic endotoxemia initiates obesity and insulin resistance. Diabetes. 2007; 56:1761–72. https://doi.org/10.2337/db06-1491 [PubMed]
- 21. Byndloss MX, Olsan EE, Rivera-Chávez F, Tiffany CR, Cevallos SA, Lokken KL, Torres TP, Byndloss AJ, Faber F, Gao Y, Litvak Y, Lopez CA, Xu G, et al. Microbiota-activated PPAR-γ signaling inhibits dysbiotic Enterobacteriaceae expansion. Science. 2017; 357:570–75. https://doi.org/10.1126/science.aam9949 [PubMed]
- 22. Afolayan AO, Adebusoye LA, Cadmus EO, Ayeni FA. Insights into the gut microbiota of Nigerian elderly with type 2 diabetes and non-diabetic elderly persons. Heliyon. 2020; 6:e03971. https://doi.org/10.1016/j.heliyon.2020.e03971 [PubMed]
- 23. Takagi T, Naito Y, Kashiwagi S, Uchiyama K, Mizushima K, Kamada K, Ishikawa T, Inoue R, Okuda K, Tsujimoto Y, Ohnogi H, Itoh Y. Changes in the Gut Microbiota are Associated with Hypertension, Hyperlipidemia, and Type 2 Diabetes Mellitus in Japanese Subjects. Nutrients. 2020; 12:2996. https://doi.org/10.3390/nu12102996 [PubMed]
- 24. Kulkarni P, Devkumar P, Chattopadhyay I. Could dysbiosis of inflammatory and anti-inflammatory gut bacteria have an implications in the development of type 2 diabetes? A pilot investigation. BMC Res Notes. 2021; 14:52. https://doi.org/10.1186/s13104-021-05466-2 [PubMed]
- 25. Astbury S, Atallah E, Vijay A, Aithal GP, Grove JI, Valdes AM. Lower gut microbiome diversity and higher abundance of proinflammatory genus Collinsella are associated with biopsy-proven nonalcoholic steatohepatitis. Gut Microbes. 2020; 11:569–80. https://doi.org/10.1080/19490976.2019.1681861 [PubMed]
- 26. Jeong Y, Kim JW, You HJ, Park SJ, Lee J, Ju JH, Park MS, Jin H, Cho ML, Kwon B, Park SH, Ji GE. Gut Microbial Composition and Function Are Altered in Patients with Early Rheumatoid Arthritis. J Clin Med. 2019; 8:693. https://doi.org/10.3390/jcm8050693 [PubMed]
- 27. Chen J, Wright K, Davis JM, Jeraldo P, Marietta EV, Murray J, Nelson H, Matteson EL, Taneja V. An expansion of rare lineage intestinal microbes characterizes rheumatoid arthritis. Genome Med. 2016; 8:43. https://doi.org/10.1186/s13073-016-0299-7 [PubMed]
- 28. Doden H, Sallam LA, Devendran S, Ly L, Doden G, Daniel SL, Alves JMP, Ridlon JM. Metabolism of Oxo-Bile Acids and Characterization of Recombinant 12α-Hydroxysteroid Dehydrogenases from Bile Acid 7α-Dehydroxylating Human Gut Bacteria. Appl Environ Microbiol. 2018; 84:e00235–18. https://doi.org/10.1128/AEM.00235-18 [PubMed]
- 29. Stenman LK, Holma R, Eggert A, Korpela R. A novel mechanism for gut barrier dysfunction by dietary fat: epithelial disruption by hydrophobic bile acids. Am J Physiol Gastrointest Liver Physiol. 2013; 304:G227–34. https://doi.org/10.1152/ajpgi.00267.2012 [PubMed]
- 30. Kakiyama G, Pandak WM, Gillevet PM, Hylemon PB, Heuman DM, Daita K, Takei H, Muto A, Nittono H, Ridlon JM, White MB, Noble NA, Monteith P, et al. Modulation of the fecal bile acid profile by gut microbiota in cirrhosis. J Hepatol. 2013; 58:949–55. https://doi.org/10.1016/j.jhep.2013.01.003 [PubMed]
- 31. Khakisahneh S, Zhang XY, Nouri Z, Wang DH. Cecal microbial transplantation attenuates hyperthyroid-induced thermogenesis in Mongolian gerbils. Microb Biotechnol. 2021. [Epub ahead of print]. https://doi.org/10.1111/1751-7915.13793 [PubMed]
- 32. Guo C, Wang Y, Zhang S, Zhang X, Du Z, Li M, Ding K. Crataegus pinnatifida polysaccharide alleviates colitis via modulation of gut microbiota and SCFAs metabolism. Int J Biol Macromol. 2021; 181:357–68. https://doi.org/10.1016/j.ijbiomac.2021.03.137 [PubMed]
- 33. Qian X, Liu YX, Ye X, Zheng W, Lv S, Mo M, Lin J, Wang W, Wang W, Zhang X, Lu M. Gut microbiota in children with juvenile idiopathic arthritis: characteristics, biomarker identification, and usefulness in clinical prediction. BMC Genomics. 2020; 21:286. https://doi.org/10.1186/s12864-020-6703-0 [PubMed]
- 34. Liu W, Luo X, Tang J, Mo Q, Zhong H, Zhang H, Feng F. A bridge for short-chain fatty acids to affect inflammatory bowel disease, type 1 diabetes, and non-alcoholic fatty liver disease positively: by changing gut barrier. Eur J Nutr. 2021; 60:2317–30. https://doi.org/10.1007/s00394-020-02431-w [PubMed]
- 35. Rocha JC, MacDonald A. Dietary intervention in the management of phenylketonuria: current perspectives. Pediatric Health Med Ther. 2016; 7:155–63. https://doi.org/10.2147/PHMT.S49329 [PubMed]
- 36. Cheng ML, Wang CH, Shiao MS, Liu MH, Huang YY, Huang CY, Mao CT, Lin JF, Ho HY, Yang NI. Metabolic disturbances identified in plasma are associated with outcomes in patients with heart failure: diagnostic and prognostic value of metabolomics. J Am Coll Cardiol. 2015; 65:1509–20. https://doi.org/10.1016/j.jacc.2015.02.018 [PubMed]
- 37. Libert DM, Nowacki AS, Natowicz MR. Metabolomic analysis of obesity, metabolic syndrome, and type 2 diabetes: amino acid and acylcarnitine levels change along a spectrum of metabolic wellness. PeerJ. 2018; 6:e5410. https://doi.org/10.7717/peerj.5410 [PubMed]
- 38. Li R, Huang X, Liang X, Su M, Lai KP, Chen J. Integrated omics analysis reveals the alteration of gut microbe-metabolites in obese adults. Brief Bioinform. 2021; 22:bbaa165. https://doi.org/10.1093/bib/bbaa165 [PubMed]
- 39. Mook-Kanamori DO, Römisch-Margl W, Kastenmüller G, Prehn C, Petersen AK, Illig T, Gieger C, Wang-Sattler R, Meisinger C, Peters A, Adamski J, Suhre K. Increased amino acids levels and the risk of developing of hypertriglyceridemia in a 7-year follow-up. J Endocrinol Invest. 2014; 37:369–74. https://doi.org/10.1007/s40618-013-0044-7 [PubMed]
- 40. Zurkinden L, Sviridov D, Vogt B, Escher G. Downregulation of Cyp7a1 by Cholic Acid and Chenodeoxycholic Acid in Cyp27a1/ApoE Double Knockout Mice: Differential Cardiovascular Outcome. Front Endocrinol (Lausanne). 2020; 11:586980. https://doi.org/10.3389/fendo.2020.586980 [PubMed]
- 41. Yamada S, Kawaguchi H, Yamada T, Guo X, Matsuo K, Hamada T, Miura N, Tasaki T, Tanimoto A. Cholic Acid Enhances Visceral Adiposity, Atherosclerosis and Nonalcoholic Fatty Liver Disease in Microminipigs. J Atheroscler Thromb. 2017; 24:1150–66. https://doi.org/10.5551/jat.39909 [PubMed]
- 42. Fiorucci S, Cipriani S, Baldelli F, Mencarelli A. Bile acid-activated receptors in the treatment of dyslipidemia and related disorders. Prog Lipid Res. 2010; 49:171–85. https://doi.org/10.1016/j.plipres.2009.11.001 [PubMed]
- 43. Yamamoto S, Sato I, Fukuhama N, Akiyama N, Sakai M, Kumazaki S, Ran S, Hirohata S, Kitamori K, Yamori Y, Watanabe S. Bile acids aggravate nonalcoholic steatohepatitis and cardiovascular disease in SHRSP5/Dmcr rat model. Exp Mol Pathol. 2020; 114:104437. https://doi.org/10.1016/j.yexmp.2020.104437 [PubMed]
- 44. Tang Y, Zhang J, Li J, Lei X, Xu D, Wang Y, Li C, Li X, Mao Y. Turnover of bile acids in liver, serum and caecal content by high-fat diet feeding affects hepatic steatosis in rats. Biochim Biophys Acta Mol Cell Biol Lipids. 2019; 1864:1293–304. https://doi.org/10.1016/j.bbalip.2019.05.016 [PubMed]
- 45. Ding Y, Yanagi K, Cheng C, Alaniz RC, Lee K, Jayaraman A. Interactions between gut microbiota and non-alcoholic liver disease: The role of microbiota-derived metabolites. Pharmacol Res. 2019; 141:521–29. https://doi.org/10.1016/j.phrs.2019.01.029 [PubMed]
- 46. Alhabeeb H, AlFaiz A, Kutbi E, AlShahrani D, Alsuhail A, AlRajhi S, Alotaibi N, Alotaibi K, AlAmri S, Alghamdi S, AlJohani N. Gut Hormones in Health and Obesity: The Upcoming Role of Short Chain Fatty Acids. Nutrients. 2021; 13:481. https://doi.org/10.3390/nu13020481 [PubMed]
- 47. Tang R, Li L. Modulation of Short-Chain Fatty Acids as Potential Therapy Method for Type 2 Diabetes Mellitus. Can J Infect Dis Med Microbiol. 2021; 2021:6632266. https://doi.org/10.1155/2021/6632266 [PubMed]
- 48. Agus A, Planchais J, Sokol H. Gut Microbiota Regulation of Tryptophan Metabolism in Health and Disease. Cell Host Microbe. 2018; 23:716–24. https://doi.org/10.1016/j.chom.2018.05.003 [PubMed]
- 49. Laurans L, Venteclef N, Haddad Y, Chajadine M, Alzaid F, Metghalchi S, Sovran B, Denis RGP, Dairou J, Cardellini M, Moreno-Navarrete JM, Straub M, Jegou S, et al. Genetic deficiency of indoleamine 2,3-dioxygenase promotes gut microbiota-mediated metabolic health. Nat Med. 2018; 24:1113–20. https://doi.org/10.1038/s41591-018-0060-4 [PubMed]
- 50. Moyer BJ, Rojas IY, Kerley-Hamilton JS, Hazlett HF, Nemani KV, Trask HW, West RJ, Lupien LE, Collins AJ, Ringelberg CS, Gimi B, Kinlaw WB
3rd , Tomlinson CR. Inhibition of the aryl hydrocarbon receptor prevents Western diet-induced obesity. Model for AHR activation by kynurenine via oxidized-LDL, TLR2/4, TGFβ, and IDO1. Toxicol Appl Pharmacol. 2016; 300:13–24. https://doi.org/10.1016/j.taap.2016.03.011 [PubMed] - 51. Haro C, Rangel-Zúñiga OA, Alcalá-Díaz JF, Gómez-Delgado F, Pérez-Martínez P, Delgado-Lista J, Quintana-Navarro GM, Landa BB, Navas-Cortés JA, Tena-Sempere M, Clemente JC, López-Miranda J, Pérez-Jiménez F, Camargo A. Intestinal Microbiota Is Influenced by Gender and Body Mass Index. PLoS One. 2016; 11:e0154090. https://doi.org/10.1371/journal.pone.0154090 [PubMed]
- 52. Hernaez R, Lazo M, Bonekamp S, Kamel I, Brancati FL, Guallar E, Clark JM. Diagnostic accuracy and reliability of ultrasonography for the detection of fatty liver: a meta-analysis. Hepatology. 2011; 54:1082–90. https://doi.org/10.1002/hep.24452 [PubMed]
- 53. Gao J. Association of dietary patterns and physical activities with total body fat proportions and metabolic syndrome among middle-aged and elderly people: a cross-sectional study. 2012. Fudan University, PhD thesis. https://kns.cnki.net/kcms/detail/detail.aspx?dbcode=CDFD&dbname=CDFD1214&filename=1013103008.nh&v=8hZRtkieWJ1O7jnE156pGkOdMmDVe79c83MkbY7Pr8%25mmd2BkQPgyU%25mmd2BgAzfHMzcsbP%25mmd2BYX.
- 54. Song FY, Toshiro T, Li K, Yu P, Lin XK, Yang HL, Deng XL, Zhang YQ, Lv LW, Huang XE, Kazuo T. Development of a semi-quantitative food frequency questionnaire for middle-aged inhabitants in the Chaoshan area, China. World J Gastroenterol. 2005; 11:4078–84. https://doi.org/10.3748/wjg.v11.i26.4078 [PubMed]