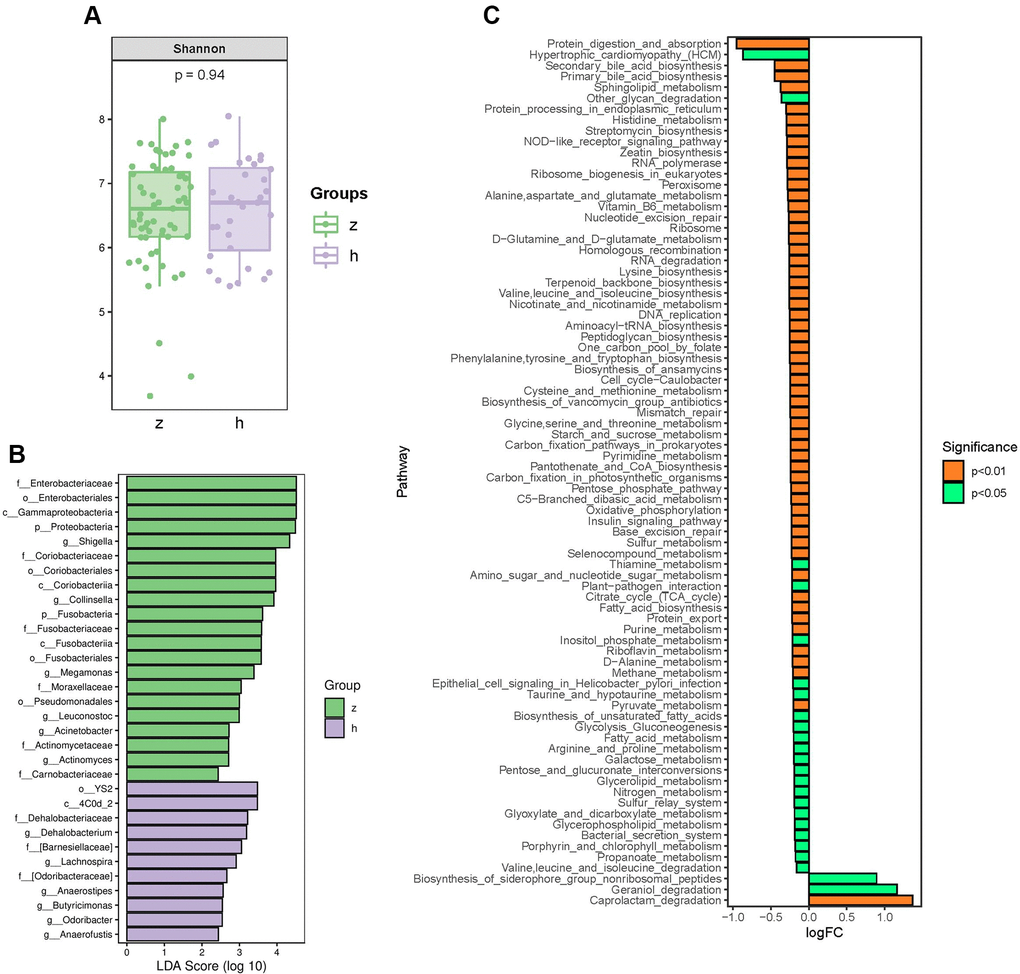
Figure 1.Analysis of bacterial community structure by 16S rRNA sequencing. (A) Alpha diversity analysis of gut microbiome in control and NHS stool samples. (B) LefSe analysis of gut microbiota composition in NHS. (C) KEGG pathway analysis of differentially abundant gut microbiota between control and NHS; h: control group; z: NHS group.