


Introduction
Telomeres consist of tandem DNA nucleotide repeats (TTAGGG)n and a protein complex that cap chromosome ends to ensure chromosomal stability [1]. Telomeres shorten as cells divide, eventually leading to replicative senescence and/or apoptosis, making telomere length (TL) a useful marker of cellular and thus biological age [2, 3]. TL has been associated with a variety of age-related diseases and health outcomes including cardiovascular disease, metabolic syndrome, and cancer (reviewed in [4]). TL is used clinically to diagnose patients with inherited telomere biology disorders such as dyskeratosis congenita and has shown promise in guiding donor selection for hematopoietic cell transplant (HCT) [5–8].
Several methods have been developed for measuring TL, each with its own strengths and limitations [9, 10]. The current gold standard is the Southern blot Telomere Restriction Fragment (TRF) method; it measures average absolute TL (in kilobases, kb), and requires large quantities of high-quality DNA [11]. Another accurate method is fluorescence in situ hybridization (flow FISH) in which fluorescently labeled peptide nucleic acid (PNA) probes detect telomeric repeats in total leukocytes and leukocyte subsets to determine average TL as calibrated using TRF and presented in kb. This method requires viable leukocytes and special expertise [10, 12]. A widely used method is quantitative polymerase chain reaction (qPCR) that measures TL based on the ratio between telomere copy number and that of a single-copy gene (T/S) in the same DNA sample [13, 14]. qPCR is frequently used to determine TL in epidemiologic studies because of its high-throughput and small DNA requirements; however, its reliability is limited by its high sensitivity to pre-analytic factors, such as DNA extraction or storage [15]. Other methods target the shortest telomeres such as single telomere length analysis (STELA) and the Telomere Shortest Length Assay (TeSLA) [16, 17]. Large scale genomic and epigenomic data offer opportunities for new approaches to TL calculation, such as TelSeq, an open-source software that is correlated with Southern blot (r~0.6) and estimates TL in kb using whole-genome sequence data [18].
Existing methods and high throughput adaptations have extended telomere research to population-level studies; however, there remains a need for TL measurement tools that overcome the limitations of current techniques: the sample quantities and analysis time required by the most accurate methods, and the limited reliability of high-throughput methods. DNA methylation regulates gene expression and has been associated with both chronological age and telomere shortening [19–21]. A new method utilizing whole genome DNA methylation array data to predict TL in kb was recently introduced [22] and may be useful to explore TL questions using available methylation array databases. This study aims to independently evaluate the performance of DNAmTL in comparison with TL measured by flow FISH and qPCR and evaluate the relationship between DNAmTL and participant characteristics known to be associated with TL.
Results
Participant characteristics
The study included 635 healthy adults (median age=34 years, range=19-61) who were HCT donors; blood samples were available at the Center for International Blood and Marrow Transplant Research (CIBMTR) biorepository and were part of the National Cancer Institute (NCI) Transplant Outcomes in Aplastic Anemia (TOAA) Study. Of the 635 individuals, 425 (67%) were male, 478 (75%) were white, and 239 (38%) were cytomegalovirus (CMV) seropositive (Table 1).
Table 1. Characteristics of study participants.
| Variable | Total (n=635) N (%) | ||||||||||||||||||||||||||||||||||||||||||||||||||||||||||||||||||||||||||||||||||||||||||||||||||
| Age | |||||||||||||||||||||||||||||||||||||||||||||||||||||||||||||||||||||||||||||||||||||||||||||||||||
| 19-24 | 118 (19%) | ||||||||||||||||||||||||||||||||||||||||||||||||||||||||||||||||||||||||||||||||||||||||||||||||||
| 25-29 | 124 (19%) | ||||||||||||||||||||||||||||||||||||||||||||||||||||||||||||||||||||||||||||||||||||||||||||||||||
| 30-34 | 96 (15%) | ||||||||||||||||||||||||||||||||||||||||||||||||||||||||||||||||||||||||||||||||||||||||||||||||||
| 35-39 | 107 (17%) | ||||||||||||||||||||||||||||||||||||||||||||||||||||||||||||||||||||||||||||||||||||||||||||||||||
| 40-44 | 91 (14%) | ||||||||||||||||||||||||||||||||||||||||||||||||||||||||||||||||||||||||||||||||||||||||||||||||||
| 45-61 | 99 (16%) | ||||||||||||||||||||||||||||||||||||||||||||||||||||||||||||||||||||||||||||||||||||||||||||||||||
| Sex | |||||||||||||||||||||||||||||||||||||||||||||||||||||||||||||||||||||||||||||||||||||||||||||||||||
| Male | 425 (67%) | ||||||||||||||||||||||||||||||||||||||||||||||||||||||||||||||||||||||||||||||||||||||||||||||||||
| Female | 210 (33%) | ||||||||||||||||||||||||||||||||||||||||||||||||||||||||||||||||||||||||||||||||||||||||||||||||||
| Race | |||||||||||||||||||||||||||||||||||||||||||||||||||||||||||||||||||||||||||||||||||||||||||||||||||
| White | 478 (75%) | ||||||||||||||||||||||||||||||||||||||||||||||||||||||||||||||||||||||||||||||||||||||||||||||||||
| African American | 40 (6%) | ||||||||||||||||||||||||||||||||||||||||||||||||||||||||||||||||||||||||||||||||||||||||||||||||||
| Other | 93 (15%) | ||||||||||||||||||||||||||||||||||||||||||||||||||||||||||||||||||||||||||||||||||||||||||||||||||
| Missing | 24 (4%) | ||||||||||||||||||||||||||||||||||||||||||||||||||||||||||||||||||||||||||||||||||||||||||||||||||
| CMV serostatus | |||||||||||||||||||||||||||||||||||||||||||||||||||||||||||||||||||||||||||||||||||||||||||||||||||
| Positive | 239 (38%) | ||||||||||||||||||||||||||||||||||||||||||||||||||||||||||||||||||||||||||||||||||||||||||||||||||
| Negative | 370 (58%) | ||||||||||||||||||||||||||||||||||||||||||||||||||||||||||||||||||||||||||||||||||||||||||||||||||
| Missing | 26 (4%) | ||||||||||||||||||||||||||||||||||||||||||||||||||||||||||||||||||||||||||||||||||||||||||||||||||
| Telomere length (TL) | Median (Range) | ||||||||||||||||||||||||||||||||||||||||||||||||||||||||||||||||||||||||||||||||||||||||||||||||||
| DNAmTL (kb) | 7.4 (6.6-8.4) | ||||||||||||||||||||||||||||||||||||||||||||||||||||||||||||||||||||||||||||||||||||||||||||||||||
| flow FISH TL (kb)1 | 7.0 (3.7-11.2) | ||||||||||||||||||||||||||||||||||||||||||||||||||||||||||||||||||||||||||||||||||||||||||||||||||
| qPCR (z-score) | -0.17 (-2.34-4.96) | ||||||||||||||||||||||||||||||||||||||||||||||||||||||||||||||||||||||||||||||||||||||||||||||||||
| 1flow FISH TL was available for 144 participants. Abbreviations: CMV indicates cytomegalovirus; DNAmTL (kb) indicates DNA methylation-based estimator of telomere length in kilobases; flow FISH TL (kb) indicates lymphocyte telomere length measured by fluorescent in situ hybridization with flow cytometry in kilobases; qPCR (z-score) indicates calculated z-score of telomere length measured by quantitative polymerase chain reaction. | |||||||||||||||||||||||||||||||||||||||||||||||||||||||||||||||||||||||||||||||||||||||||||||||||||
Association between DNAmTL and TL-related participant characteristics
A statistically significant strong negative association between DNAmTL and chronological age was noted; the correlation coefficient (r) = -0.65, p<0.0001(Figure 1A). Shorter DNAmTL was associated with male sex (p=0.0001) and CMV positive serostatus (p=0.0004). African Americans had longer DNAmTL compared with other race groups; the difference between TL in African Americans and Whites was statistically significant (p=0.003), but no difference was noted between Whites and other race groups (p=0.95) (Figure 1B). In a multivariable regression model including all previously tested variables, DNAmTL decreased by 21 bp per year (p<0.0001), and was 116 bp longer in women than men (p<0.0001), 213 bp longer in African Americans than whites (p<0.0001), and 83 bp shorter in CMV seropositive individuals than those who were seronegative (p<0.0001) (Table 2).
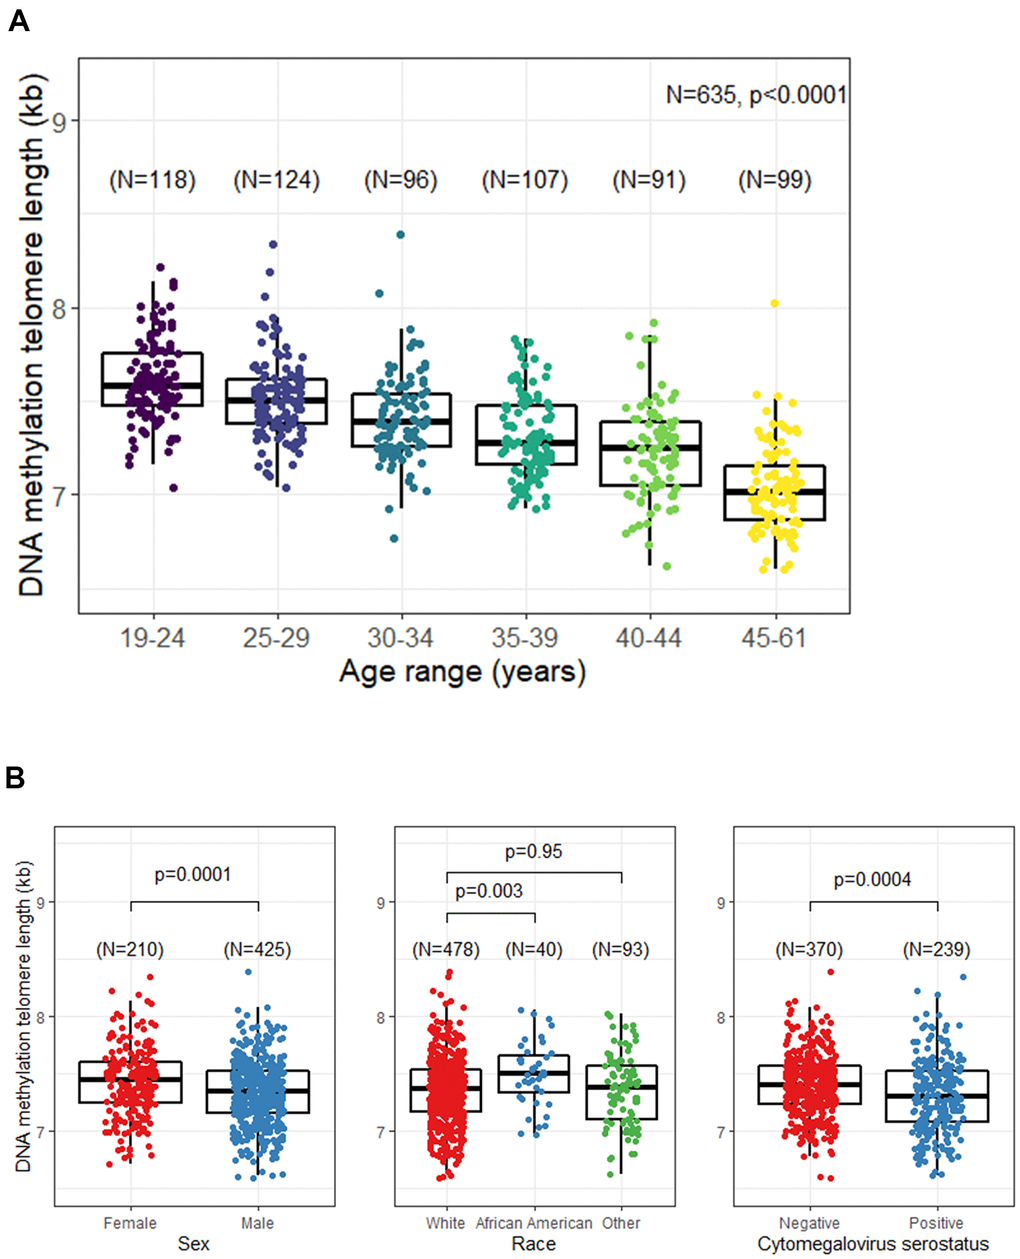
Figure 1. Unadjusted relationship between DNA methylation telomere length (DNAmTL) and selected participant characteristics. (A) DNAmTL by age categories. (B) DNAmTL by sex, race, or cytomegalovirus (CMV) serostatus.
Table 2. Adjusted associations between DNAmTL and selected participant characteristics.
| Variables1 | β | p-value | |||||||||||||||||||||||||||||||||||||||||||||||||||||||||||||||||||||||||||||||||||||||||||||||||
| Age | -0.021 | <0.0001 | |||||||||||||||||||||||||||||||||||||||||||||||||||||||||||||||||||||||||||||||||||||||||||||||||
| Sex | |||||||||||||||||||||||||||||||||||||||||||||||||||||||||||||||||||||||||||||||||||||||||||||||||||
| Male | REF | ||||||||||||||||||||||||||||||||||||||||||||||||||||||||||||||||||||||||||||||||||||||||||||||||||
| Female | 0.116 | <0.0001 | |||||||||||||||||||||||||||||||||||||||||||||||||||||||||||||||||||||||||||||||||||||||||||||||||
| Race | |||||||||||||||||||||||||||||||||||||||||||||||||||||||||||||||||||||||||||||||||||||||||||||||||||
| White | REF | ||||||||||||||||||||||||||||||||||||||||||||||||||||||||||||||||||||||||||||||||||||||||||||||||||
| African American | 0.213 | <0.0001 | |||||||||||||||||||||||||||||||||||||||||||||||||||||||||||||||||||||||||||||||||||||||||||||||||
| Other | 0.010 | 0.68 | |||||||||||||||||||||||||||||||||||||||||||||||||||||||||||||||||||||||||||||||||||||||||||||||||
| CMV serostatus | |||||||||||||||||||||||||||||||||||||||||||||||||||||||||||||||||||||||||||||||||||||||||||||||||||
| Negative | REF | ||||||||||||||||||||||||||||||||||||||||||||||||||||||||||||||||||||||||||||||||||||||||||||||||||
| Positive | -0.083 | <0.0001 | |||||||||||||||||||||||||||||||||||||||||||||||||||||||||||||||||||||||||||||||||||||||||||||||||
| 1All variables in the table were included in the same model. | |||||||||||||||||||||||||||||||||||||||||||||||||||||||||||||||||||||||||||||||||||||||||||||||||||
| Abbreviation: CMV indicates cytomegalovirus. | |||||||||||||||||||||||||||||||||||||||||||||||||||||||||||||||||||||||||||||||||||||||||||||||||||
DNAmTL reliability and comparisons with qPCR or flow FISH TL
In 48 samples with blinded duplicate of MethylationEpic array data, the mean coefficient of variation (CV) of calculated DNAmTL was 1% (range= 0.08-3.1%). These blinded duplicate samples also had high DNAmTL correlation (r=0.93, p<0.0001).
Comparison of the TL estimated by DNAmTL and measured by flow FISH in the 144 individuals with both measures showed a statistically significant difference (median 7.4 vs. 7 kb respectively, p<0.0001), and moderate correlation (r = 0.56, p <0.0001; Figure 2A). In the full cohort (N=635), predicted TL by DNAmTL and qPCR measured TL were also statistically significantly different (median z-score TL =0.05 vs. -0.17 standard deviations from the mean, respectively, p=0.03), and showed modest correlation (r=0.41, p<0.0001; Figure 2B). No statistically significant differences in the correlations between TL from DNAmTL and qPCR were noted by sex (p-interaction=0.31), race (p-interaction=0.10), or age (p-interaction=0.11).
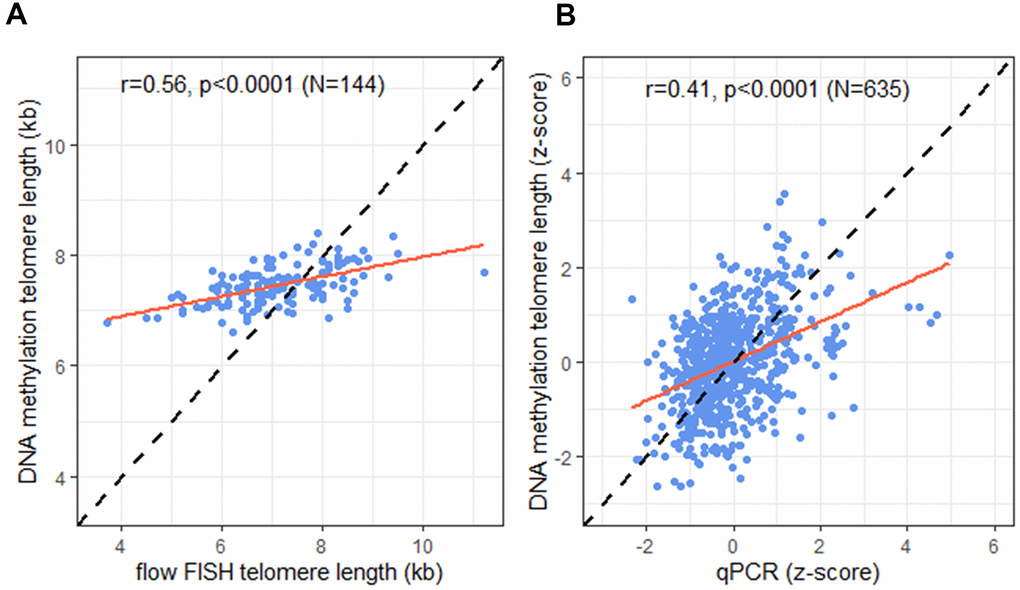
Figure 2. Correlation of telomere length (TL) measurement tools. (A) DNA methylation telomere length (DNAmTL) and flow FISH TL in kilobases (kb); (B) DNAmTL and qPCR in z-scores. Dashed line represents perfect agreement. Solid red line represents regression line.
Bland Altman analysis of DNAmTL compared with flow FISH TL demonstrated a mean bias of 0.35 kb (standard deviation [SD]=1.86), and a wide limit of agreement (LoA = -1.51 to 2.21 kb). DNAmTL resulted in a narrower range of TL compared with flow FISH with overestimation of the shortest TL and underestimation of the longest (Figure 3A). The mean bias was 0.023 (SD= 1.09) for DNAmTL and qPCR TL (Figure 3B).
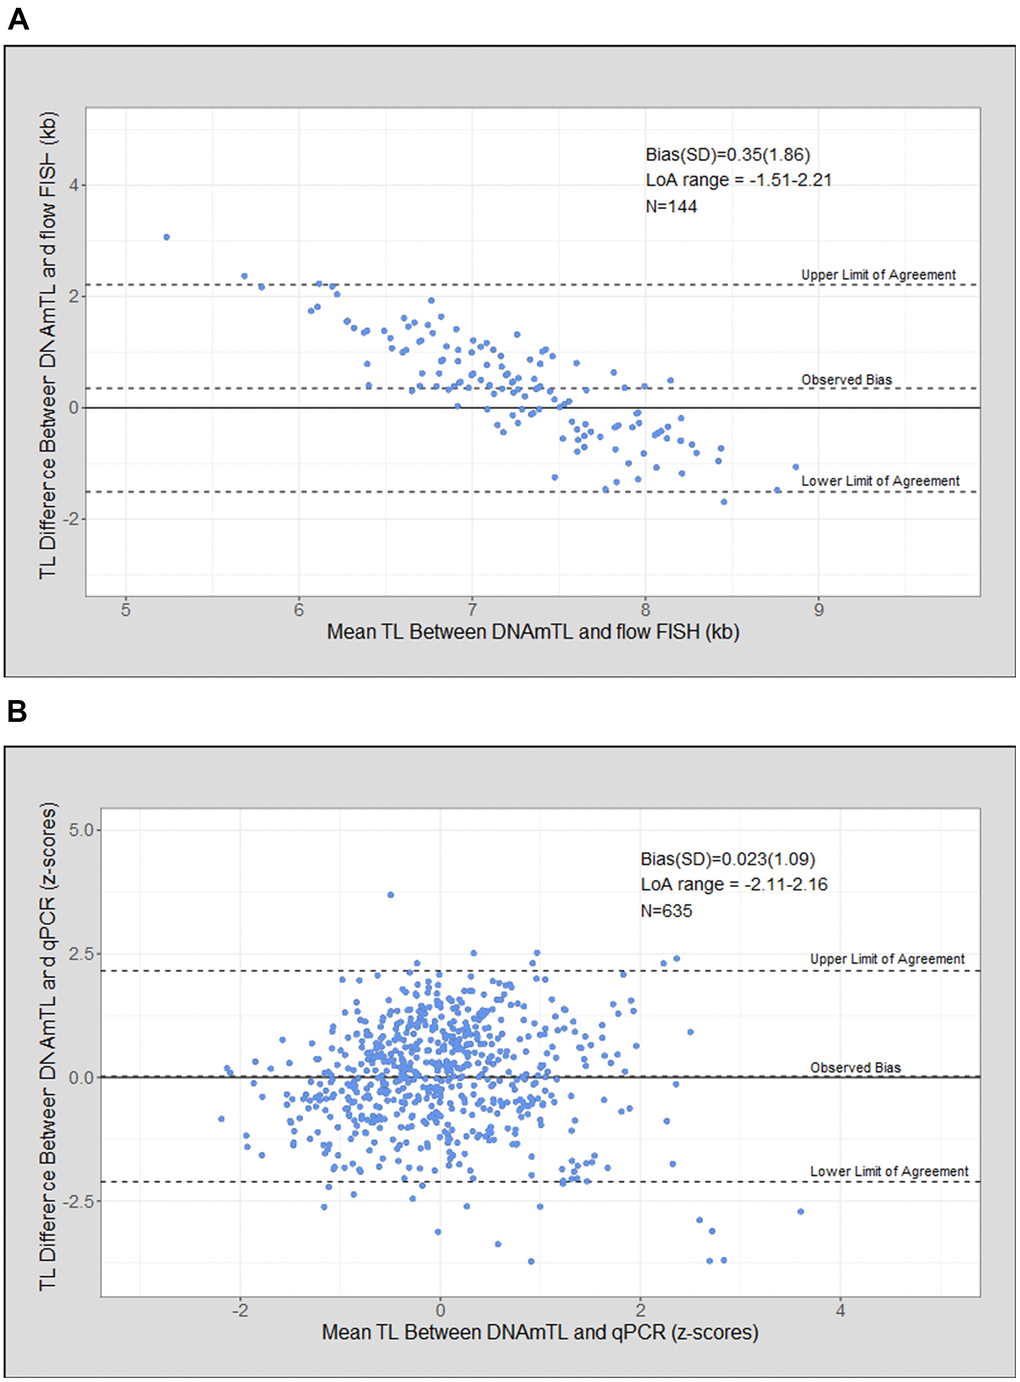
Figure 3. Telomere length (TL) measurement agreement between measurment tools. (A) DNA methylation telomere length (DNAmTL) and flow FISH in kilobases (kb); (B) DNAmTL and qPCR in z-scores.
We then used classifier matrices to assess the agreement between DNAmTL or qPCR TL with that of flow FISH when categorized as long versus short based on the TL median. DNAmTL correctly classified 72% of the individuals as having long (TL above median) or short (TL below the median) with 77% sensitivity and 66% specificity, relative to flow FISH. Similarly, agreement between qPCR and flow FISH showed 79% accuracy, 79% sensitivity, and 79% specificity (Figure 4A, 4B). When the analysis was repeated to evaluate the ability of DNAmTL or qPCR to correctly classify TL in tertiles or quartiles, accuracy of both methods decreased. For DNAmTL, the TL accuracy for the tertile classifier=57%, and for the quartile classifier =42%. Similar results were noted with qPCR TL (tertile accuracy=67%, quartile accuracy=52%). Of note, both DNAmTL and qPCR TL showed highest agreement with flow FISH at the longest and shortest TL categories for both tertiles and quartiles.
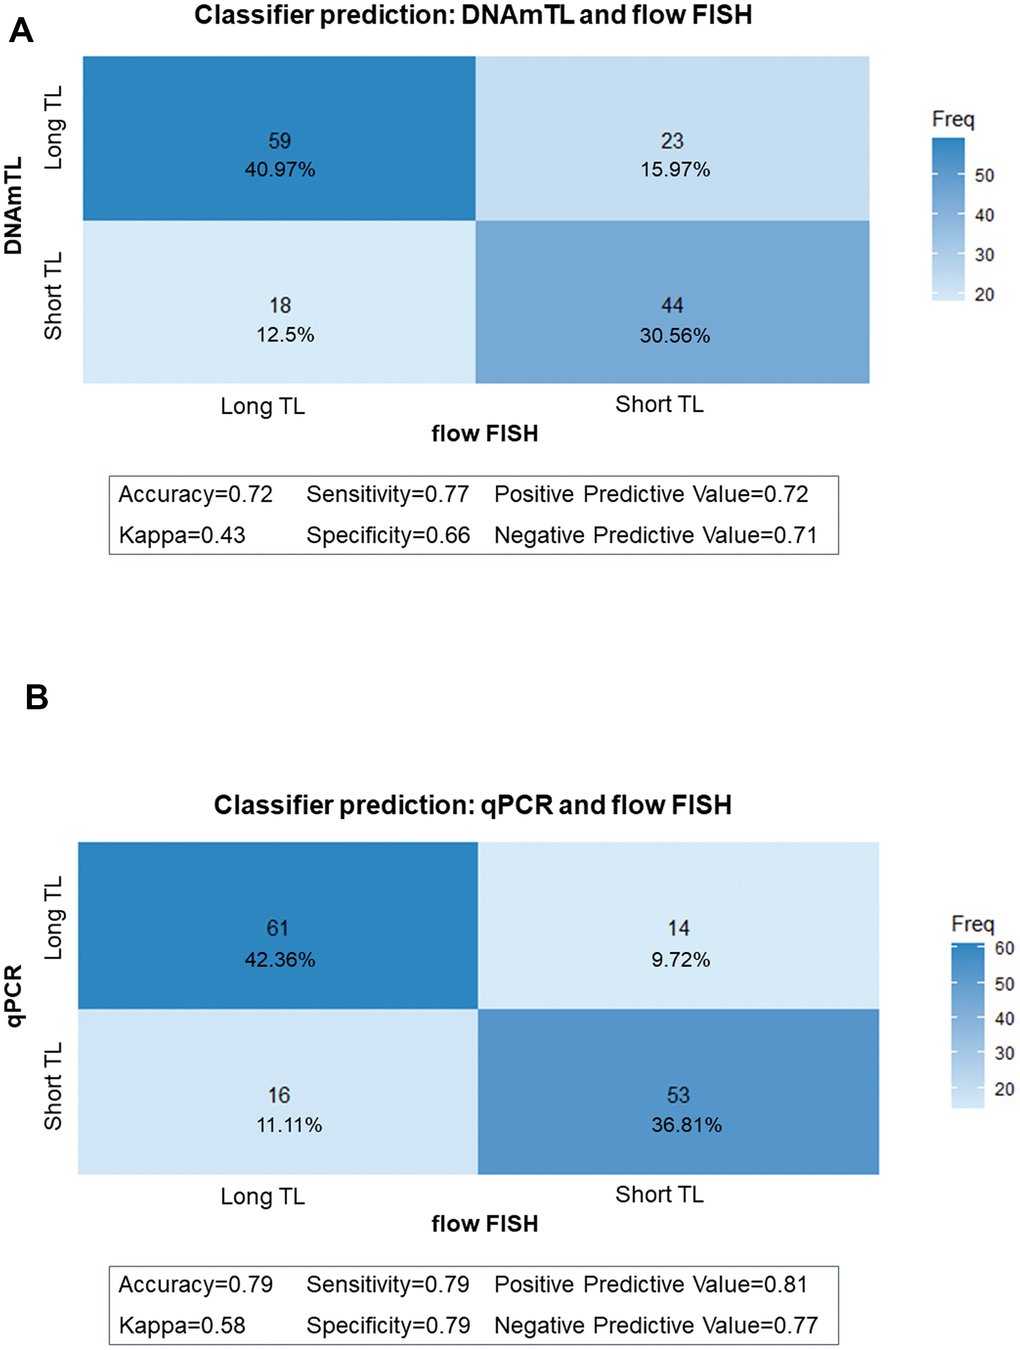
Figure 4. Classifier matrices comparing telomere length (TL) categories (above and below median). (A) between flow FISH and DNA methylation telomere length (DNAmTL); (B) between flow FISH and qPCR.
Discussion
In this study, we found that DNAmTL detected the expected variations in TL by age, sex, race, and CMV serostatus (a marker of chronic infection). However, its correlation with TL measured by flow FISH or qPCR was modest and the limits of measurement agreement were wide. On the binary scale, both DNAmTL and qPCR correctly classified approximately two-thirds of the individuals into long or short TL (cutoff at the median) when tested against flow FISH. The accuracy of both methods declined when TL was classified into more than two categories. These results suggest there may be opportunities for using methylation array data to explore TL variability in large epidemiological studies but call for caution in directly comparing DNAmTL results with standard TL measurement methods because of its limited accuracy.
The current study showed a modest correlation between DNAmTL and flow FISH (r=0.56), or qPCR (r=0.41). A previously published report showed a consistent correlation between DNAmTL and TRF (N of datasets=4, N of samples = 4788, range of r= 0.41- 0.5), but the correlation between DNAmTL and qPCR was variable (N of datasets=3, N of samples = 2136, range of r= -0.01- 0.38) [22]. This may reflect the known lab-to-lab variation for qPCR TL assay or be affected by assay reproducibility. Here, we showed a mean CV for DNAmTL of 1% indicating a high reproducibility of TL estimates based on 48 replicates. A previous study showed a CV of 1.7% for TRF and >5% for qPCR [23].
In line with previous studies using the Bland Altman analysis comparing agreements between TL measurement methods [24–26], DNAmTL showed acceptable agreement with TL measured by qPCR (mean bias ± SD = 0.023 ± 1.09) or flow FISH assay (mean bias ± SD = 0.35 ± 1.86) with almost all observations falling within two standard deviations for the limits of agreement. However, the observed wide limits of agreement (e.g., -1.51 to 2.21 kb in the flow FISH comparison) reflect a lack of accuracy that may limit the applicability of DNAmTL. When evaluating the ability of DNAmTL or qPCR to accurately categorize TL as compared with flow FISH, the study showed attenuated accuracy as the number of categories increased. This may highlight the importance of taking assay measurement error into account when calculating the minimum required sample size for new studies to be able to detect significant differences [27, 28].
Despite the modest correlation between DNAmTL and measured TL by evaluated assays, DNAmTL showed the expected negative TL-age correlation. Of note, the observed DNAmTL correlation with age was stronger (r= -0.64) than that reported with other TL measurement assays in this dataset (r = -0.30 for qPCR TL, and r= -0.33 for flow FISH TL) [25]. Additionally, in a meta-analysis of 124 cross-sectional and 5 longitudinal studies, the pooled TL-age correlation for TRF was r= -0.34 and for qPCR r= -0.29 [29]. On the other hand, comparisons of DNAmTL differences across age groups in the current cross-sectional study suggested that for every year increase in age, DNAmTL decreased by 21 bp. This is slightly lower than other methods in which a decrease of 30-60 bp per year was detected [30]. Notably, the majority of previous literature on TL dynamics also used a cross-sectional approach; longitudinal studies with serial samples are needed to address this question. DNAmTL also detected known TL relationships with sex, race [31, 32] and chronic infections [33, 34]. Of interest, DNAmTL in the current study detected greater TL differences by race and sex than those reported by TRF in a study including 1510 individuals (of whom 142 were African Americans and 888 were females) [35]. This may be influenced by sex- or race-specific methylation differences [36]. Yet, it is also possible that the relatively small sample size of certain subgroups in our study may have resulted in imprecise estimates. DNAmTL also demonstrated the expected associations with BMI and smoking behavior in another study [22]. These observations, despite modest correlations with other methods, support that DNAmTL may be capturing a broader aspect of the biological processes underlying cellular aging than just telomere shortening. Previously reported in vitro examination of cultured somatic cells showed that DNAmTL captured cellular proliferation independent of telomere attrition and telomerase activity [22]. Therefore, more robust associations between DNAmTL and TL-related factors that may themselves be more strongly linked to cellular aging than to telomere shortening are biologically plausible and point to the utility of future studies of DNAmTL in capturing such variations.
The strengths of the current study included the availability of TL measurements from multiple assays allowing for a comprehensive comparison with the new DNAmTL estimator in a relatively large sample size of healthy individuals. Flow FISH data provided an accurate TL measurement comparison with DNAmTL, and qPCR data allowed us to compare DNAmTL to a method widely used in epidemiological studies. Our study was limited by the age range (19-61 years), so our estimates may not be generalizable to all ages. Additionally, our DNAmTL associations with TL-known factors were not adjusted for other possible confounders such as socioeconomic status, smoking, or BMI, due to lack of information. However, the association between these factors and TL is not firmly established [37–40]. In addition, the study population consisted of pre-screened, healthy, HCT donors, therefore these factors are unlikely to have significant effects on our results. Although we measured TL using several assays (flow FISH and qPCR), we were limited by the absence of TL measurement by TRF, the gold standard in TL research. Of note, a strong correlation between TL measured by flow FISH and TRF has been reported (R2 = 0.73; p < 0.001) [41].
In conclusion, the results of this study suggest that DNAmTL holds promise as a method for approximating TL as long as its limitations are understood. In the current era of genomic data sharing there is an opportunity to use DNAmTL to explore different avenues of telomere and aging research using methylation data in the public domain. The sensitivity of DNAmTL in detecting known TL associations and its ability to approximate average TL suggest it may have utility in epidemiologic studies. However, because DNAmTL correlation and agreement with other methods is only modest, researchers should exercise caution when using DNAmTL in contexts where accuracy is of primary importance. Additional studies are needed to better understand what specific aspects of cellular aging or telomere maintenance are being captured by DNAmTL.
Materials and Methods
Study participants
The study participants were HCT donors in the TOAA project, a collaboration between NCI and CIBMTR [42]. Blood samples (frozen whole blood (N=416), or peripheral blood mononuclear cells (PBMC; N=219) collected before hematopoietic stem cell donation were available at the CIBMTR biorepository (https://www.cibmtr.org/Pages/index.aspx).
Telomere length measurement
For the flow FISH assay, total leukocytes were isolated from cryopreserved PBMCs. The fluorescence intensity in total lymphocytes and lymphocyte subsets, defined by labeled antibodies specific for CD20, CD45RA and CD57, relative to internal control cells and unstained controls were measured on a FACSCalibur instrument (Becton Dickinson) to calculate the median telomere length from duplicate measurements. For the present study, we analyzed TL measurements for total lymphocytes. More detailed description of flow FISH methods used in this study can be found elsewhere [42].
DNA for qPCR assays was extracted with the QIAamp Maxi Kit procedure (Qiagen, Inc., Valencia, CA). We used Telo_RP and Telo_FP primers (for the telomeric PCR) and 36B4_FP and 36B4_RP primers for the single-copy gene (36B4). Raw T/S ratio was standardized by dividing the raw ratio with the average T/S ratio of internal quality control (QC) calibrator samples. All samples were measured in triplicate and averages were used in the final calculations. More detailed description of the qPCR method used in this study can be found elsewhere [42]. qPCR analysis was completed in stages; to ensure comparability between TOAA sub-cohorts, we standardized TL based on the TL distribution within the sub-cohorts using z-scores
Prediction of telomere length using DNA methylation array data
For DNA methylation profiling, we used TOAA blood extracted DNA and the Illumina Infinium Methylation EPIC Bead™ array which covers more than 850,000 methylation sites across the genome. We excluded samples where >4% of probes failed detection (n=2). Functional normalization was used to account for potential batch effects using the “minfi” R package. Forty-eight blinded duplicate samples included to assess within and across plate differences had a high concordance rate (Pearson’s r ≥ 0.98). The Horvath DNAmTL was used for TL estimation as previously published [22]. In the original study, machine learning techniques were used to identify CpG sites (cytosine-phosphate-guanine dinucleotides) predictive of TRF-measured leukocyte TL; this resulted in the selection of 140 specific CpG sites using data from a diverse sample of 2,256 individuals. The use of linear regression models allowed for the transformation of DNA methylation levels to express TL predictions in kb.
Statistical analysis
We used Pearson’s correlation coefficient to evaluate the strength of linear association between DNAmTL and other TL measurement methods (flow FISH, and qPCR). A multivariable linear regression model was used to assess the association between DNAmTL and participant characteristics (age, sex, race, and CMV serostatus). All tests were two-sided with statistical significance defined as p < 0.05.
Bland Altman analysis was used to assess agreement between TL measurement methods by studying the mean difference between the two methods and constructing limits of agreement (defined as area within two standard deviations of the mean difference). The Y-axis shows the measurement difference, and the X-axis represents the average of the two measures. Bias is estimated as the mean difference between TL measurements in each comparison, with the zero line representing perfect agreement [43]. We used a classifier matrix (also known as confusion matrix) to assess the ability of qPCR and DNAmTL to accurately classify categories of TL in comparison with flow FISH using the R package (caret). Performance metrics included accuracy, sensitivity, specificity, and negative and positive predictive values. Data analysis and visualization was performed using SAS® statistical software, version 9.4 and RStudio, version 1.3.959.
Data availability
Data from this study are available and can be shared after fulfilling data sharing requirements; all relevant data and methods are reported in the article.
Author Contributions
Study Design: Emily E. Pearce, Rotana Alsaggaf and Shahinaz M. Gadalla; Sample Acquisition: Stephen Spellman; Laboratory and Bioinformatics: Geraldine Aubert, Casey L. Dagnall, Shilpa Katta, Steve Horvath, and Belynda Hicks. Statistical Analysis: Emily E. Pearce, Hormuzd Katki, and Rotana Alsaggaf. Data interpretation and manuscript drafting: Emily E. Pearce, Rotana Alsaggaf, Sharon A. Savage, and Shahinaz M. Gadalla. Manuscript critical review: All authors.
Conflicts of Interest
G.A. is a part-time employee of Repeat Diagnostics Inc., a company specializing in clinical telomere length measurements. There are no other declarations conflict of interest. The funders had no role in the design of the study; in the collection, analyses, or interpretation of data; in the writing of the manuscript, or in the decision to publish the results. The content of this publication does not necessarily reflect the views or policies of the Department of Health and Human Services, nor does mention of trade names, commercial products, or organizations imply endorsement by the U.S. Government.
Funding
This study was supported by the Intramural Research Program of the Division of Cancer Epidemiology and Genetics, National Cancer Institute; by a US Public Health Service Grant (U24-CA76518) from the National Cancer Institute, the National Heart Lung and Blood Institute and the National Institute of Allergy and Infectious Diseases, Health Resources and Services Administration (HHSH234200637015C); and by Grants N00014-18-1-2888 and N00014-20-1-2705 from the Office of Naval Research. The authors acknowledge the research contributions of the Cancer Genomics Research Laboratory funded with Federal funds from the National Cancer Institute, National Institutes of Health, under NCI Contract No. 75N910D00024.
References
- 1. Blackburn EH. Structure and function of telomeres. Nature. 1991; 350:569–73. https://doi.org/10.1038/350569a0 [PubMed]
- 2. Counter CM. The roles of telomeres and telomerase in cell life span. Mutat Res. 1996; 366:45–63. https://doi.org/10.1016/s0165-1110(96)90006-8 [PubMed]
- 3. Feldser DM, Hackett JA, Greider CW. Telomere dysfunction and the initiation of genome instability. Nat Rev Cancer. 2003; 3:623–27. https://doi.org/10.1038/nrc1142 [PubMed]
- 4. Aubert G, Lansdorp PM. Telomeres and aging. Physiol Rev. 2008; 88:557–79. https://doi.org/10.1152/physrev.00026.2007 [PubMed]
- 5. Alter BP, Baerlocher GM, Savage SA, Chanock SJ, Weksler BB, Willner JP, Peters JA, Giri N, Lansdorp PM. Very short telomere length by flow fluorescence in situ hybridization identifies patients with dyskeratosis congenita. Blood. 2007; 110:1439–47. https://doi.org/10.1182/blood-2007-02-075598 [PubMed]
- 6. Gadalla SM, Wang T, Haagenson M, Spellman SR, Lee SJ, Williams KM, Wong JY, De Vivo I, Savage SA. Association between donor leukocyte telomere length and survival after unrelated allogeneic hematopoietic cell transplantation for severe aplastic anemia. JAMA. 2015; 313:594–602. https://doi.org/10.1001/jama.2015.7 [PubMed]
- 7. Gadalla SM, Aubert G, Wang T, Haagenson M, Spellman SR, Wang L, Katki HA, Savage SA, Lee SJ. Donor telomere length and causes of death after unrelated hematopoietic cell transplantation in patients with marrow failure. Blood. 2018; 131:2393–98. https://doi.org/10.1182/blood-2017-10-812735 [PubMed]
- 8. Alder JK, Hanumanthu VS, Strong MA, DeZern AE, Stanley SE, Takemoto CM, Danilova L, Applegate CD, Bolton SG, Mohr DW, Brodsky RA, Casella JF, Greider CW, et al. Diagnostic utility of telomere length testing in a hospital-based setting. Proc Natl Acad Sci USA. 2018; 115:E2358–65. https://doi.org/10.1073/pnas.1720427115 [PubMed]
- 9. Baird DM. New developments in telomere length analysis. Exp Gerontol. 2005; 40:363–68. https://doi.org/10.1016/j.exger.2005.02.008 [PubMed]
- 10. Aubert G, Hills M, Lansdorp PM. Telomere length measurement-caveats and a critical assessment of the available technologies and tools. Mutat Res. 2012; 730:59–67. https://doi.org/10.1016/j.mrfmmm.2011.04.003 [PubMed]
- 11. Kimura M, Stone RC, Hunt SC, Skurnick J, Lu X, Cao X, Harley CB, Aviv A. Measurement of telomere length by the Southern blot analysis of terminal restriction fragment lengths. Nat Protoc. 2010; 5:1596–607. https://doi.org/10.1038/nprot.2010.124 [PubMed]
- 12. Baerlocher GM, Vulto I, de Jong G, Lansdorp PM. Flow cytometry and FISH to measure the average length of telomeres (flow FISH). Nat Protoc. 2006; 1:2365–76. https://doi.org/10.1038/nprot.2006.263 [PubMed]
- 13. Cawthon RM. Telomere measurement by quantitative PCR. Nucleic Acids Res. 2002; 30:e47. https://doi.org/10.1093/nar/30.10.e47 [PubMed]
- 14. Cawthon RM. Telomere length measurement by a novel monochrome multiplex quantitative PCR method. Nucleic Acids Res. 2009; 37:e21. https://doi.org/10.1093/nar/gkn1027 [PubMed]
- 15. Dagnall CL, Hicks B, Teshome K, Hutchinson AA, Gadalla SM, Khincha PP, Yeager M, Savage SA. Effect of pre-analytic variables on the reproducibility of qPCR relative telomere length measurement. PLoS One. 2017; 12:e0184098. https://doi.org/10.1371/journal.pone.0184098 [PubMed]
- 16. Baird DM, Rowson J, Wynford-Thomas D, Kipling D. Extensive allelic variation and ultrashort telomeres in senescent human cells. Nat Genet. 2003; 33:203–07. https://doi.org/10.1038/ng1084 [PubMed]
- 17. Lai TP, Zhang N, Noh J, Mender I, Tedone E, Huang E, Wright WE, Danuser G, Shay JW. A method for measuring the distribution of the shortest telomeres in cells and tissues. Nat Commun. 2017; 8:1356. https://doi.org/10.1038/s41467-017-01291-z [PubMed]
- 18. Ding Z, Mangino M, Aviv A, Spector T, Durbin R, and UK10K Consortium. Estimating telomere length from whole genome sequence data. Nucleic Acids Res. 2014; 42:e75. https://doi.org/10.1093/nar/gku181 [PubMed]
- 19. Buxton JL, Suderman M, Pappas JJ, Borghol N, McArdle W, Blakemore AI, Hertzman C, Power C, Szyf M, Pembrey M. Human leukocyte telomere length is associated with DNA methylation levels in multiple subtelomeric and imprinted loci. Sci Rep. 2014; 4:4954. https://doi.org/10.1038/srep04954 [PubMed]
- 20. Gadalla SM, Katki HA, Shebl FM, Giri N, Alter BP, Savage SA. The relationship between DNA methylation and telomere length in dyskeratosis congenita. Aging Cell. 2012; 11:24–28. https://doi.org/10.1111/j.1474-9726.2011.00755.x [PubMed]
- 21. Fraga MF, Agrelo R, Esteller M. Cross-talk between aging and cancer: the epigenetic language. Ann N Y Acad Sci. 2007; 1100:60–74. https://doi.org/10.1196/annals.1395.005 [PubMed]
- 22. Lu AT, Seeboth A, Tsai PC, Sun D, Quach A, Reiner AP, Kooperberg C, Ferrucci L, Hou L, Baccarelli AA, Li Y, Harris SE, Corley J, et al. DNA methylation-based estimator of telomere length. Aging (Albany NY). 2019; 11:5895–923. https://doi.org/10.18632/aging.102173 [PubMed]
- 23. Aviv A, Hunt SC, Lin J, Cao X, Kimura M, Blackburn E. Impartial comparative analysis of measurement of leukocyte telomere length/DNA content by Southern blots and qPCR. Nucleic Acids Res. 2011; 39:e134. https://doi.org/10.1093/nar/gkr634 [PubMed]
- 24. Behrens YL, Thomay K, Hagedorn M, Ebersold J, Henrich L, Nustede R, Schlegelberger B, Göhring G. Comparison of different methods for telomere length measurement in whole blood and blood cell subsets: Recommendations for telomere length measurement in hematological diseases. Genes Chromosomes Cancer. 2017; 56:700–08. https://doi.org/10.1002/gcc.22475 [PubMed]
- 25. Wang Y, Savage SA, Alsaggaf R, Aubert G, Dagnall CL, Spellman SR, Lee SJ, Hicks B, Jones K, Katki HA, Gadalla SM. Telomere Length Calibration from qPCR Measurement: Limitations of Current Method. Cells. 2018; 7:183. https://doi.org/10.3390/cells7110183 [PubMed]
- 26. Gutierrez-Rodrigues F, Santana-Lemos BA, Scheucher PS, Alves-Paiva RM, Calado RT. Direct comparison of flow-FISH and qPCR as diagnostic tests for telomere length measurement in humans. PLoS One. 2014; 9:e113747. https://doi.org/10.1371/journal.pone.0113747 [PubMed]
- 27. Devine OJ, Smith JM. Estimating sample size for epidemiologic studies: the impact of ignoring exposure measurement uncertainty. Stat Med. 1998; 17:1375–89. https://doi.org/10.1002/(sici)1097-0258(19980630)17:12<1375::aid-sim857>3.0.co;2-d [PubMed]
- 28. Lindrose AR, McLester-Davis LW, Tristano RI, Kataria L, Gadalla SM, Eisenberg DT, Verhulst S, Drury S. Method comparison studies of telomere length measurement using qPCR approaches: A critical appraisal of the literature. PLoS One. 2021; 16:e0245582. https://doi.org/10.1371/journal.pone.0245582 [PubMed]
- 29. Müezzinler A, Zaineddin AK, Brenner H. A systematic review of leukocyte telomere length and age in adults. Ageing Res Rev. 2013; 12:509–19. https://doi.org/10.1016/j.arr.2013.01.003 [PubMed]
- 30. Steenstrup T, Kark JD, Verhulst S, Thinggaard M, Hjelmborg JV, Dalgård C, Kyvik KO, Christiansen L, Mangino M, Spector TD, Petersen I, Kimura M, Benetos A, et al. Telomeres and the natural lifespan limit in humans. Aging (Albany NY). 2017; 9:1130–42. https://doi.org/10.18632/aging.101216 [PubMed]
- 31. Dalgård C, Benetos A, Verhulst S, Labat C, Kark JD, Christensen K, Kimura M, Kyvik KO, Aviv A. Leukocyte telomere length dynamics in women and men: menopause vs age effects. Int J Epidemiol. 2015; 44:1688–95. https://doi.org/10.1093/ije/dyv165 [PubMed]
- 32. Brown L, Needham B, Ailshire J. Telomere Length Among Older U.S. Adults: Differences by Race/Ethnicity, Gender, and Age. J Aging Health. 2017; 29:1350–66. https://doi.org/10.1177/0898264316661390 [PubMed]
- 33. Dowd JB, Bosch JA, Steptoe A, Jayabalasingham B, Lin J, Yolken R, Aiello AE. Persistent Herpesvirus Infections and Telomere Attrition Over 3 Years in the Whitehall II Cohort. J Infect Dis. 2017; 216:565–72. https://doi.org/10.1093/infdis/jix255 [PubMed]
- 34. Asghar M, Hasselquist D, Hansson B, Zehtindjiev P, Westerdahl H, Bensch S. Chronic infection. Hidden costs of infection: chronic malaria accelerates telomere degradation and senescence in wild birds. Science. 2015; 347:436–38. https://doi.org/10.1126/science.1261121 [PubMed]
- 35. Lynch SM, Peek MK, Mitra N, Ravichandran K, Branas C, Spangler E, Zhou W, Paskett ED, Gehlert S, DeGraffinreid C, Rebbeck TR, Riethman H. Race, Ethnicity, Psychosocial Factors, and Telomere Length in a Multicenter Setting. PLoS One. 2016; 11:e0146723. https://doi.org/10.1371/journal.pone.0146723 [PubMed]
- 36. Zhang FF, Cardarelli R, Carroll J, Fulda KG, Kaur M, Gonzalez K, Vishwanatha JK, Santella RM, Morabia A. Significant differences in global genomic DNA methylation by gender and race/ethnicity in peripheral blood. Epigenetics. 2011; 6:623–29. https://doi.org/10.4161/epi.6.5.15335 [PubMed]
- 37. Robertson T, Batty GD, Der G, Fenton C, Shiels PG, Benzeval M. Is socioeconomic status associated with biological aging as measured by telomere length? Epidemiol Rev. 2013; 35:98–111. https://doi.org/10.1093/epirev/mxs001 [PubMed]
- 38. Needham BL, Adler N, Gregorich S, Rehkopf D, Lin J, Blackburn EH, Epel ES. Socioeconomic status, health behavior, and leukocyte telomere length in the National Health and Nutrition Examination Survey, 1999-2002. Soc Sci Med. 2013; 85:1–8. https://doi.org/10.1016/j.socscimed.2013.02.023 [PubMed]
- 39. Mundstock E, Sarria EE, Zatti H, Mattos Louzada F, Kich Grun L, Herbert Jones M, Guma FT, Mazzola In Memoriam J, Epifanio M, Stein RT, Barbé-Tuana FM, Mattiello R. Effect of obesity on telomere length: Systematic review and meta-analysis. Obesity (Silver Spring). 2015; 23:2165–74. https://doi.org/10.1002/oby.21183 [PubMed]
- 40. Astuti Y, Wardhana A, Watkins J, Wulaningsih W, and PILAR Research Network. Cigarette smoking and telomere length: A systematic review of 84 studies and meta-analysis. Environ Res. 2017; 158:480–89. https://doi.org/10.1016/j.envres.2017.06.038 [PubMed]
- 41. Khincha PP, Dagnall CL, Hicks B, Jones K, Aviv A, Kimura M, Katki H, Aubert G, Giri N, Alter BP, Savage SA, Gadalla SM. Correlation of Leukocyte Telomere Length Measurement Methods in Patients with Dyskeratosis Congenita and in Their Unaffected Relatives. Int J Mol Sci. 2017; 18:1765. https://doi.org/10.3390/ijms18081765 [PubMed]
- 42. Gadalla SM, Wang T, Dagnall C, Haagenson M, Spellman SR, Hicks B, Jones K, Katki HA, Lee SJ, Savage SA. Effect of Recipient Age and Stem Cell Source on the Association between Donor Telomere Length and Survival after Allogeneic Unrelated Hematopoietic Cell Transplantation for Severe Aplastic Anemia. Biol Blood Marrow Transplant. 2016; 22:2276–82. https://doi.org/10.1016/j.bbmt.2016.09.012 [PubMed]
- 43. Bland JM, Altman DG. Statistical methods for assessing agreement between two methods of clinical measurement. Lancet. 1986; 1:307–10. [PubMed]