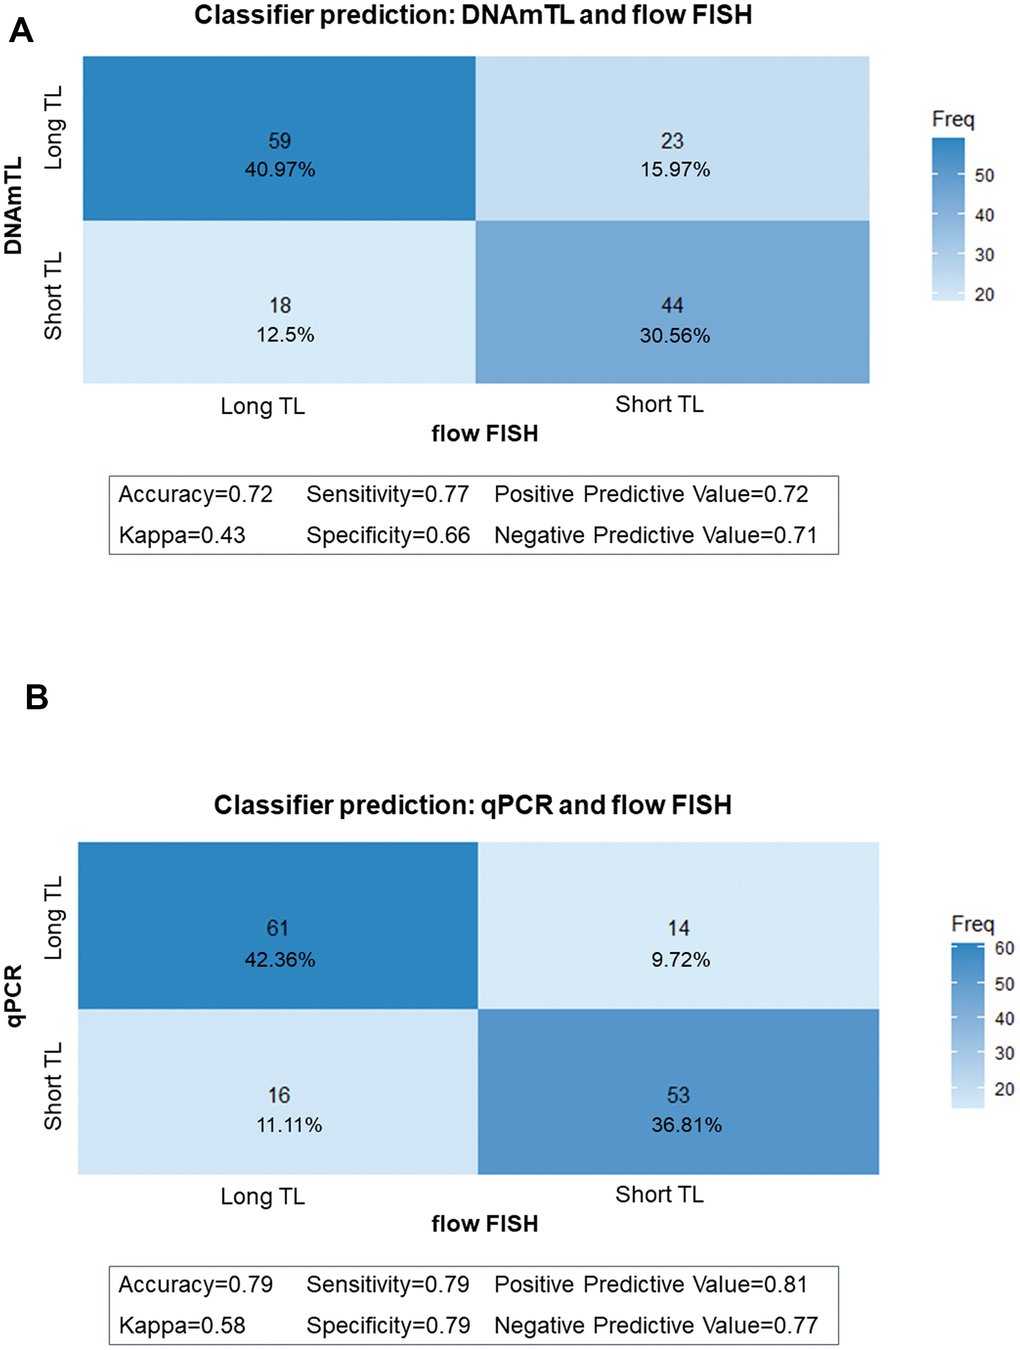
Figure 4.Classifier matrices comparing telomere length (TL) categories (above and below median). (A) between flow FISH and DNA methylation telomere length (DNAmTL); (B) between flow FISH and qPCR.
Figure 4 — DNA-methylation-based telomere length estimator: comparisons with measurements from flow FISH and qPCR | Aging