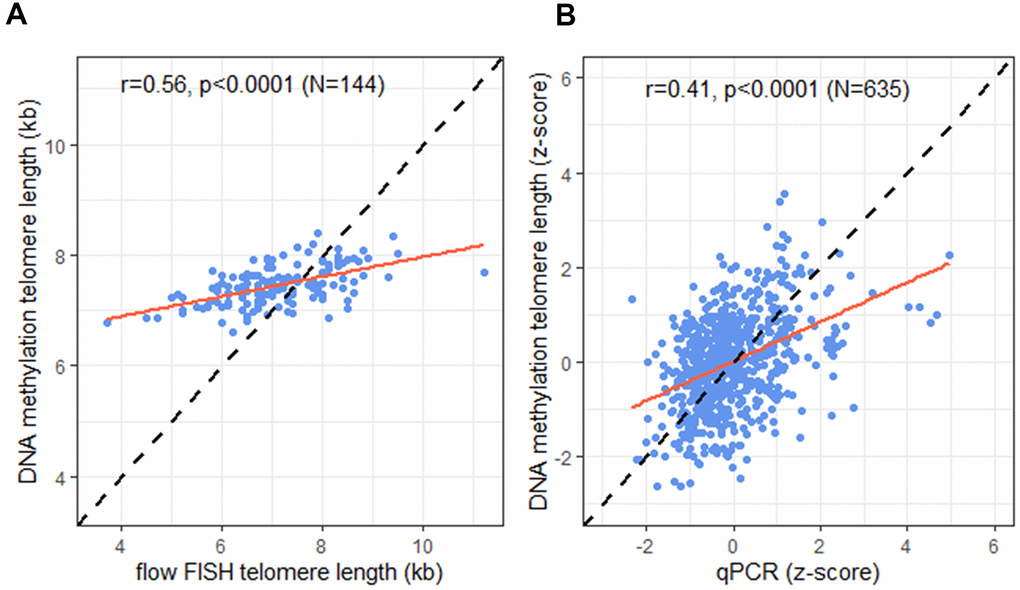
Figure 2.Correlation of telomere length (TL) measurement tools. (A) DNA methylation telomere length (DNAmTL) and flow FISH TL in kilobases (kb); (B) DNAmTL and qPCR in z-scores. Dashed line represents perfect agreement. Solid red line represents regression line.