


Introduction
Bladder cancer is the most common malignant tumor of the urinary system. It is the ninth most incident neoplasm in China and the 10th most common malignant tumor worldwide [1, 2]. Bladder cancer incidence increases with age, with the age of peak incidence at 50–70 years. Its incidence in men is 3–4 times greater than that of women [3]. With the aging of the population, changes in living habits, and improvements in diagnostic technology, bladder cancer incidence has increased yearly. Although the diagnosis and treatment of bladder cancer have greatly improved, advanced bladder cancer outcomes remain poor; the 5-year survival rate is low. Although studies have reported some prognostic biomarkers for bladder cancer [4], their utility is reduced by various factors, and the predictive power of individual indicators is insufficient. By contrast, genetic testing provides better predictive performance, and multigene prognostic models guide clinicians in choosing appropriate treatments [5].
The rise of immunotherapy, especially immune checkpoint inhibitors, has changed the treatment mode for advanced bladder cancer [6]; however, its remission rate remains substantial; therefore, it would be helpful to generate an immune-related gene model to stratify the risk of bladder cancer both to predict outcomes and to track treatment. And the study of the immune gene-related model has been reported in a variety of tumors, including colorectal cancer, head and neck cancer, and papillary thyroid cancer [5, 7, 8].
In the present study, based on TCGA, we aimed to identify reliable immune gene-related biomarkers to predict bladder cancer outcomes. We used R software to identify differentially expressed immune genes combined with clinical data from TCGA. We selected immune genes significantly related to outcomes to construct a model that predicts bladder cancer outcomes. Our findings may lay the foundation for in-depth immune-related work and may enable personalized treatment of bladder cancer.
Materials and Methods
Clinical samples and data collection
Transcriptome RNA-sequencing data and corresponding clinical data of all bladder cancer samples (including 410 bladder cancer samples and 19 non-tumor samples) were downloaded from TCGA (https://cancergenome.nih.gov/), excluding patients with overall survival of <90 days and unclear clinical stage [9]. Each tumor sample corresponded to one patient. The data collection date was June 1, 2020. The list of immune-related genes (IRGs) was downloaded from the immunology database and the analysis portal (ImmPort) database (https://www.immport.org/home) [10]. ImmPort provides accurate and timely immunological data, including IRGs for cancer research. The data shared through ImmPort provides a strong foundation for immunology research. The IRGs we downloaded from this website were involved in immune activity [11].
Analysis of differentially expressed genes
Transcriptome RNA-sequencing data was collated and standardized. Differential gene analysis returned a list of significantly differentially expressed genes (DEGs) using the limma package in R software [12], with the log2 | fold change | >1 and the false discovery rate <0.05 as the cutoff values [8]. We created heat maps of DEGs using the pheatmap package and drew differential gene expression volcano plots using the ggplot2 package [13, 14]. Then, we extracted differentially expressed IRGs from the intersection of immune genes and all DEGs.
Differential immune gene analysis
The search tool STRING (https://string-db.org/) allows searches for interacting genes; it is a biologically predictive web resource containing many proteins and known interaction functions [15]. We used the correlations of these functions and expression levels to analyze and evaluate the interactions of DEGs. We designated a composite score greater than 0.4 as the cutoff criterion. Based on STRING information, we built a PPI network using Cytoscape software [16] (version 3.7.2).
Transcription factor-mediated regulatory network
Transcription factors (TFs) control gene expression, including IRG, and play a vital role in regulating immune function. Therefore, it is necessary to explore the interaction between survival-related IRGs and TFs. First, we downloaded 318 TFs from the Cistrome Cancer database (http://cistrome.org/CistromeCancer/) [17]. Then, we extracted differentially expressed TFs from all DEGs to draw expression heat maps and volcano maps. Subsequently, we used R software to carry out correlation analysis of differentially expressed TFs and survival-related IRGs. If the |correlation value| was >0.6 and P <0.05, the correlation was reliable. We constructed a TF-mediated regulatory network for high-risk survival-related IRGs (HR >1) and potential TF using Cytoscape software.
Development of the IRG-based prognostic index
We used expression data and coefficients of these survival-related IRGs to develop an IRG-based prognostic index (IRGPI) using multivariate analysis. We used multivariate Cox regression analysis to calculate the correlations between risk scores and OS and identify potential prognostic IRGs, with integrated IRGs remaining independent prognostic indicators. Specifically, we constructed the IRGPI by multiplying the expression value with the Cox regression coefficient [18].
Assessment of IRGPI and genetic alteration analysis
We classified patients as high-risk or low-risk based on IRGPI values and used the R package pheatmap to draw risk curves. We drew corresponding Kaplan–Meier survival curves to show the OS of the various risk groups. We drew receiver operating characteristic (ROC) curves to assess the sensitivity and specificity of the model. IRGPI and clinicopathological factors were analyzed for single factor and multi-factor survival. These analyses were performed using the R package survival [19]. We also explored the correlation between hub IRG expression and clinicopathological factors.
Immune cell correlation analysis
The Tumor Immune Estimation Resource (TIMER https://cistrome.shinyapps.io/timer/) is an online database that contains tumor-infiltrating immune cells. We obtained infiltration levels of six immune cells (B cells, CD4+ T cells, CD8+ T cells, neutrophils, macrophages, and dendritic cells) from TCGA and other public validation databases containing tumor information. TIMER reanalyzed gene expression data. Using the database, we determined the abundance of tumor-infiltrating immune cells of six subtypes and the relationships between immune cell infiltration and other parameters. Studies confirmed that the platform is appropriate for the present study [8, 20, 21]. We downloaded immune infiltration levels of patients with BLCA from TIMER and calculated the correlations between IRGPI and immune cell infiltration. P <0.05 was considered statistically significant.
Statistical analysis
We used R software (version 3.6.1) and R-associated packages to perform function enrichment analysis, differential analysis of immune genes, Cox regression analysis, and survival analysis [22]. We used survival and survminer packages in R to create Kaplan–Meier curves and survival ROC curves. We used these findings to assess the performance of IRGPI based on the area under the curve (AUC) of the survival ROC curve [23]. We used an independent t-test to calculate the differences between clinical features and prognosis-related IRGs. P <0.05 was considered statistically significant.
Results
Identification of differentially expressed IRGs
We downloaded 410 BLCA samples and 19 normal samples, including a total of 18769 genes. We identified 4893 DEGs using the R limma package; these included 3468 up-regulated DEGs and 1425 down-regulated DEGs (Figure 1A, 1C). Using the list of IRGs, we identified 261 differentially expressed IRGs, including 120 up-regulated, differentially expressed IRGs, and 141 down-regulated, differentially expressed IRGs (Figure 1B, 1D).
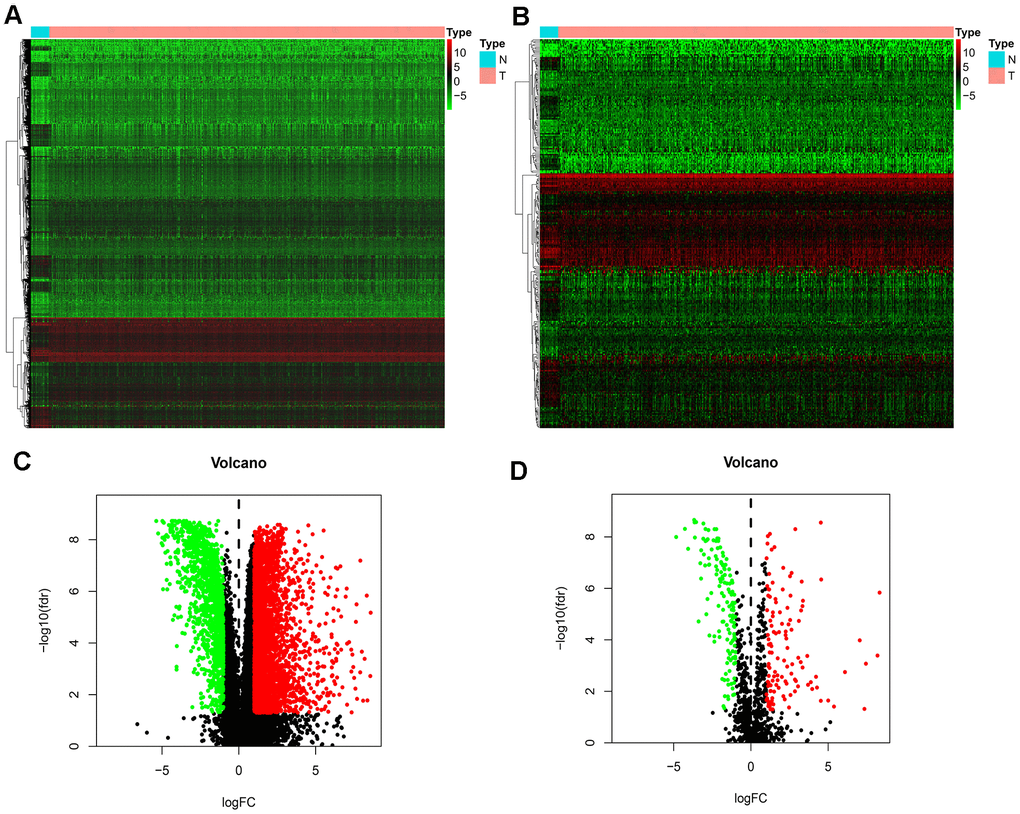
Figure 1. Differentially expressed IRGs. (A) Heatmap demonstrating DEGs between BLCA and normal samples, with red representing high expression and green representing low expression. (B) Heatmap demonstrating differentially expressed IRGs between BLCA and normal samples, with red representing high expression and green representing low expression. (C) Volcano plot of 4893 DEGs, with red representing up-regulated DEGs and green representing down-regulated DEGs. (D) volcano plot of 261 differentially expressed IRGs, with red representing up-regulated IRGs and green representing down-regulated IRGs.
Identification of survival-associated IRGs
To identity the differentially survival-associated IRGs, we performed univariate Cox regression analysis on the expression of 261 differentially expressed IRGs in BLCA. We found that the expression of 26 differentially survival-associated IRGs significantly correlated with OS in patients with BLCA (all P <0.001) (Table 1). The forest plot results in Figure 2 show the prognostic value of these IRGs in patients with BLCA. There were 23 genes with HR >1 and three genes with HR <1. This indicates that most IRGs are high-risk genes for the outcome of BLCA.
Table 1. General characteristics of BLCA-specific immune-related genes.
| Gene symbol | LogFC | FDR | HR | P-value |
| THBS1 | -2.364170784 | 0.0001167 | 1.004234339 | 0.009624386 |
| CXCL12 | -1.793919298 | 5.48E-08 | 1.013942892 | 0.001039896 |
| ZC3HAV1L | 1.32960684 | 0.000174748 | 1.117544502 | 0.006339535 |
| MMP9 | 3.04862784 | 0.006420263 | 1.000283778 | 0.001779972 |
| FABP6 | 2.003815556 | 0.002768244 | 0.980771613 | 0.008948499 |
| RBP7 | -1.120977579 | 7.12E-06 | 1.013395606 | 0.000240158 |
| ADIPOQ | -1.228311896 | 4.98E-07 | 1.113856355 | 1.90E-05 |
| ELN | -1.951814757 | 5.57E-07 | 1.017100402 | 0.00424009 |
| PDGFRA | -1.877812889 | 1.53E-06 | 1.046033385 | 0.000892835 |
| AHNAK | -1.013000982 | 0.006016427 | 1.013593551 | 5.82E-08 |
| PTX3 | -2.032872149 | 7.73E-05 | 1.010441923 | 0.006173227 |
| OAS1 | 1.161396793 | 0.00249904 | 0.986847766 | 0.003445374 |
| OLR1 | 2.847420735 | 0.009974211 | 1.007461503 | 0.009630675 |
| RAC3 | 2.871069381 | 4.99E-09 | 1.026505382 | 1.66E-05 |
| SLIT2 | -2.537542555 | 3.07E-08 | 1.152167049 | 0.009068295 |
| EDNRA | -1.795229834 | 6.78E-06 | 1.086359281 | 0.00075286 |
| IGF1 | -1.186085678 | 3.59E-06 | 1.440812129 | 2.84E-07 |
| KITLG | -1.011084991 | 0.000780218 | 1.025879879 | 0.008832397 |
| PDGFD | -1.75479763 | 1.99E-06 | 1.07999107 | 0.000619345 |
| PGF | 1.55827545 | 0.001770518 | 1.037799866 | 6.85E-05 |
| SPP1 | 4.546905253 | 4.53E-07 | 1.000160276 | 0.005339656 |
| ANGPTL1 | -2.694001199 | 1.19E-07 | 1.028080936 | 0.004962655 |
| IL17RD | -1.187999641 | 0.007763757 | 1.068321126 | 0.008041726 |
| IL17RE | 1.146456501 | 0.004545266 | 1.045799441 | 0.007436093 |
| NRP2 | -1.387343245 | 0.001626737 | 1.043984621 | 0.009260416 |
| OXTR | 2.293078486 | 8.88E-05 | 1.03604654 | 0.006923307 |
| PTGER3 | -1.842483391 | 1.97E-05 | 1.307642614 | 0.002505678 |
| TACR1 | -2.18286288 | 1.15E-08 | 1.417848098 | 0.00706276 |
| SH3BP2 | 1.132467385 | 1.07E-06 | 0.900277442 | 0.009410188 |
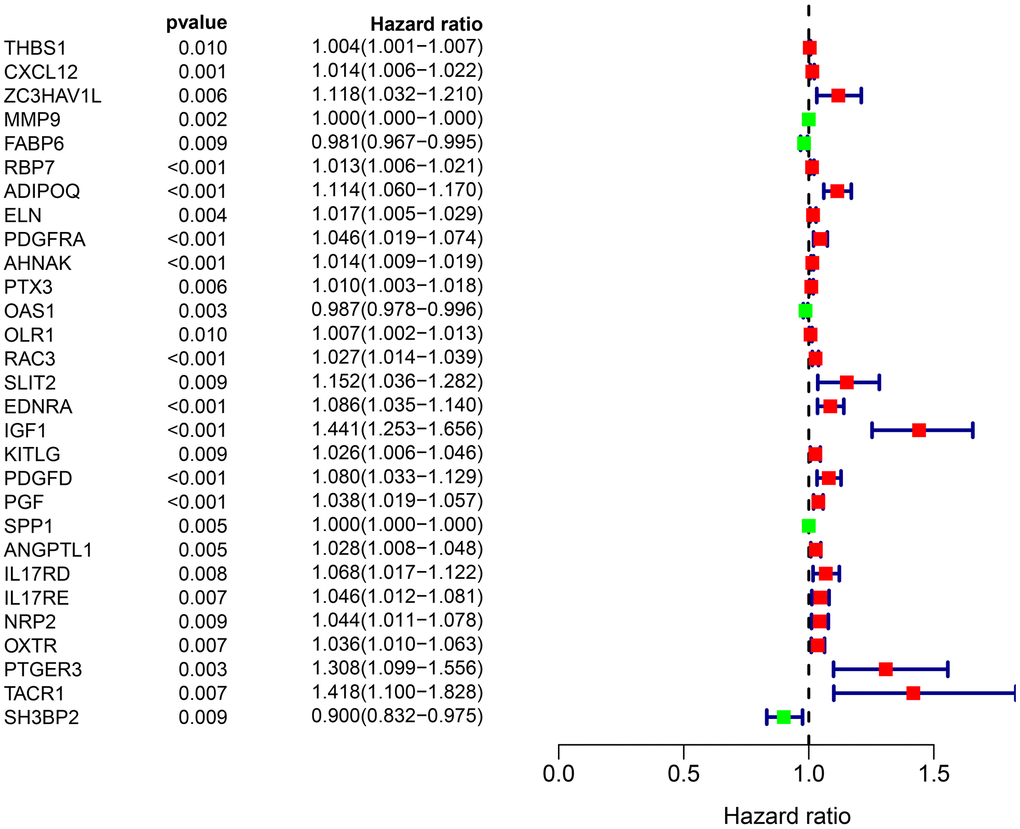
Figure 2. Forest plot of the hazard ratios showing the prognostic values of survival-associated IRGs, red dots represent high-risk genes (HR > 1), and green dots represent low-risk genes (HR < 1).
Transcription factor regulatory network
TF plays a crucial role in regulating molecular networks. To explore the molecular mechanisms between survival-associated IRGs and TF, we downloaded 318 tumor-related TFs from the cancer database to study their regulatory mechanisms. We identified 77 differentially expressed TFs (Figure 3A, 3B) in genes that were differentially expressed between BLCA samples and normal samples, of which 41 were up-regulated and 36 were down-regulated (Figure 3A, 3B). To study the relationship between differentially expressed TF and survival-associated IRGs, we constructed a TF-mediated regulatory network based on 18 TFs and eight survival-associated IRGs (Figure 3C). WWTR1 had the most connections with other survival-associated IRGs, while THBS1 had the most connections with other TFs.
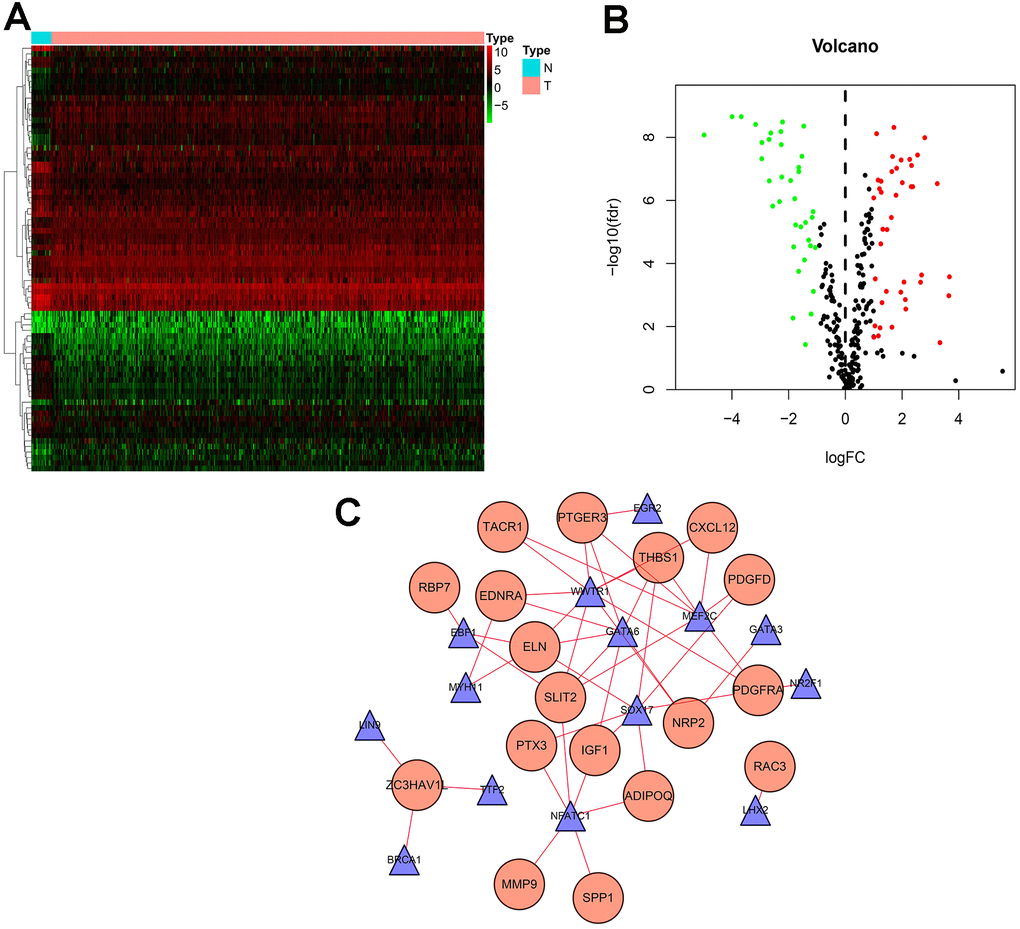
Figure 3. Transcription factor (TF) regulatory network. Differentially expressed TFs in the DEGs between BLCA samples and normal samples. (A) The heatmap and (B) volcano plot of differentially expressed TFs. (C) In the-mediated regulatory network, triangles represent TFs; circles represent IRGs.
Development of IRGPI
To develop an IRGPI, we identified nine survival-associated IRGs for BLCA using multivariate Cox regression analysis, and we constructed the optimal IRGPI to group patients with BLCA (Figure 4). We calculated risk scores based on expression levels of nine survival-associated IRGs and regression coefficients, with the following formula: risk score = [expression level of MMP9×(0.0003)] + [expression level of PDGFRA×(0.0290)] + [expression level of AHNAK×(0.0124)] + [expression level of OAS1×(−0.0084)] + [expression level of OLR1×(0.0053)] + [expression level of RAC3×(0.0229) + [expression level of IGF1×(0.2830)] + [expression level of PGF×(0.0180)] + [expression level of SH3BP2×(−0.0788)]. We divided patients with BLCA into a high-risk group (n = 184) and a low-risk group (n = 185) according to the median risk score. The distribution of risk scores and survival status are shown in Figure 4. High-risk patients died more often than did low-risk patients. According to Kaplan–Meier survival analysis, OS was significantly lower in the high-risk group than in the low-risk group (P = 2.672e−09) (Figure 5). The five-year survival rate for the high-risk group was 51.63%, while the five-year survival rate for the low-risk group was 25.95% (Figure 5). We generated ROC curves, and the AUC was calculated to evaluate the prediction accuracy of the IRGPI. The area was 0.725, suggesting that the IRGPI has excellent potential for predicting patients' survival with BLCA (Figure 5). Univariate and multivariate analysis (Table 2) suggested that IRGPI significantly correlates with survival in BLCA. The pathological stage, T stage, N stage, and IRGPI were independent predictors (Table 2). However, the multivariate analysis suggested that only IRGPI was an independent predictor of outcome in BLCA after adjustment for all relevant clinical factors (Figure 6).
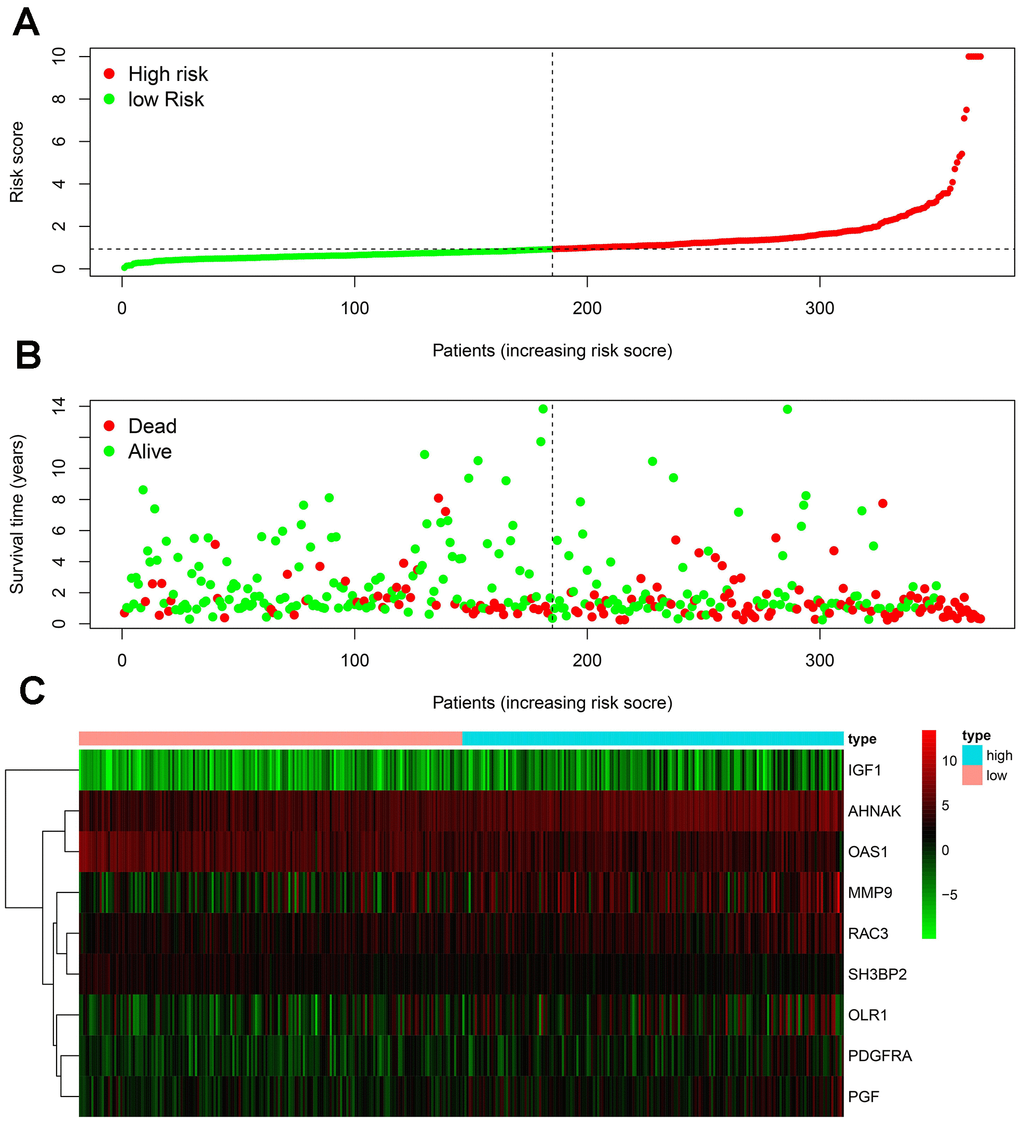
Figure 4. Development of the IRGPI. (A) Distribution of patients with high-risk scores (red color) and low-risk scores (green color); (B) survival status of patients with BLCA (red dots stand for the deceased patients and the green dots stand for the survivors); (C) heatmap of the nine survival-associated IRGs expression profiles.
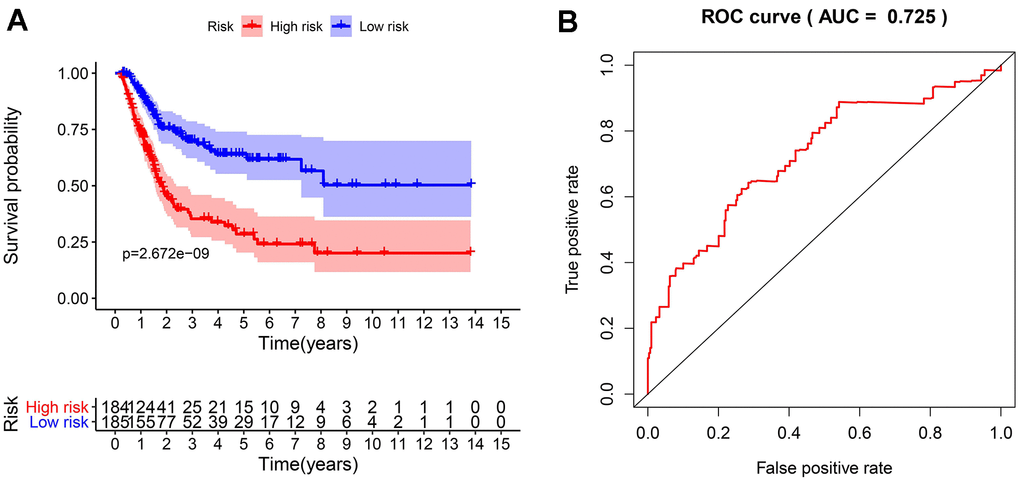
Figure 5. The evaluation of the IRGPI. (A) The Kaplan-Meier curves of OS for patients with high-risk scores (red line) and low-risk scores (blue line); (B) Verification of the accuracy of the IRGPI based on analysis of the AUC of the survival-dependent ROC curve.
Table 2. Univariate and multivariate Cox regression analysis of BLCA.
| Variables | Univariate analysis | Multivariate analysis | |||
| HR (95% CI) | P value | HR (95% CI) | P value | ||
| Age | 1.025(0.995-1.056) | 0.104 | 1.023(0.991-1.056) | 0.156 | |
| Gender | 0.560(0.309-1.016) | 0.056 | 0.696(0.356-1.360) | 0.288 | |
| Pathological stage | 1.894(1.283-2.797) | 0.001 | 1.565(0.734-3.339) | 0.246 | |
| T stage | 1.720(1.133-2.610) | 0.011 | 1.297(0.753-2.234) | 0.349 | |
| N stage | 1.485(1.102-2.002) | 0.009 | 0.981(0.554-1.736) | 0.947 | |
| M stage | 1.881(0.582-6.087) | 0.291 | 1.382(0.360-5.305) | 0.638 | |
| IRGPI | 1.261(1.155-1.377) | <0.001 | 1.228(1.108-1.362) | <0.001 | |
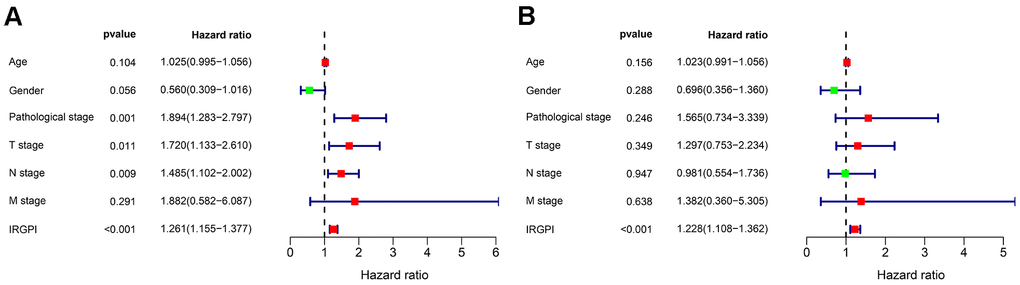
Figure 6. Univariate (A) and multivariate (B) Cox regression analysis in terms of OS for patients with BLCA.
Clinical correlation analysis
To further evaluate the clinical value of IRGPI, we analyzed the relationships between the nine survival-associated IRGs and IRGPI with clinicopathologic factors, including age, gender, pathological stage, T stage, N stage, and M stage (Table 3). IRGPI was an independent predictor. It showed statistically significant differences in terms of pathological and T-stage, but no statistically significant differences in terms of age, gender, N stage, or M stage (Figure 7). These findings suggest that IRGPI accurately predicts the pathological stages of BLCA. We also evaluated the relationships between the abundances of six types of immune cells and the immune-based prognostic index to determine whether the IRGPI accurately reflected the tumor immune microenvironment status. We found that IRGPI significantly correlated with macrophages (Figure 8E). There was no significant correlation between IRPGI and five types of immune cells, including B cells (Figure 8A), CD4+ T cells (Figure 8B), CD8+ T cells (Figure 8C), dendritic cells (Figure 8D), or neutrophils (Figure 8F).
Table 3. The relationship between the expression of the survival-associated IRGs and clinicopathological factors in BLCA.
| Genes | Age(>65/≤65) | Gender (male/female) | Pathological stage (IV-III/I-II) | T stage (T3-T4/T1- T2) | N stage (N1-3/N0) | M stage (M1/ M0) | |||||||||||
| t | P | t | P | t | P | t | P | t | P | t | P | ||||||
| MMP9 | -0.078 | 0.938 | 0.658 | 0.513 | -1.636 | 0.105 | -1.991 | 0.048 | -0.566 | 0.573 | -1.089 | 0.322 | |||||
| PDGFRA | 0.538 | 0.591 | 0.849 | 0.401 | -3.077 | 0.002 | -3.040 | 0.003 | -1.203 | 0.232 | -0.462 | 0.660 | |||||
| AHNAK | 0.760 | 0.449 | 1.447 | 0.157 | -3.700 | <0.001 | -3.933 | <0.001 | -2.238 | 0.028 | 0.942 | 0.382 | |||||
| OAS1 | -2.146 | 0.034 | -2.543 | 0.013 | 2.159 | 0.034 | 2.148 | 0.034 | 1.775 | 0.079 | 2.929 | 0.023 | |||||
| OLR1 | -0.763 | 0.448 | 0.024 | 0.981 | -1.094 | 0.277 | -1.059 | 0.292 | -0.364 | 0.717 | 2.989 | 0.004 | |||||
| RAC3 | 0.382 | 0.703 | 1.040 | 0.305 | -0.544 | 0.588 | 0.066 | 0.947 | -1.703 | 0.093 | -1.129 | 0.309 | |||||
| IGF1 | -0.094 | 0.925 | 0.856 | 0.397 | -3.557 | <0.001 | -3.111 | 0.002 | -1.090 | 0.279 | -0.965 | 0.373 | |||||
| PGF | 0.343 | 0.732 | -0.634 | 0.529 | 0.883 | 0.380 | 0.270 | 0.788 | 2.090 | 0.039 | -0.851 | 0.431 | |||||
| SH3BP2 | -0.798 | 0.427 | 0.214 | 0.832 | 1.799 | 0.077 | 0.900 | 0.371 | 2.546 | 0.012 | -0.121 | 0.908 | |||||
| riskScore | -0.265 | 0.791 | 1.693 | 0.100 | -2.981 | 0.003 | -2.754 | 0.007 | -1.381 | 0.170 | -0.412 | 0.689 | |||||
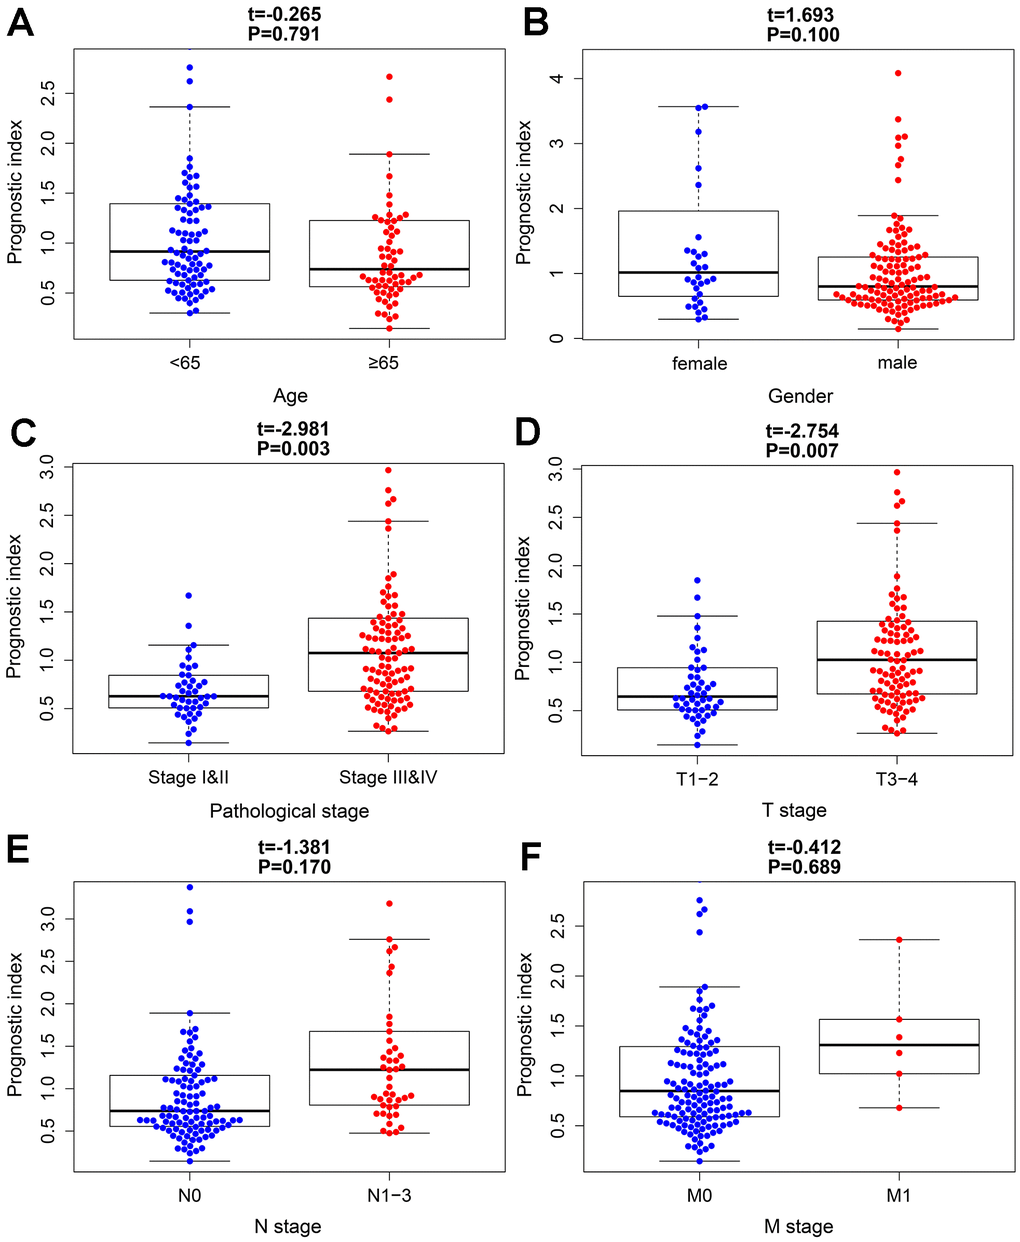
Figure 7. The relationships between the immune-based prognostic index and clinicopathological factors. (A) age; (B) gender; (C) pathological stage; (D) T stage; (E) N stage and (F) M stage in the high-risk (red) and low-risk (blue) groups of the BLCA.
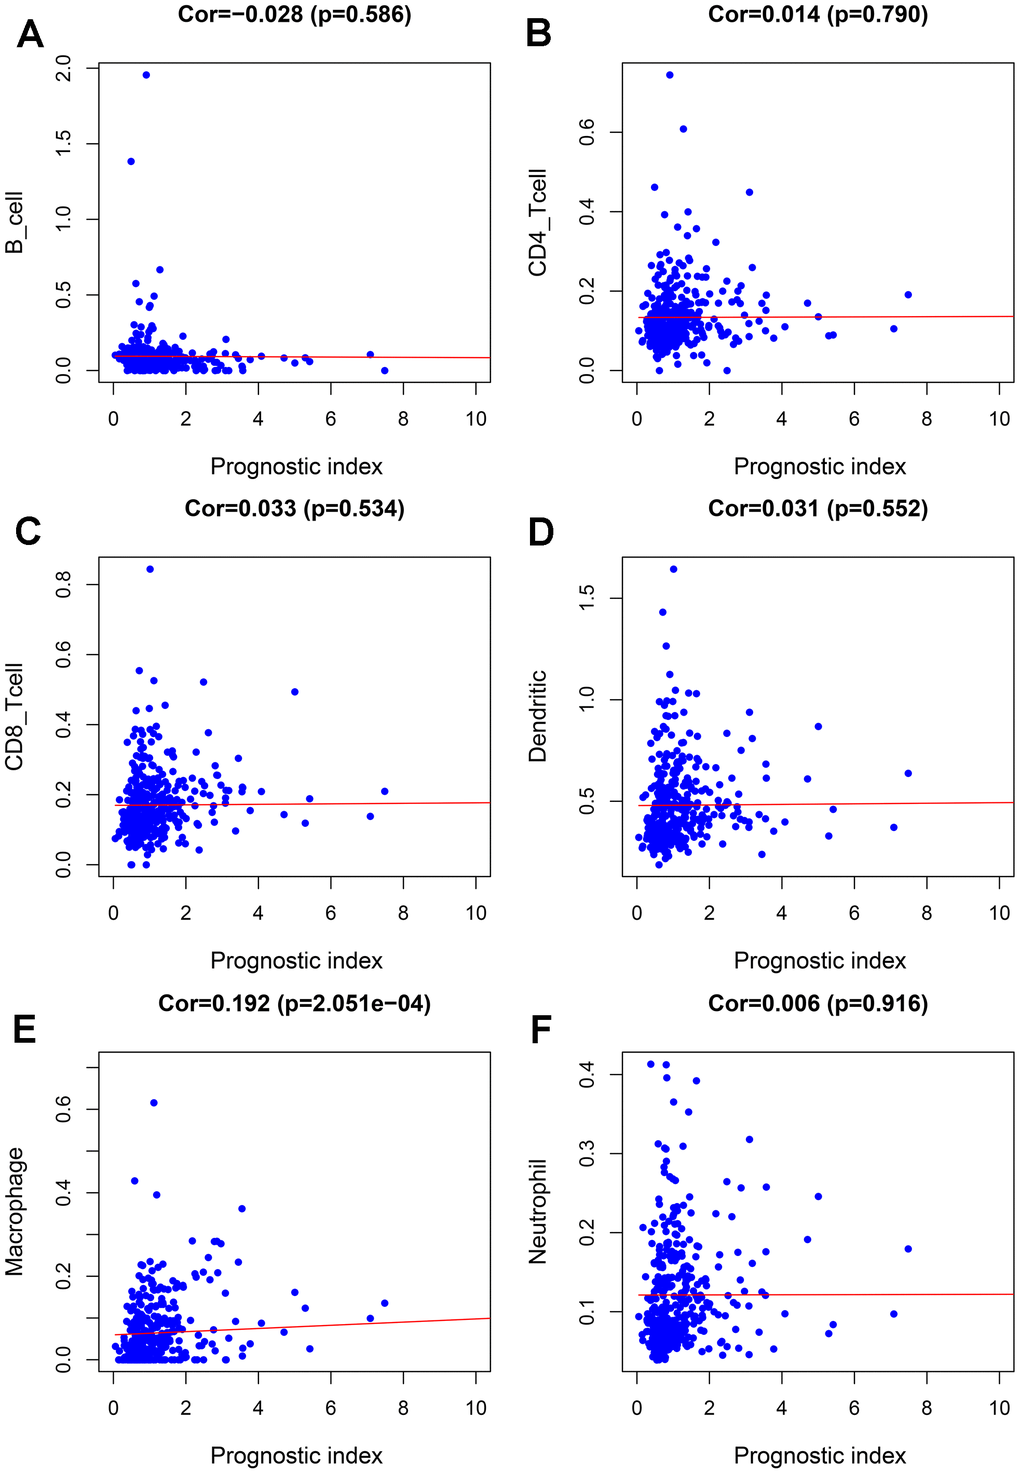
Figure 8. Relationships between the abundances of six types of immune cells and the immune-based prognostic index in patients with BLCA. (A) B cells; (B) CD4 T cells; (C) CD8 T cells; (D) dendritic cells; (E) macrophages; (F) neutrophils.
Discussion
Bladder cancer is a common malignant tumor of the urinary system and has become the 10th most common malignant tumor in Europe and America [1]. About 70% of bladder cancers are non-muscular invasive bladder cancer, and 30% are muscular invasive bladder cancer. Non-muscular invasive bladder cancer is characterized by a high recurrence rate and low mortality, while about 50% of muscular invasive bladder cancer is potentially lethal [24]. The clinical manifestations of non-muscular invasive bladder cancer are heterogeneous, and it is essential to accurately predict the risk of progression of non-muscular invasive bladder cancer. Accurate identification of high-risk populations and formulation of optimal treatment plans in a timely fashion are clinical problems that need to be resolved. Previous studies showed that the prognosis of patients undergoing cystectomy due to the progression of non-muscle invasive bladder cancer is worse than that of patients newly diagnosed with muscle-invasive bladder cancer directly undergoing cystectomy [25]. This suggests that early cystectomy improves outcomes in those at high risk for progression.
The immune system recognizes and eliminates tumor cells; however, tumor cells can evade the immune system through immune escape and immune suppression. Abnormal immune responses are closely related to the occurrence and progression of tumors [26]. Studies found that IRGs play critical regulatory roles in immune responses, including the following: regulation of differentiation and development of bone marrow hematopoietic stem cells; regulation of the development, differentiation, and activation of immune cells; and participation in the activation of autophagy and inflammatory processes [27]. Studies showed that IRGs predict survival and outcomes for various tumors, and they are potential targets for tumor therapy [5, 7, 8, 28, 29].
The development of high-throughput sequencing technology gave rise to the combination of microarray data and bioinformatics for tumor diagnosis and the discovery of prognostic biomarkers. Data mining technology generates gene signatures containing various relevant genes. These gene signatures are widely used in molecular diagnosis, individualized treatment, and survival prediction [30]. Their predictive accuracy is better than those of single biomarkers [31].
For these reasons, it is desirable to use bioinformatics technology to establish immune-related gene signatures to guide treatment and predict outcomes for patients with BLCA. We conducted a comprehensive analysis of the BLCA gene expression profile to identify IRGs that play central roles in the development and outcomes of BLCA. We identified nine IRGs (MMP9, PDGFRA, AHNAK, OAS1, OLR1, RAC3, IGF1, PGF, and SH3BP2) to predict OS using univariate and multivariate Cox proportional hazard regression models. We used the expression levels of these IRGs to establish a prediction model. This method is more economical and clinically feasible than whole-genome sequencing. The combination of nine gene signatures with clinicopathological parameters can enable clinicians to determine individual outcomes more accurately. The risk scoring system is easy to understand and helps customize treatment plans. The ROC curve, Kaplan–Meier analysis, and internal verification showed that this model accurately predicted the OS of BLCA. The correlation analysis between clinicopathological and risk scores showed that the risk scores were related to the pathological and T-stage.
We also explored the ability of risk score and other clinicopathological parameters to predict survival and found that risk score was an independent prognostic indicator of BLCA.
Some of the nine IRGs participate in the development of BLCA and affect outcomes, and some have not been reported. A study reported that LINC01605 up-regulated the expression of MMP9 to promote proliferation, migration, and invasion of BLCA cells [32]. PDGFRA is up-regulated in BLCA tissues, which is significantly related to tumor prognosis and can be used as a prognostic marker of BLCA [33]. In urine cytology, BLCA can be distinguished from benign urothelial lesions by detecting ANHAK [34]. A study found that ANHAK was significantly related to the outcomes of BLCA [35]. OAS1 was significantly related to outcomes of BLCA and can be used as a prognostic marker [35]. RAC3 is highly expressed in bladder cancer tissues and can promote the proliferation, migration, and invasion of bladder cancer cells [36]. A study reported that plasma IGF1 is highly expressed in patients with bladder cancer; measuring plasma IGF1 values can help assess bladder cancer risk [37]. There is no report on the roles of OLR1, PGF, or SH3BP2 in outcomes of bladder cancer.
We also focused on the relationship between risk score and tumor microenvironment to reveal its potential clinical significance. The risk score reflects the infiltration state of macrophages. The higher the risk score, the higher the abundance of macrophages, suggesting that higher amounts of abnormal expression of immune genes correspond to a higher abundance of macrophages in the tumor immune microenvironment; this, in turn, participates in the occurrence and progression of BLCA and the processes of invasion and metastasis. Tumor-associated macrophages are part of the tumor microenvironmental cells and affect the progress of solid tumors. Studies have found that macrophages can directly affect the immune response to bladder cancer induced by Bacillus Calmette-Guerin [38]. In addition, studies have found that exosomes miR-21 can promote cancer progression through polarized tumor-associated macrophages [39].
This study may provide new insights into the molecular mechanisms, immunotherapy, and prognostic predictions of BLCA. One of the advantages of the BLCA predictive risk-scoring model constructed in this study is its high sensitivity and specificity for predicting OS. Random internal verification demonstrated its effectiveness. The risk scoring model is related to the immunosuppressive environment and immune checkpoint expression and may help clinicians plan personalized immunotherapy for patients with BLCA.
This study also has some limitations. First, the risk scoring model needs to be further validated in multi-center clinical trials and prospective studies. Second, further research on the functions and mechanisms of the nine IRGs is needed.
Data availability
All data generated or analyzed during this study are included in this article.
Author Contributions
GenYi Qu, Zhengsheng Liu wrote the main manuscript text, Yong Xu performed experiments, Guang Yang, Maolin Xiang, Cheng Tang collected data, All the authors reviewed the manuscript and discussed the results and edited the manuscript.
Conflicts of Interest
The authors declare that they have no conflicts of interest.
Funding
This work was supported in part by grants from Zhuzhou City Science and Technology Plan Project (#2019-001) and Hunan Province Science and Technology Innovation Project (#S2018SFYLJS0466).
References
- 1. Saginala K, Barsouk A, Aluru JS, Rawla P, Padala SA, Barsouk A. Epidemiology of Bladder Cancer. Med Sci (Basel). 2020; 8:15. https://doi.org/10.3390/medsci8010015 [PubMed]
- 2. Liu X, Jiang J, Yu C, Wang Y, Sun Y, Tang J, Chen T, Bi Y, Liu Y, Zhang ZJ. Secular trends in incidence and mortality of bladder cancer in China, 1990-2017: A joinpoint and age-period-cohort analysis. Cancer Epidemiol. 2019; 61:95–103. https://doi.org/10.1016/j.canep.2019.05.011 [PubMed]
- 3. Grayson M. Bladder cancer. Nature. 2017; 551:S33. https://doi.org/10.1038/551S33a [PubMed]
- 4. Miyamoto DT, Mouw KW, Feng FY, Shipley WU, Efstathiou JA. Molecular biomarkers in bladder preservation therapy for muscle-invasive bladder cancer. Lancet Oncol. 2018; 19:e683–95. https://doi.org/10.1016/S1470-2045(18)30693-4 [PubMed]
- 5. Lin K, Huang J, Luo H, Luo C, Zhu X, Bu F, Xiao H, Xiao L, Zhu Z. Development of a prognostic index and screening of potential biomarkers based on immunogenomic landscape analysis of colorectal cancer. Aging (Albany NY). 2020; 12:5832–57. https://doi.org/10.18632/aging.102979 [PubMed]
- 6. Kim J. Immune checkpoint blockade therapy for bladder cancer treatment. Investig Clin Urol. 2016 (Suppl 1); 57:S98–105. https://doi.org/10.4111/icu.2016.57.S1.S98 [PubMed]
- 7. Li L, Wang XL, Lei Q, Sun CZ, Xi Y, Chen R, He YW. Comprehensive immunogenomic landscape analysis of prognosis-related genes in head and neck cancer. Sci Rep. 2020; 10:6395. https://doi.org/10.1038/s41598-020-63148-8 [PubMed]
- 8. Lin P, Guo YN, Shi L, Li XJ, Yang H, He Y, Li Q, Dang YW, Wei KL, Chen G. Development of a prognostic index based on an immunogenomic landscape analysis of papillary thyroid cancer. Aging (Albany NY). 2019; 11:480–500. https://doi.org/10.18632/aging.101754 [PubMed]
- 9. Lin P, He RQ, Huang ZG, Zhang R, Wu HY, Shi L, Li XJ, Li Q, Chen G, Yang H, He Y. Role of global aberrant alternative splicing events in papillary thyroid cancer prognosis. Aging (Albany NY). 2019; 11:2082–97. https://doi.org/10.18632/aging.101902 [PubMed]
- 10. Bhattacharya S, Andorf S, Gomes L, Dunn P, Schaefer H, Pontius J, Berger P, Desborough V, Smith T, Campbell J, Thomson E, Monteiro R, Guimaraes P, et al. ImmPort: disseminating data to the public for the future of immunology. Immunol Res. 2014; 58:234–39. https://doi.org/10.1007/s12026-014-8516-1 [PubMed]
- 11. Bhattacharya S, Dunn P, Thomas CG, Smith B, Schaefer H, Chen J, Hu Z, Zalocusky KA, Shankar RD, Shen-Orr SS, Thomson E, Wiser J, Butte AJ. ImmPort, toward repurposing of open access immunological assay data for translational and clinical research. Sci Data. 2018; 5:180015. https://doi.org/10.1038/sdata.2018.15 [PubMed]
- 12. Ritchie ME, Phipson B, Wu D, Hu Y, Law CW, Shi W, Smyth GK. limma powers differential expression analyses for RNA-sequencing and microarray studies. Nucleic Acids Res. 2015; 43:e47. https://doi.org/10.1093/nar/gkv007 [PubMed]
- 13. Gu Z, Eils R, Schlesner M. HilbertCurve: an R/Bioconductor package for high-resolution visualization of genomic data. Bioinformatics. 2016; 32:2372–74. https://doi.org/10.1093/bioinformatics/btw161 [PubMed]
- 14. Ito K, Murphy D. Application of ggplot2 to Pharmacometric Graphics. CPT Pharmacometrics Syst Pharmacol. 2013; 2:e79. https://doi.org/10.1038/psp.2013.56 [PubMed]
- 15. Szklarczyk D, Franceschini A, Wyder S, Forslund K, Heller D, Huerta-Cepas J, Simonovic M, Roth A, Santos A, Tsafou KP, Kuhn M, Bork P, Jensen LJ, von Mering C. STRING v10: protein-protein interaction networks, integrated over the tree of life. Nucleic Acids Res. 2015; 43:D447–52. https://doi.org/10.1093/nar/gku1003 [PubMed]
- 16. Shannon P, Markiel A, Ozier O, Baliga NS, Wang JT, Ramage D, Amin N, Schwikowski B, Ideker T. Cytoscape: a software environment for integrated models of biomolecular interaction networks. Genome Res. 2003; 13:2498–504. https://doi.org/10.1101/gr.1239303 [PubMed]
- 17. Tang Q, Chen Y, Meyer C, Geistlinger T, Lupien M, Wang Q, Liu T, Zhang Y, Brown M, Liu XS. A comprehensive view of nuclear receptor cancer cistromes. Cancer Res. 2011; 71:6940–47. https://doi.org/10.1158/0008-5472.CAN-11-2091 [PubMed]
- 18. Zhang Z, Reinikainen J, Adeleke KA, Pieterse ME, Groothuis-Oudshoorn CG. Time-varying covariates and coefficients in Cox regression models. Ann Transl Med. 2018; 6:121. https://doi.org/10.21037/atm.2018.02.12 [PubMed]
- 19. Rizvi AA, Karaesmen E, Morgan M, Preus L, Wang J, Sovic M, Hahn T, Sucheston-Campbell LE. gwasurvivr: an R package for genome-wide survival analysis. Bioinformatics. 2019; 35:1968–70. https://doi.org/10.1093/bioinformatics/bty920 [PubMed]
- 20. Li B, Severson E, Pignon JC, Zhao H, Li T, Novak J, Jiang P, Shen H, Aster JC, Rodig S, Signoretti S, Liu JS, Liu XS. Comprehensive analyses of tumor immunity: implications for cancer immunotherapy. Genome Biol. 2016; 17:174. https://doi.org/10.1186/s13059-016-1028-7 [PubMed]
- 21. Li T, Fan J, Wang B, Traugh N, Chen Q, Liu JS, Li B, Liu XS. TIMER: A Web Server for Comprehensive Analysis of Tumor-Infiltrating Immune Cells. Cancer Res. 2017; 77:e108–10. https://doi.org/10.1158/0008-5472.CAN-17-0307 [PubMed]
- 22. Yu G, Wang LG, Han Y, He QY. clusterProfiler: an R package for comparing biological themes among gene clusters. OMICS. 2012; 16:284–87. https://doi.org/10.1089/omi.2011.0118 [PubMed]
- 23. Heagerty PJ, Lumley T, Pepe MS. Time-dependent ROC curves for censored survival data and a diagnostic marker. Biometrics. 2000; 56:337–44. https://doi.org/10.1111/j.0006-341x.2000.00337.x [PubMed]
- 24. Marcos-Gragera R, Mallone S, Kiemeney LA, Vilardell L, Malats N, Allory Y, Sant M, and EUROCARE-5 Working Group:. Urinary tract cancer survival in Europe 1999-2007: Results of the population-based study EUROCARE-5. Eur J Cancer. 2015; 51:2217–30. https://doi.org/10.1016/j.ejca.2015.07.028 [PubMed]
- 25. Moschini M, Sharma V, Dell’oglio P, Cucchiara V, Gandaglia G, Cantiello F, Zattoni F, Pellucchi F, Briganti A, Damiano R, Montorsi F, Salonia A, Colombo R. Comparing long-term outcomes of primary and progressive carcinoma invading bladder muscle after radical cystectomy. BJU Int. 2016; 117:604–10. https://doi.org/10.1111/bju.13146 [PubMed]
- 26. Rooney MS, Shukla SA, Wu CJ, Getz G, Hacohen N. Molecular and genetic properties of tumors associated with local immune cytolytic activity. Cell. 2015; 160:48–61. https://doi.org/10.1016/j.cell.2014.12.033 [PubMed]
- 27. Bufalino C, Hepgul N, Aguglia E, Pariante CM. The role of immune genes in the association between depression and inflammation: a review of recent clinical studies. Brain Behav Immun. 2013; 31:31–47. https://doi.org/10.1016/j.bbi.2012.04.009 [PubMed]
- 28. Qiang W, Dai Y, Sun G, Xing X, Sun X. Development of a prognostic index of colon adenocarcinoma based on immunogenomic landscape analysis. Ann Transl Med. 2020; 8:284. https://doi.org/10.21037/atm.2020.03.09 [PubMed]
- 29. Su Q, Sun Y, Zhang Z, Yang Z, Qiu Y, Li X, Mo W. Identification of Prognostic Immune Genes in Bladder Urothelial Carcinoma. Biomed Res Int. 2020; 2020:7510120. https://doi.org/10.1155/2020/7510120 [PubMed]
- 30. Yu Y, Feng X, Cang S. A two-microRNA signature as a diagnostic and prognostic marker of pancreatic adenocarcinoma. Cancer Manag Res. 2018; 10:1507–15. https://doi.org/10.2147/CMAR.S158712 [PubMed]
- 31. Yuan GQ, Wei NL, Mu LY, Wang XQ, Zhang YN, Zhou WN, Pan YW. A 4-miRNAs signature predicts survival in glioblastoma multiforme patients. Cancer Biomark. 2017; 20:443–52. https://doi.org/10.3233/CBM-170205 [PubMed]
- 32. Qin Z, Wang Y, Tang J, Zhang L, Li R, Xue J, Han P, Wang W, Qin C, Xing Q, Yang J, Zhang W. High LINC01605 expression predicts poor prognosis and promotes tumor progression via up-regulation of MMP9 in bladder cancer. Biosci Rep. 2018; 38:BSR20180562. https://doi.org/10.1042/BSR20180562 [PubMed]
- 33. Mezheyeuski A, Segersten U, Leiss LW, Malmström PU, Hatina J, Östman A, Strell C. Fibroblasts in urothelial bladder cancer define stroma phenotypes that are associated with clinical outcome. Sci Rep. 2020; 10:281. https://doi.org/10.1038/s41598-019-55013-0 [PubMed]
- 34. Lee H, Kim K, Woo J, Park J, Kim H, Lee KE, Kim H, Kim Y, Moon KC, Kim JY, Park IA, Shim BB, Moon JH, et al. Quantitative Proteomic Analysis Identifies AHNAK (Neuroblast Differentiation-associated Protein AHNAK) as a Novel Candidate Biomarker for Bladder Urothelial Carcinoma Diagnosis by Liquid-based Cytology. Mol Cell Proteomics. 2018; 17:1788–802. https://doi.org/10.1074/mcp.RA118.000562 [PubMed]
- 35. Qiu H, Hu X, He C, Yu B, Li Y, Li J. Identification and Validation of an Individualized Prognostic Signature of Bladder Cancer Based on Seven Immune Related Genes. Front Genet. 2020; 11:12. https://doi.org/10.3389/fgene.2020.00012 [PubMed]
- 36. Cheng C, Song D, Wu Y, Liu B. RAC3 Promotes Proliferation, Migration and Invasion via PYCR1/JAK/STAT Signaling in Bladder Cancer. Front Mol Biosci. 2020; 7:218. https://doi.org/10.3389/fmolb.2020.00218 [PubMed]
- 37. Mahmoud MA, Ali MH, Hassoba HM, Elhadidy GS. Serum interleukin-8 and insulin like growth factor-1 in Egyptian bladder cancer patients. Cancer Biomark. 2010; 6:105–10. https://doi.org/10.3233/CBM-2009-0133 [PubMed]
- 38. Sharifi L, Nowroozi MR, Amini E, Arami MK, Ayati M, Mohsenzadegan M. A review on the role of M2 macrophages in bladder cancer; pathophysiology and targeting. Int Immunopharmacol. 2019; 76:105880. https://doi.org/10.1016/j.intimp.2019.105880 [PubMed]
- 39. Lin F, Yin HB, Li XY, Zhu GM, He WY, Gou X. Bladder cancer cell-secreted exosomal miR-21 activates the PI3K/AKT pathway in macrophages to promote cancer progression. Int J Oncol. 2020; 56:151–64. https://doi.org/10.3892/ijo.2019.4933 [PubMed]