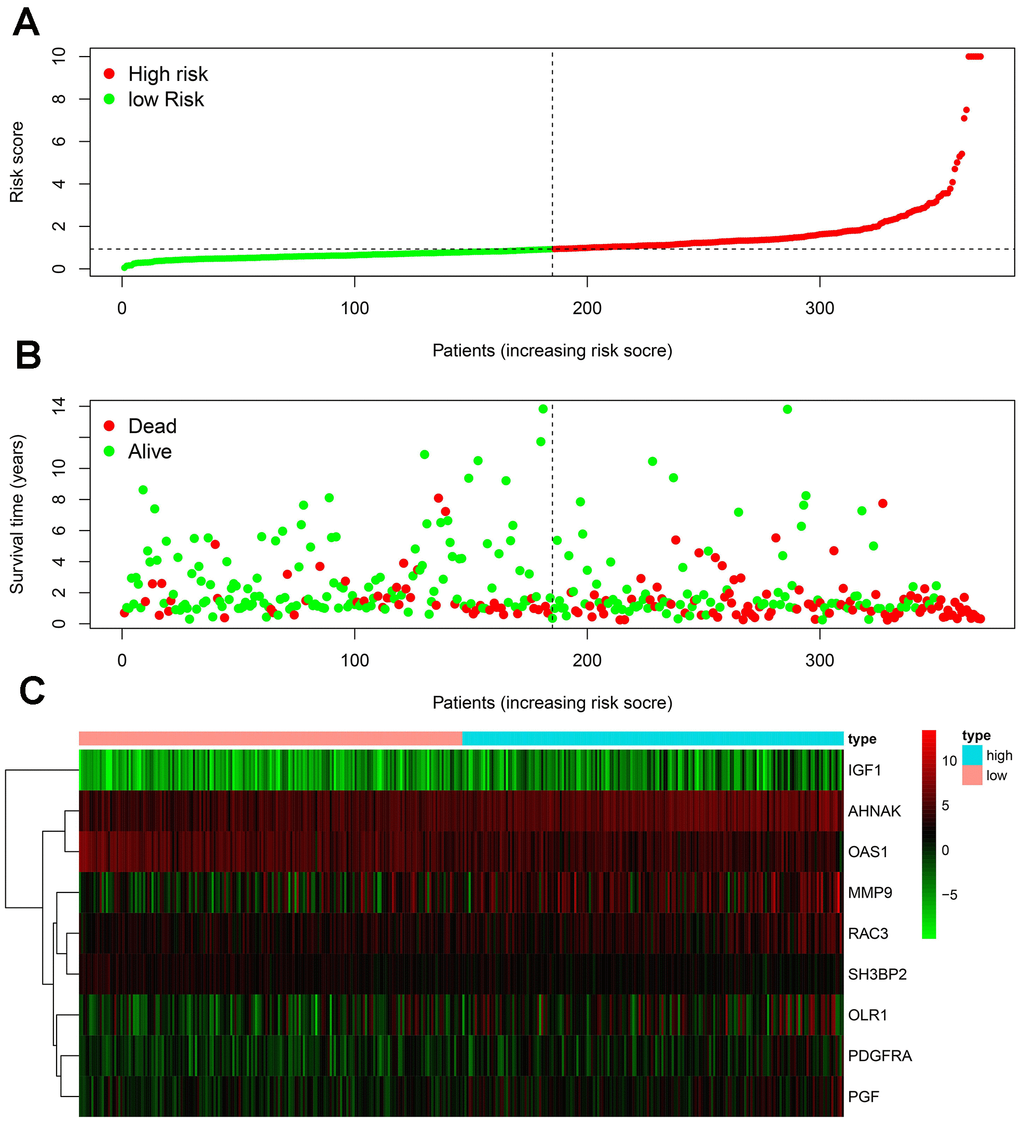
Figure 4.Development of the IRGPI. (A) Distribution of patients with high-risk scores (red color) and low-risk scores (green color); (B) survival status of patients with BLCA (red dots stand for the deceased patients and the green dots stand for the survivors); (C) heatmap of the nine survival-associated IRGs expression profiles.