


Introduction
Deproteinized Calf Blood Extractive Injection (DCBEI) is a sterile solution that contains more than 200 bioactive constituents including inorganics and small molecule organics; it is derived from fresh calf blood by deproteinization, ultrafiltration and incrassation [1]. DCBEI is approved for clinical use in some Asian and Eastern European countries. The main disease areas in which DCBEI is used are brain ischemia, dysneuria and craniocerebral trauma, peripheral arterial disease and diabetic polyneuropathy. DCBEI reduces pathophysiology in the brain by improving oxygen uptake and utilization, thereby enhancing oxidative metabolism; the treatment also enhances glucose uptake and mitochondrial energy metabolism [2]. DCBEI reduces the level of reactive oxygen species (ROS), which prevents neurons from undergoing apoptosis [2]. In rats with transient global cerebral ischemia, DCBEI improves spatial learning and memory [1]. To date, however, the therapeutic effects of DCBEI in Alzheimer's disease (AD) have not been systematically reported.
China is moving toward an aging society. According to statistics, there were 10 million AD patients in China by 2018, which accounted for one fifth of all AD patients worldwide. AD is associated with unavoidable societal problems such as the economic and healthcare burdens associated with care of the elderly. Indeed, the cost of caring for those with AD has surpassed the cost of managing heart disease, cancer and stroke [3]. The major clinical feature of AD is progressive cognitive decline. However, the underlying pathogenesis is poorly understood because multiple genetic and environmental factors contribute to the disease. Cognitive decline is associated with the accumulation of extracellular amyloid-β (Aβ) plaques and neurofibrillary tangles in the brain that are precipitated by hyperphosphorylation of the Tau protein [4]. Increased levels of Aβ1-40 and Aβ1-42 are associated with oxidative stress in the hippocampus [5]. The accumulation of these peptides occurs earlier in the AD brain and before the appearance of the amyloid plaques; therefore, these peptides are implicated in AD pathology [6]. Aβ deposited in plaques exerts neurotoxic effects in a variety of ways, including the disruption of mitochondrial function by binding to alcohol dehydrogenase [7], inhibition of anti-apoptotic insulin signaling [8], and the physical disruption of functional connections between neurons [9]. Induction of oxidative stress may trigger Aβ deposition [10] and Tau phosphorylation [11]. Thus, preventive strategies that control oxidative stress and target neuronal function may prevent AD.
Glutamate (Glu) is an excitatory neurotransmitter in the brain [12], and an excessive level of Glu is associated with ROS accumulation and increased calcium influx [13]. Glu metabolism is impaired in AD patients, and its accumulation damages neurons via excitotoxicity [14]. L-glutamate (L-Glu)-induced neurotoxicity in HT22 cells is an established model that recapitulates the oxidative stress and mitochondrion-dependent apoptosis that is observed in AD neurons [13, 15]. β-amyloid precursor protein (β-APP) and Presenilin 1 (PS1) play important roles in AD [16], as each of these proteins significantly accelerates the rate of decline in cognitive function, which in turn leads to an accelerated AD clinical course [17].
In this study, we systematically investigated the neuroprotective effects of DCBEI using a cellular model of glutamate-induced excitotoxicity and APP/PS1 mice as an AD model. Based on the results of our proteomic and metabonomic studies, we conclude that DCBEI-dependent neuroprotection is due to its ability to attenuate mitochondria-driven oxidative stress. Our data suggest that DCBEI could be used as an adjuvant agent for AD therapy in the clinical setting.
Results
The detection of DCBEI compositions
Seventeen amino acids were identified in DCBEI, the most abundant of which were phenylalanine (15.37 g/kg), histidine (10.21 g/kg) and glutamic acid (10.16 g/kg) (Table 1). Of the five types of nucleotide that were detected, the levels of hypoxanthine nucleotide (9.19 mg/100 g) and uridylic acid (9.04 mg/100 g) were highest (Table 1). The ribose content of DBCEI was 140.07 mg/kg, and the molecular weight distribution of DBCEI was predominantly between 0 and 500 kDa (93.92%) (Table 1).
Table 1. The composition of DCBEI.
| Compounds | Contents | Compounds | Contents | Compounds | Contents | |
| Amino acid (g/kg) | Aspartic acid (Asp) | 0.02 | Serine (Ser) | 0.24 | Phenylalanine (Phe) | 15.37 |
| L-Threonine (Thr) | 0.17 | Valine (Val) | 0.97 | Valine (Lys) | 0.93 | |
| Serine (Ser) | 0.24 | Methionine (Met) | 3.13 | Histidine (His) | 10.21 | |
| Glutamic acid (Glu) | 10.16 | Isoleucine (Ile) | 1.12 | Arginine (Arg) | 2.46 | |
| Glycine (Gly) | 0.56 | Leucine (Leu) | 2.21 | Proline (Pro) | 6.32 | |
| Alanine (Ala) | 1.81 | Tyrosine (Tyr) | 0.61 | |||
| Nucleotide (mg/ 100 g) | Cytidylic acid (CMP) | 0.91 | Hypoxanthine nucleotide (IMP) | 9.19 | Uridylic acid (UMP) | 9.04 |
| Guanine (GMP) | 0.98 | adenylic acid (AMP) | 2.52 | |||
| Ribose (mg/kg) | 140.07 | |||||
| Molecular weight distribution (%) | <100 | 42.08 | 100~300 | 36.17 | 300~500 | 15.67 |
| >500 | 6.08 |
DCBEI protects HT22 cells against mitochondrial apoptosis
L-Glu reduced the viability of HT22 cells by 30.1%, whereas DCBEI improved >20% cell viability, especially at concentrations of 6 mg/mL to 8 mg/mL (p. < 0.01; Figure 1A). Compared to cells treated only with L-Glu, those co-treated with DCBEI showed suppressed cell apoptosis rate by >9.5% (p. < 0.01, Figure 1B) and reduced caspase-3/7 activity by 37.5% (p. < 0.01) (Figure 1C), caspase-8 activity by 78.3% (p. < 0.001) (Figure 1D) and caspase-9 activity by 64.2% (p. < 0.001) (Figure 1E). DCBEI at concentrations of 4 mg/mL and 8 mg/mL strongly suppressed the accumulation of ROS, as indicated by the reduced red fluorescence intensity (Figure 2A) and green fluorescence intensity (Figure 2B), and prevented the dissipation of MMP, as indicated by the reduced green/red fluorescence ratio (Figure 2C). DCBEI also inhibited Ca2+ influx in L-Glu-treated HT22 cells, as indicated by the reduced green fluorescence intensity of the reporter (Figure 2D). Additionally, DCBEI suppressed the induction of pro-apoptotic proteins including Bax, Bid, Bad, cleaved PARP-1, Calpain-1 and phospho-Drp1, and increased the levels of anti-apoptotic proteins including Bcl-2, Bcl-XL and phospho-RSK1 p90 in L-Glu-treated HT22 cells (Figure 2E).
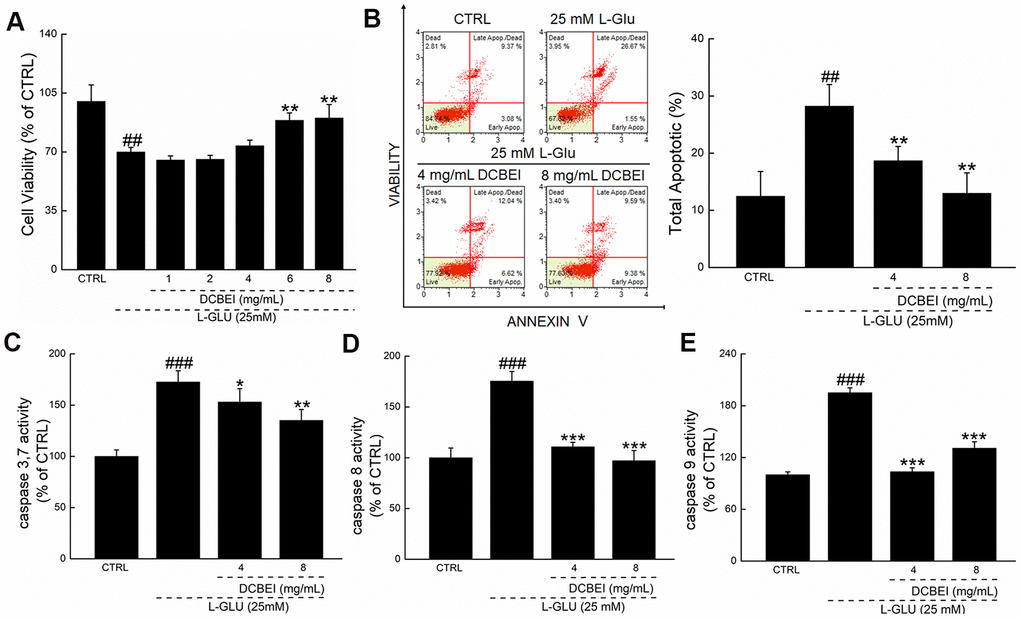
Figure 1. DCBEI protects HT22 cells against L-Glu-induced damage. HT22 cells were pre-incubated with DCBEI (4 mg/mL or 8 mg/mL) for 3 h, and co-treated with L-Glu for a further 24 h. (A) DCBEI increased cell viability. (B) DCBEI inhibited apoptosis. DCBEI attenuated the activation of caspase-3/7 (C), caspase-8 (D) and caspase-9 (E). Data are expressed as a percentage of corresponding control cells and means ± S.D. (n = 6). ## P < 0.01 and ### P < 0.001 vs. CTRL, * P < 0.05, ** P < 0.01 and *** P < 0.001 vs. L-Glu-treated cells.
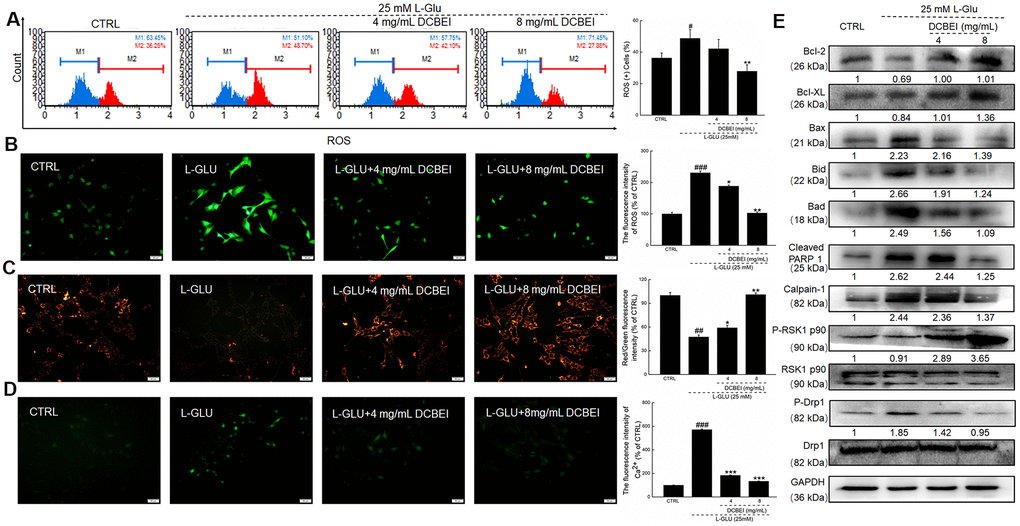
Figure 2. HT22 cells were pre-incubated with DCBEI (4 mg/mL or 8 mg/mL) for 3 h, and co-treated with L-Glu for a further 24 h. (A) DCBEI reduced the intracellular ROS activity in L-Glu-treated HT22 cells (n = 3). (B) DCBEI reduced L-Glu-induced ROS production (200×) (Scale bar: 50 μm) (n = 3). (C) DCBEI attenuated L-Glu-induced MMP dissipation (200×) (Scale bar: 50 μm) (n = 3). (D) Fluo 4-AM staining indicated that DCBEI suppressed L-Glu-induced Ca2+ increases (200×) (Scale bar: 50 μm) (n = 3). (E) DCBEI regulated the expression of proteins related to mitochondrial function. DCBEI increased the levels of anti-apoptotic proteins (Bcl-2, Bcl-xL and P-RSK1 p90) and reduced the levels of pro-apoptotic proteins (Bax, Bid, Bad, cleaved PARP-1, Calpain-1 and p-Drp1) in L-Glu-treated HT22 cells. Quantification data were normalized to GAPDH and the corresponding total proteins, and reported as fold change relative to CTRL (n = 3). Data are expressed as a percentage of corresponding control cells and means ± S.D. # P < 0.05, ## P < 0.01 and ### P < 0.001 vs. CTRL, * P < 0.05, ** P < 0.01 and *** P < 0.001 vs. L-Glu-treated cells.
Aβ1-42 treatment of U251 significantly reduced survival due to the induction of apoptosis; this effect was reversed by treatment with 4 mg/mL to mg/mL DCBEI (P < 0.05). Compared to cells treated only with Aβ1-42, those co-treated with DCBEI showed suppressed cell apoptosis rate (P < 0.01, Supplementary Figure 1).
DCBEI alleviated the AD-like symptoms in APP/PS1 mice
In the behavioral tests, administration of DCBEI for 28-days reduced the escape latency that APP/PS1 mice in the Morris water maze test (30.50 ± 7.84 s [DCBEI at 160 mg/kg, p < 0.05] and 19.33 ± 5.64 s [DCBEI at 320 mg/kg, p < 0.01] versus 51.67 ± 10.54 s [APP/PS1mice]; Figure 3A). It also reduced the time of mice took to enter the central area in the open field test (66.53 ± 12.79 s [DCBEI at 160 mg/kg, p < 0.05] and 35.58 ± 13.94 s [DCBEI at 320 mg/kg, p < 0.01] versus 112.07 ± 9.94 s [APP/PS1mice]; Figure 3B).
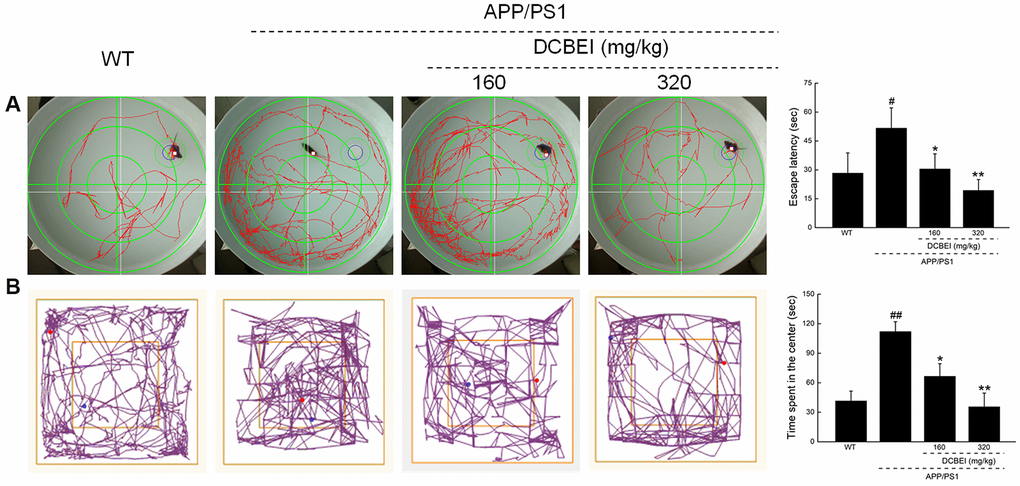
Figure 3. DCBEI improves the behavioral performance of APP/PS1 mice. Compared with non-treated APP/PS1 mice, a 28-day course of DCBEI (A) reduced the escape latency time in the Morris water maze test, (B) decreased the time taken for mice to enter the central area in an open field test. Data are expressed as means ± S.D. (n = 10). # P < 0.05 and ## P < 0.01 vs. WT, * P < 0.05 and ** P < 0.01 vs. APP/PS1 mice.
As Aβ1-42 forms the core of amyloid plaques, it is heavily implicated in the pathology associated with plaque deposition. Compared with non-treated APP/PS1 mice, treatment with 160 mg/kg and 320 mg/kg DCBEI for 28 days reduced hippocampal Aβ1-42 concentrations by 17.1% and 14.8%, respectively (p < 0.01) (Figure 4A). There were concomitant increases of 11.7% and 7.4% in the serum concentration of Aβ1-42 with 160 mg/kg and 320 mg/kg DCBEI, respectively (p < 0.05) (Figure 4B).
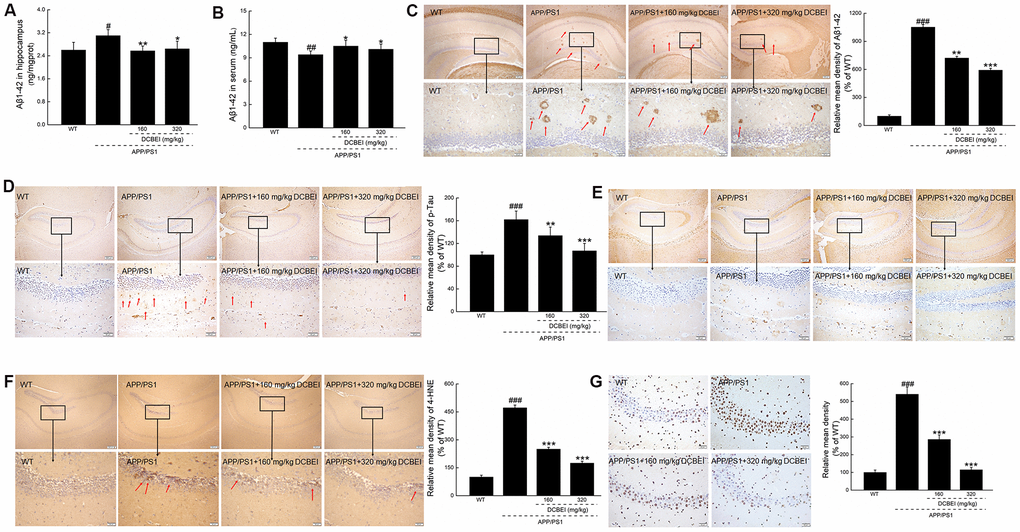
Figure 4. DCBEI attenuates pathology in the brains of APP/PS1 mice. DCBEI (A) reduced the expression of Aβ1-42 in the hippocampus (n = 10), and (B) increased the levels of Aβ1-42 in the serum (n = 10). Data are expressed as means ± S.D. (n = 10). # P < 0.05 and ## P < 0.01 vs. WT, * P < 0.05 and ** P < 0.01 vs. APP/PS1 mice. (C) DCBEI reduced the level of Aβ in the hippocampus (n = 3). (D) DCBEI attenuated the increase in p-Tau levels in the hippocampus (n = 3), (E) but did not affect the levels of total Tau (n = 3). (F) DCBEI significantly reduced the levels of 4-HNE in the brains of APP/PS1 mice (n = 3) (40×) (Scale bar: 200 μm) (200×) (Scale bar: 50 μm). (G) TUNEL staining shows that a 28-day course of DCBEI significantly reduces apoptosis (n = 3) (200×) (Scale bar: 50 μm).
The DCBEI-dependent reduction of Aβ1-42 deposition—especially in the hippocampus—was further confirmed by pathologic analysis (Figure 4C). Compared with non-treated APP/PS1 mice, DCBEI suppressed the induction of phospho-Tau (p-Tau) in the hippocampus (Figure 4D), but had no effect on the levels of total Tau (Figure 4E). DCBEI strongly reduced the levels of 4 Hydroxynonenal (4-HNE), a key mediator of oxidative stress-induced damage, in the hippocampus (Figure 4F). DCBEI also significantly reduced the amount of TUNEL-positive apoptotic neurons in the brains of APP/PS1 mice (Figure 4G). DCBEI did not induce significant gross pathology in the brain, spleen or kidney (Supplementary Figure 2), suggesting that it could be used safely.
The regulation of DCBE on neurotransmitters of APP/PS1 mice
The serum content of nine neurotransmitters including r-Amino-butyric acid (GABA), Norepinephrine (NA), 5-hydroxyindoleacetic acid (5-HIAA), serotonin (5-HT), Histamine (HIS), glutamine (Gln) and isoprenaline hydrochloride (iso-Hyd) was quantified using HPLC-MS/MS (Figure 5C and Supplementary Figure 3). Based on this initial quantification, Enzyme-linked immunosorbent assay (ELISA) was used to quantify the levels of seven of these neurotransmitters in whole brain tissues. Compared with non-treated APP/PS1 mice, DCBEI-treated mice (160 mg/kg and 320 mg/kg) showed enhanced levels of GABA (p < 0.01), iso-Hyd (p < 0.001), 5-HT (p < 0.01), NA (p < 0.001), HIS (p < 0.001) and 5-HIAA (p < 0.01) that were >71.4%, >73.9%, >63.9%, >59.3%, >7 9.0%, and >96.6%, respectively (Table 2).
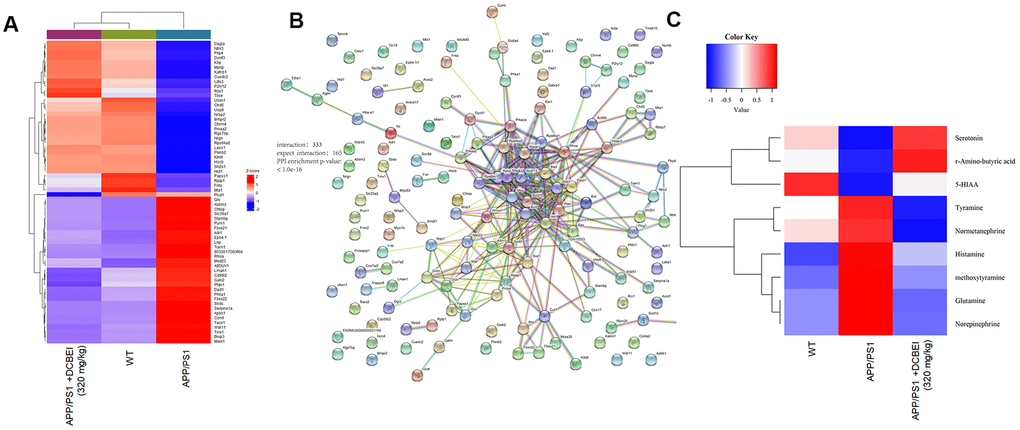
Figure 5. Proteomic and metabonomic profiling of the effects of DCBEI in APP/PS1 mice. (A) Heat map of differentially expressed factors (n = 3). (B) The relationship between proteins processed through STRINGdb. (C) Serum neurotransmitter levels were quantified using HPLC-MS/MS. Significant differences in the levels of nine neurotransmitters (R-amino-butyric acid, norepinephrine, 5-HIAA, serotonin, methoxytyramine, histamine, tyramine, glutamine and normetanephrine) was observed (n = 3).
Table 2. The effects of DCBEI on the levels of neurotransmitters in hippocampus of APP/PS1 mice.
| WT | APP/PS1 | APP/PS1 | |||||||||||||||||||||||||||||||||||||||||||||||||||||||||||||||||||||||||||||||||||||||||||||||||
| DCBEI (mg/kg) | |||||||||||||||||||||||||||||||||||||||||||||||||||||||||||||||||||||||||||||||||||||||||||||||||||
| 160 | 320 | ||||||||||||||||||||||||||||||||||||||||||||||||||||||||||||||||||||||||||||||||||||||||||||||||||
| Ach (×10-2) (pmoL/mgprot) | 1.7±0.2 | 1.3±0.2# | 2.2±0.4* | 2.1±0.5* | |||||||||||||||||||||||||||||||||||||||||||||||||||||||||||||||||||||||||||||||||||||||||||||||
| AChE (×10-2) (nmoL/mgprot) | 6.1±0.9 | 8.2±0.9# | 7.6±0.5 | 7.8±1.2 | |||||||||||||||||||||||||||||||||||||||||||||||||||||||||||||||||||||||||||||||||||||||||||||||
| ChAT (×10-2) (pmoL/mgprot) | 2.3±0.2 | 2.4±0.4 | 2.6±0.5 | 5.9±0.6** | |||||||||||||||||||||||||||||||||||||||||||||||||||||||||||||||||||||||||||||||||||||||||||||||
| Gln (μmol/mgprot) | 0.5±0.2 | 0.8±0.2# | 0.6±0.1 | 0.7±0.2 | |||||||||||||||||||||||||||||||||||||||||||||||||||||||||||||||||||||||||||||||||||||||||||||||
| GABA (×10-3, μmol/mgprot) | 3.1±0.5 | 2.4±0.4# | 4.1±0.7** | 4.5±0.8*** | |||||||||||||||||||||||||||||||||||||||||||||||||||||||||||||||||||||||||||||||||||||||||||||||
| iso-Hyd (μg/mgprot) | 657.7±118.2 | 492.8±87.8## | 871.1±139.0*** | 988.8±198.5*** | |||||||||||||||||||||||||||||||||||||||||||||||||||||||||||||||||||||||||||||||||||||||||||||||
| 5-HT (ng/mgprot) | 114.0±10.6 | 90.1±16.1## | 151.9±22.2*** | 181.4±57.9** | |||||||||||||||||||||||||||||||||||||||||||||||||||||||||||||||||||||||||||||||||||||||||||||||
| NA (ng/mgprot) | 3.6±0.5 | 2.4±0.3### | 3.8±0.5** | 4.5±0.7*** | |||||||||||||||||||||||||||||||||||||||||||||||||||||||||||||||||||||||||||||||||||||||||||||||
| HIS (ng/mgprot) | 7.1±0.4 | 5.4±0.8## | 9.7±1.4*** | 10.9±1.2*** | |||||||||||||||||||||||||||||||||||||||||||||||||||||||||||||||||||||||||||||||||||||||||||||||
| 5-HIAA (ng/mgprot) | 9.9±2 | 7.6±1.1# | 15.0±2.1*** | 18.2±5.3** | |||||||||||||||||||||||||||||||||||||||||||||||||||||||||||||||||||||||||||||||||||||||||||||||
| All date is expressed as mean ± S.D. (n=10). #P < 0.05, ##P < 0.01 and ###P < 0.001 compared with WT group; *P < 0.05, **P < 0.01 and ***P < 0.001 compared with APP/PS1 group. | |||||||||||||||||||||||||||||||||||||||||||||||||||||||||||||||||||||||||||||||||||||||||||||||||||
The regulation of DCBEI on Nuclear factor-erythroid 2 related factor 2 (Nrf-2) signaling
Proteomics revealed that 362 proteins were differentially expressed between WT and APP/PS1 mice, and 309 proteins were differentially expressed between DCBEI-treated and untreated APP/PS1 mice (Supplementary Figure 4). After applying cut-off values of A/B > 1.5 or A/B < 0.66, we observed that 64 proteins were differentially expressed following DCBEI treatment (32 were upregulated and 32 were downregulated; Figure 5A). Gene Ontology analysis indicated an enrichment of mitochondrial proteins, suggesting that DCBEI-mediated neuroprotection is linked to the regulation of apoptosis and oxidative stress (Supplementary Figure 5). We next used STRINGdb to analyze interactions between proteins that were differentially expressed between experimental groups; this revealed 333 enriched interactions and 165 expected interactions (Figure 5B).
Liquid chromatograph-mass spectrometer/mass spectrometer (LC-MS/MS) analysis revealed changes in the levels of anti- and pro-oxidative factors in the serum and hippocampus of APP/PS1 mice. Compared with vehicle-treated APP/PS1 mice, DCBEI-treated mice showed increased concentration of catalase (CAT, p < 0.05) and reduced levels of ROS (p < 0.05) in the serum and hippocampus, enhanced levels of glutathione peroxidase (GSH-Px, p < 0.05) and superoxide dismutase (SOD, p < 0.05) in the hippocampus, and reduced levels of malondialdehyde (MDA, p < 0.05) in the serum (Table 3). The effect was particularly striking at the highest DCBEI dose (320 mg/kg).
Table 3. The effects of DCBEI on the levels of oxidative stress related factors in serum and hippocampus of APP/PS1 mice.
| WT | APP/PS1 | APP/PS1 | |||||||||||||||||||||||||||||||||||||||||||||||||||||||||||||||||||||||||||||||||||||||||||||||||
| DCBEI (mg/kg) | |||||||||||||||||||||||||||||||||||||||||||||||||||||||||||||||||||||||||||||||||||||||||||||||||||
| 160 | 320 | ||||||||||||||||||||||||||||||||||||||||||||||||||||||||||||||||||||||||||||||||||||||||||||||||||
| SOD (pg/mL) | 50.3±1.98 | 41.3±1.1 | 42.0±3.3 | 42.8±2.9 | |||||||||||||||||||||||||||||||||||||||||||||||||||||||||||||||||||||||||||||||||||||||||||||||
| Serum | MDA (pmoL/mL) | 1.9±0.15 | 2.6±0.3# | 1.9±0.2* | 2.0±0.2* | ||||||||||||||||||||||||||||||||||||||||||||||||||||||||||||||||||||||||||||||||||||||||||||||
| CAT (pg/mL) | 28.7±1.3 | 25.2±1.2 | 26.7±1.9 | 31.4±2.7* | |||||||||||||||||||||||||||||||||||||||||||||||||||||||||||||||||||||||||||||||||||||||||||||||
| GSH-Px (pg/mL) | 89.9±6.6 | 83.3±5.8 | 88.5±10.6 | 82.6±8.8 | |||||||||||||||||||||||||||||||||||||||||||||||||||||||||||||||||||||||||||||||||||||||||||||||
| ROS (U/mL) | 387.2±19.7 | 438.0±13.4# | 384.8±12.7* | 394.5±25.7* | |||||||||||||||||||||||||||||||||||||||||||||||||||||||||||||||||||||||||||||||||||||||||||||||
| Hippocampus | SOD (pg/mgprot) | 18.3±2.6 | 13.6±1.2# | 17.1±1.6* | 17.9±1.6* | ||||||||||||||||||||||||||||||||||||||||||||||||||||||||||||||||||||||||||||||||||||||||||||||
| MDA (×10-2, pmoL/mgprot) | 36.8±2.7 | 44.4±2.7 | 44.3±7.3 | 44.2±3.1 | |||||||||||||||||||||||||||||||||||||||||||||||||||||||||||||||||||||||||||||||||||||||||||||||
| CAT (pg/mgprot) | 9.5±1.39 | 7.6±0.733# | 8.5±0.9* | 9.4±1.2* | |||||||||||||||||||||||||||||||||||||||||||||||||||||||||||||||||||||||||||||||||||||||||||||||
| GSH-Px (pg/mgprot) | 34.9±3.0 | 34.2±2.8 | 42.4±3.4* | 39.0±3.9* | |||||||||||||||||||||||||||||||||||||||||||||||||||||||||||||||||||||||||||||||||||||||||||||||
| ROS (U/mgprot) | 133.6±9.4 | 136.7±8.3 | 106.9±12.8* | 106.2±11.2* | |||||||||||||||||||||||||||||||||||||||||||||||||||||||||||||||||||||||||||||||||||||||||||||||
| All date is expressed as mean ± S.D. (n=10). #P < 0.05 compared with WT group; *P < 0.05 compared with APP/PS1 group. | |||||||||||||||||||||||||||||||||||||||||||||||||||||||||||||||||||||||||||||||||||||||||||||||||||
Following L-Glu exposure, Nrf-2 and its downstream targets (including HO-1, SOD-1, SOD-2, GCLC, GCLM and NQO1) were downregulated, whereas C-Maf and PKC were upregulated. These effects were reversed by a 3-h preincubation with DCBEI (Figure 6A). Compared with cells treated with only L-Glu, those pre-treated with DCBEI showed enhanced phosphorylation of AKT and mTOR and reduced phosphorylation of JNK, PTEN and P38 (Figure 6B). Additionally, DCBEI increased the levels of nuclear CytoC and the nuclear translocation of Nrf-2 and phospho-ERK in L-Glu-treated HT22 cells (Figure 6C).
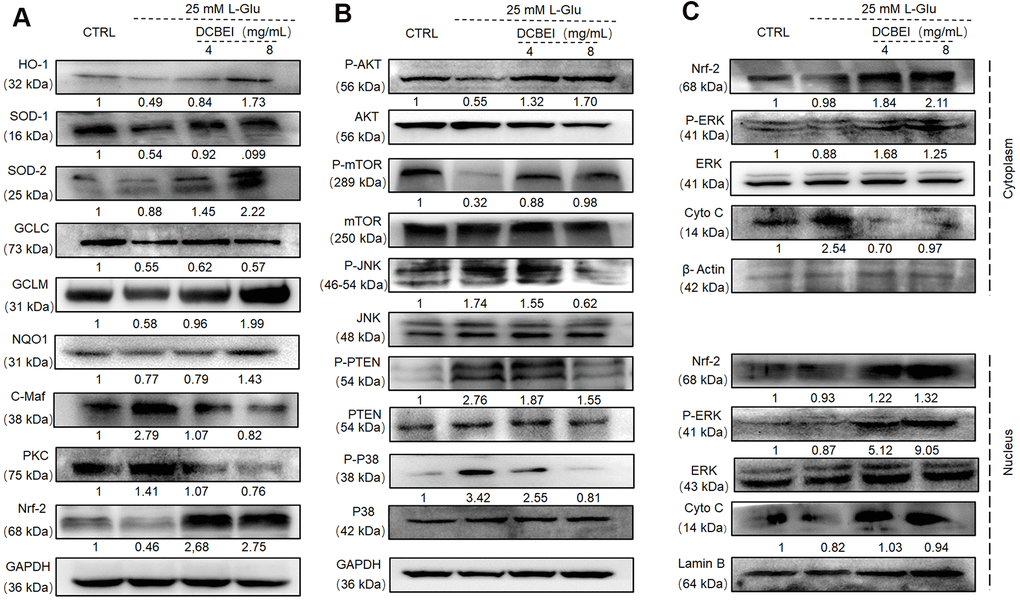
Figure 6. DCBEI ameliorates AD symptoms by reducing apoptosis, attenuating oxidative stress, and regulating neurotransmitter levels via Nrf2 signaling. (A) In L-Glu-exposed HT22 cells, DCBEI increased the expression of Nrf-2 and its downstream targets including HO-1, SOD-1, SOD-2, GCLC, GCLM and NQO1, and reduced the expression levels of C-Maf. (B) Analysis of MAPKs and Akt in L-Glu-treated HT22 cells. DCBEI increased the expression of p-AKT and p-mTOR, and reduced the expression of p-JNK, p-PTEN and p-P38 in L-Glu-treated HT22 cells. (C) DCBEI increases p-ERK levels and causes a redistribution of p-ERK, Nrf-2, and Cyto C from the cytoplasm to the nucleus. Quantification data were normalized to GAPDH and the corresponding total proteins, and are reported as fold change relative to CTRL (n = 3).
Discussion
DCBEI, which is derived from fresh calf blood via deproteinization, ultrafiltration and incrassation, has been used in Chinese clinics (SFDA approval NO. H20060121) for several years. In the present study, we found that DCBEI contains 17 amino acids, 5 nucleotides and abundant levels of ribose, which confirms its high nutritional content. The diverse components of DCBEI not only explain its non-dose-dependent effects in most of our experiments, but also suggests that it is safe to use. The latter point was also confirmed by our pathological examinations.
When hypoxia or ischemia occurs in the brain, a large amount of Glu is released, which in turn triggers the mobilization of intracellular Ca2+ and continuous excitation of neurons [18]. In AD, excitotoxicity due to hyperstimulation with Glu is the ultimate step prior to the onset of neuronal necrosis and apoptosis [19]. The onset of AD pathology further reduces the ability of nerve cells to absorb Glu because it leads to decreased expression of the Glu transporter (excitatory amino acid transporter); this vicious cycle exacerbates excitotoxicity [20]. Our data clearly show that in HT22 cells, DCBEI attenuates this process.
In neurodegenerative diseases, increased mitochondrial damage is a major feature of Glu-induced neurotoxicity [21]. Mitochondrial damage leads to impaired redox, reduced ATP synthesis and increased apoptosis. Excessive L-Glu stimulates the postsynaptic Glu receptor, causing Ca2+ influx through N-methyl-D-aspartic acid (NMDA) receptor channels, which in turn activate the opening of mitochondrial permeability transition pores [18, 22]. Pore opening triggers excessive production of reactive metabolites, such as ROS, which further perturb mitochondrial function and Mitochondrial membrane potential (MMP) dissipation via the modulation of ATP-sensitive potassium channels [23]. Phosphorylated RSK1 p90 can inhibit ROS activity and thereby suppress oxidative stress [24]. Pro- and anti-apoptotic Bcl-2 family members regulate the permeability of the mitochondrial membrane by activation or inhibition of the inner mitochondrial permeability transition channels, respectively [25]. Excitotoxic stimuli also cause the release of Ca2+, which can activate Calpain-1, a pro-apoptotic factor that acts within mitochondria [26]. The phosphorylation of Drp1 is linked to mitochondrial fragmentation and is an early marker of apoptosis [27]. Excessive ROS activates JNK and P38 kinases, which are mediators of pro-apoptotic signaling; these kinases trigger Bax accumulation and thereby sensitize cells to apoptosis. Meanwhile, ROS inhibit AKT activation by promoting the phosphatase activity of PTEN, which leads to impaired mitochondrial biosynthesis [28]. AKT activity stabilizes Nrf-2, a transcription factor that upregulates antioxidant genes and thus promotes normal mitochondrial function [29]. Consistent with the key role of antioxidants in suppressing neurotoxicity, we observed that DCBEI pretreatment promoted mitochondrial function by inhibiting oxidative stress.
Due to the obvious learning and memory dysfunction and increased accumulation of Aβ that are observed in the APP/PS1 double transgenic mice, this strain has been widely used in AD pathophysiology studies [30]. The blood-brain barrier, which strictly regulates Glu transport in non-affected individuals, is compromised in AD patients, which leads to increased brain Glu concentration [31]. The development of oxidative stress, which plays a key role in AD pathogenesis and occurs early in the course of AD onset, is related to the deposition of Aβ plaques [32]. High levels of Aβ1–40 and Aβ1–42 are associated with high levels of oxidation products in the hippocampus of AD patients [33], and Aβ and ROS synergize in a feedback loop that leads to mitochondrial dysfunction and apoptosis. Furthermore, the excessive deposition of Aβ results in deposition of Tau protein, which forms the neurofibrillary tangles that cause memory deficits and synaptic degeneration [32]. Notably, our in vitro experiments revealed that DCBEI can inhibit Aβ1-42-induced apoptosis. Apparently, DCBEI is neuroprotective in APP/PS1 mice because it inhibits the deposition of Aβ and Tau in the hippocampus; this in turn reduces the severity of AD-like behavior in these animals. High levels of the oxidative stress biomarker 4-HNE are present in areas of the hippocampus with high Aβ deposition [32]. The accumulation of ROS and MDA can disrupt the activities of SOD and GSH-Px, which are endogenous antioxidants that promote the removal of oxygen free radicals, and of CAT, which is a key ROS buffer [34]. The reduced Nrf-2 activity that was observed in the AD hippocampus is likely to explain the downregulation of important antioxidant enzymes (such as SOD and GSH-Px) in this brain compartment. The increased oxidative stress in AD tissue engenders an abnormal accumulation of Aβ and P-Tau, thereby creating a vicious circle [29]. Following DCBEI treatment, 4-HNE levels fell concomitantly with a drop in ROS levels in the brains of APP/PS1 mice. This translated to a reduction in the amount of apoptosis in hippocampal neurons. The interactions between neurotransmitters during hippocampal neurogenesis can affect individual emotions and behaviors, and can contribute to the risk of developing neurodegenerative disease [35]. Neuronal absorption of glutamine activates the “Glu-glutamine cycle”, which is closely linked to the levels of the inhibitory neurotransmitter GABA [36, 37]. Indeed, the neuronal hyperexcitability observed in some AD patients may be due to extremely low levels of GABA [38]. The activity of 5-HT, which is directly and indirectly regulated by other neurotransmitters including Glu and GABA, has an impact on short- and long-term memory; both these cognitive functions are strongly suppressed in AD patients [39]. NA can improve cognitive function and reduce anxiety in AD patients via attenuating Aβ1-42 cytotoxicity [40]. Increased HIS is associated with the release of acetylcholine (Ach) in the cerebral cortex, which is in turn linked to enhanced memory and learning capability in experimental animals [52]. Consistent with this finding, there is evidence of decreased HIS in the brains of AD patients. Attenuated cholinergic function in AD patients is associated with impaired memory function and cognitive decline [41]. Additionally, several neurotransmitters (including HIS) can stimulate oxidative stress by enhancing the release of ROS [42].
ROS-triggered oxidative stress activates JNK and P38 [43]. In contrast, activated Nrf-2 signaling reduces oxidative stress and thus relieves the cognitive impairment that is induced by amyloid pathology [44]. Consistent with the role of nuclear Nrf-2 in regulating amyloid-induced pathology, its levels in the hippocampus of AD mice are low [29]. In L-Glu-treated HT22 cells, DCBEI stimulated the biological activity of Nrf-2 by promoting its nuclear translocation. Nrf-2 is a positive regulator of Akt and mTOR, which act together to negatively regulate PTEN, protect mitochondria, and improve cell survival [29, 45]. According to a previous study, some of the neuroprotective effects of neurotransmitters are Nrf-2-dependent [46].
The current study has one limitation. Although DCBEI has been approved by the SFDA for clinical use in China, we were unable to identify the specific constituent that was responsible for the neuroprotective effects of this biopharmaceutical.
In conclusion, DCBEI relieves AD symptoms by promoting an Nrf-2-dependent antioxidative response, which in turn prevents mitochondrial apoptosis. Our findings provide the experimental support for the use of DCBEI as adjuvant therapy to treat AD.
Materials and Methods
Analysis of DCBEI composition
As described in previous studies [47–50], we determined the molecular weight distribution and the nucleotide and ribose contents of Deproteinized Calf Blood Extractive Injection (DCBEI)(CAS: 20160803; obtained from Jilin Connell Pharmaceutical Co. LTD., Jilin, China) samples using high-performance liquid chromatography (HPLC) (E2695, Waters Co., Ltd., USA) systems and gel permeation chromatography (1515, Waters Co., Ltd., USA).
DCBEI was hydrolyzed by the addition of 6 mol/L of hydrochloric acid at 110° C for 24 h, and then dried under vacuum. Deionized water was added to prepare DCBEI test samples and amino acid standards. Seventeen distinct free amino acids were detected using the HPLC system as described in a previous study [51].
Cell culture
HT22, a mouse hippocampal neuronal cell line (BNCC-337709) (Chinese Academy of Sciences Cell Bank, Shanghai, China), and U251, a human astroglioma cell line (No. BNCC337874), were cultured in Dulbecco’s Modified Eagle’s Media (Gibco, USA) containing 10% fetal bovine serum (Gibco, USA) supplemented with 100 units/mL penicillin and 100 μg/mL streptomycin (Invitrogen, USA) under a humidified atmosphere containing 5%/95% CO2/air at 37° C.
Cell viability and caspase activity analyses
HT22 cells (6 × 10³ cells/100 μL) were seeded into 96-well plates, pre-treated with DCBEI at doses of 1 mg/mL to 8 mg/mL for 3 h, and then treated with L-Glu (25 mM) for another 24 h.
U251 cells (6 × 10³ cells/100 μL) were seeded into 96-well plates, pre-treated with DCBEI at doses of 1 mg/mL to 8 mg/mL for 3 h, and then treated with Aβ1-42 (10 μM) (purity ≥ 95%, Gill Biochemical Co., Ltd., Shanghai, China) for another 24 h [52].
A cell viability assay using 3-(4,5-dimethylthiazol-2-yl)-2,5-diphenyltetrazolium bromide (MTT) was performed as described in our previous study [53].
HT22 cells (3 × 10⁵ cells/mL) were seeded into 6-well plates, pre-treated with 4 mL or 8 mL of DCBEI for 3 h, and then treated with L-Glu (25 mM) for another 24 h. The activities of Caspase-3/7 (APT423), -8 (APT408) and -9 (APT409) were analyzed using commercial kits (Millipore, Billerica, MA, USA) according to the manufacturer’s instructions.
Quantification of apoptosis and ROS activities via flow cytometry
HT22 cells (3 × 10⁵ cells/mL) were seeded into 6-well plates, pre-treated with DCBEI at doses of 4 mL and 8 mL for 3 h, and then treated with L-Glu (25 mM) for another 24 h.
U251 cells (3 × 10⁵ cells/mL) were seeded into 6-well plates, pre-treated with 4 mL or 8 mL of DCBEI for 3 h, and then treated with Aβ1-42 (10 μM) for another 24 h.
Cells were collected and stained with reagents of the Dead Cell Kit (MCH100105, Millipore, Billerica, MA, USA) and Oxidative Stress Kit (MCH100111, Millipore, Billerica, MA, USA) at 37° C in the dark for 15 min. Fluorescence intensity, as an indicator of apoptosis and ROS activity, was measured using a Muse™ Cell Analyzer (Millipore, Billerica, MA, USA).
Assessment of the dissipation of MMP, and intracellular levels of ROS and Ca2+
HT22 cells (1 × 10⁵ cells/mL) were seeded into 6-well plates, pre-treated with 4 mL or 8 mL of DCBEI for 3 h, and then treated with L-Glu (25 mM) for another 24 h.
Treated cells were stained with 10 μM of 2,7-dichlorofluorescein diacetate (DCFH-DA; Nanjing Jiancheng Bioengineering Institute, Nanjing, China), 5 μM of Fluo-4-AM (Molecular Probes, USA), or 2 μmol/L of 5,5′,6,6′-Tetrachloro-1,1′,3,3′-tetraethylbenzimidazolylcarbocyanine iodide (JC-1, Millipore, Billerica, MA, USA) for 20 min at room temperature in the dark. Intracellular ROS and Ca2+ levels, which were indirectly reported by the green fluorescence, and the degree of MMP l, which was reported by the ratio of red/green fluorescence, were quantified using a Nikon TE2000 fluorescence microscope with a CCD camera (Japan) (200×).
Western blot
HT22 cells were seeded into 6-well plates (3 × 10⁵ cells/well), pre-treated with 4 mL or 8 mL of DCBEI for 3 h, and then treated with L-Glu (25 mM) for another 24 h. The concentration of protein in cell lysates was measured using BCA protein assay kit (Millipore, Billerica, MA, USA). Sodium dodecyl sulfate polyacrylamide gel electrophoresis (10–12%) was used to separate the protein lysates (40 μg), which were transferred to polyvinylidene difluoride membranes (0.45 μm, Merck Millipore, Billerica, MA, USA). The membranes were blotted with 5% bovine serum albumin (Sigma, USA) at 4° C for 4 h, and then incubated with primary antibodies (Supplementary Table 1) at 4° C for 12 h. After washing with Tris-buffered saline-Tween-20 buffer, the membranes were incubated with horseradish peroxidase (HRP)-conjugated secondary antibody [anti-mouse (IH-0031) and anti-rabbit (IH-0011)] (Dingguo, Beijing, China) at 4° C for 4 h. An ECL kit (WBKLS0500, Millipore, Billerica, MA, USA) was used to visualize the protein bands, and the intensity of the bands was analyzed using ImageJ software (National Institutes of Health, Bethesda, MD, USA).
Animal husbandry and drug treatment
The experiment was conducted with the approval of the Institution Animal Ethics Committee of Jilin University (License No. SY0604). Forty-five B6C3-Tg (APPswePSEN1dE9)/Nju double transgenic male mice [Genotype: (Appswe)T, (Psen1) T] (APP/PS1) (8 months old, 45–50 g) and 15 wild-type male mice [Genotype: (Appswe)W, (Psen1) W] (WT) (8 months old, 45–50 g) were purchased from Nanjing Biomedical Research Institute of Nanjing University, Jiangsu, China [SCXK (SU) 2015-0001]. All mice were raised in a room held at 23 ± 2° C with a humidity of 40–60% under a 12-h:12-h light/dark cycle; the animals were given access to water and food ad libitum.
APP/PS1 mice were randomly assigned to three groups (n = 15/group), and received an intraperitoneal injection of DCBEI (160 mg/kg and 320 mg/kg), or an equivalent volume of saline for 28 days. After the last behavioral test, the mice were euthanized by injection with 150 mg/kg of 1.5% pentobarbital solution. The serum together with tissues of the brain, spleen and kidney were collected for biochemical and pathological analyses.
Behavioral tests
Morris water maze experiment test
The long-term spatial memory and learning capabilities of mice were evaluated using the Morris water maze [54]. After 5 days of training, mice were put into the MT-200 Water Labyrinth Video Tracking Analysis System (S7200) with a circular pool (122 cm diameter, 62.5 cm deep) filled with water to a depth of 40 cm (24 ± 2° C) containing titanium dioxide; this pool was higher than the platform. The amount of time spent searching the platform over a 60-s period and the movement trajectory were recorded by a video camera.
Open field experiment test
An open field test was used to evaluate the autonomic activities, exploration behaviors, and anxiety behaviors of experimental animals when placed in new environments [54]. The open field test apparatus (50 cm long × 50 cm wide × 50 cm deep) was protected with an isolator, and divided into a central area (25 cm long × 25 cm wide) and a surrounding area. The movements of mice were recorded for 5 min, and their trajectory was analyzed by software (Any-maze™, Stoelting Co., Chicago, IL, USA). The apparatus was cleaned between successive mice to ensure that no information from the preceding animal was present.
Immunohistochemistry examination
Paraffin sections of tissues were deparaffinized in xylene, rehydrated in different concentrations of ethanol, and washed twice in phosphate-buffered saline solution (PBS). The tissue slides were heated with citrate buffer for 15 min to retrieve antigens, incubated with hydrogen peroxide for 12 min at room temperature to block endogenous peroxidase, and then blocked with 5% normal horse serum and 1% normal goat serum dissolved in PBS. The slides were then incubated with anti-amyloid precursor (Aβ) antibody (1:500 dilution; ab32136), anti-Tau antibody (1:750 dilution; ab32057), anti-phospho-Tau (ser404) (1:200 dilution; ab 92676) and anti-4-HNE antibody (1:200 dilution; ab46545) (Abcam, Cambridge, MA, USA) at 25° C for 1 h. The slides were stained with 3,3′-diaminobenzidine and Mayer’s hematoxylin and visualized and photographed using a microscope (40× and 200×; IX73, Olympus, Tokyo, Japan).
TUNEL assay
Brain tissue sections were deparaffinized at 37° C, and then exposed to permeabilization reagent (Proteinase K solution) for 15 min. Sections of mouse hippocampus were labelled with the Click-it™ Plus TUNEL assay kit (C10617, Invitrogen, USA) according to the manufacturer’s instructions. The slides were stained with 3,3′-diaminobenzidine and apoptosis was then quantified using a microscope (200×; IX73, Olympus, Tokyo, Japan).
LC-MS/MS analysis of serum neurotransmitters
Based on previous studies [55, 56], 100 μL of serum from each mouse was homogenized in 400 μL ice cold methanol (Sigma Aldrich Fluka, USA)/acetonitrile (ACN; Merck, GER) (V:V = 1:1) with 1% formic acid (Merck, GER), and the mixture was incubated for 60 min at 37° C until a liquid supernatant was obtained. After vacuum drying, the precipitate of liquid supernatant was dissolved in ACN/water (1:1, v/v) with 1% FA.
The concentrations of NA, 5-HT, and 5-HIAA, Glu, GABA, Gln, HIS, normetanephrine, tyramine and methoxytyramine were quantified using an integrated HPLC-MS/MS system. All standards were purchased from Sigma-Aldrich (USA).
Label-free quantification (LFQ) analysis of proteins in the brains
Preparation of protein samples
The brain tissue samples were homogenized in RIPA buffer containing protease inhibitor cocktail (Kangchen Bio-tech, Shanghai, China) and 1 mM Phenylmethylsulfonyl fluoride (PMSF), followed by 1 min of sonication. Samples were then centrifuged and the supernatant containing the whole tissue extract was retained. Protein concentration was determined using a BCA assay. Sample preparation was based on previous studies [57], and all samples were processed simultaneously. Samples were analyzed using LC-MS/MS.
LC-MS/MS analysis
For each sample, 2 μg of peptide was separated and analyzed with a Nano-HPLC (EASY-nLC1200) coupled to a Q-Exactive mass spectrometer (Thermo Finnigan). The separation conditions used were the same as those reported in a previous study.
Data-dependent acquisition (DDA) was performed in the profile and positive modes with an Orbitrap analyzer under the same conditions as those used in a previous study [57].
MaxQuant database search and protein quantification
Raw MS files were processed with MaxQuant (Version 1.5.6.0). LFQ was performed using a label-free, intensity-based absolute quantification approach.
Significant differences in protein levels were defined for proteins with different expression multiples (ratio A/B > 1.5 or ratio A/B < 0.66). Subsequently, we performed Gene Ontology (GO) and Kyoto Encyclopedia of Genes and Genomes (KEGG) pathway analyses, as well as protein-protein interaction analysis.
ELISA
The levels of Ach (E20535), acetylcholine esterase (AchE, E2148), choline acetyltransferase (ChAT, E21422), Gln (E92310M), GABA (E20434M), iso-Hyd (E20542M), 5-HT (E20435M), NA (E91467M), HIS (E20452M) and 5-HIAA (E91494M) in the hippocampus were measured using the relevant ELISA kits according to the corresponding manufacturer’s instructions. The levels of Aβ1-42 (E20118), MDA (E20347M), CAT (E21414), SOD (E20348M), ROS (E20634) and GSH-Px (E20584) in the hippocampus and serum were measured using the relevant ELISA kits according to the corresponding manufacturer’s instructions (Shanghai Yuanye Biological Technology Co. Ltd., Shanghai, China).
Statistical analysis
Data are expressed as the mean ± standard deviation (S.D.). Differences were determined by one-way analysis of variance followed by post-hoc multiple comparisons (Dunn’s test) using SPSS 16.0 software (IBM Corporation, Armonk, USA). Statistical significance was declared for p-values less than 0.05.
Author Contributions
Study concept and design: DW and YZZ; the experiment operates: YDQ, WQW, TRC, YMY; acquisition of data: YDQ, WQW, TRC, YMY; analysis and interpretation of data: YDQ, WQW, TRC; drafting of the manuscript: YDQ, DW; critical addition of important intellectual content to the manuscript: DW and YZZ. All authors approved the final version of the manuscript.
Conflicts of Interest
The authors declare no conflicts of interest.
Funding
This study was supported by the Science and Technology Develop Project in Jilin Province of China (20200201122JC and 20200201030JC) and the Special Projects of Cooperation between Jilin University and Jilin Province in China (XGJSFKT2020-1).
References
- 1. Meilin S, Machicao F, Elmlinger M. Treatment with actovegin improves spatial learning and memory in rats following transient forebrain ischaemia. J Cell Mol Med. 2014; 18:1623–30. https://doi.org/10.1111/jcmm.12297 [PubMed]
- 2. Elmlinger MW, Kriebel M, Ziegler D. Neuroprotective and anti-oxidative effects of the hemodialysate actovegin on primary rat neurons in vitro. Neuromolecular Med. 2011; 13:266–74. https://doi.org/10.1007/s12017-011-8157-7 [PubMed]
- 3. Chhetri JK, Chan P, Vellas B, Touchon J, Gauthier S. Report from the first clinical trials on Alzheimer’s disease (CTAD) Asia-China 2018 : bringing together global leaders. J Prev Alzheimers Dis. 2019; 6:144–47. https://doi.org/10.14283/jpad.2019.2 [PubMed]
- 4. He Z, Guo JL, McBride JD, Narasimhan S, Kim H, Changolkar L, Zhang B, Gathagan RJ, Yue C, Dengler C, Stieber A, Nitla M, Coulter DA, et al. Amyloid-β plaques enhance Alzheimer’s brain tau-seeded pathologies by facilitating neuritic plaque tau aggregation. Nat Med. 2018; 24:29–38. https://doi.org/10.1038/nm.4443 [PubMed]
- 5. Butterfield DA, Lauderback CM. Lipid peroxidation and protein oxidation in Alzheimer’s disease brain: potential causes and consequences involving amyloid beta-peptide-associated free radical oxidative stress. Free Radic Biol Med. 2002; 32:1050–60. https://doi.org/10.1016/s0891-5849(02)00794-3 [PubMed]
- 6. Reddy PH, McWeeney S, Park BS, Manczak M, Gutala RV, Partovi D, Jung Y, Yau V, Searles R, Mori M, Quinn J. Gene expression profiles of transcripts in amyloid precursor protein transgenic mice: up-regulation of mitochondrial metabolism and apoptotic genes is an early cellular change in Alzheimer’s disease. Hum Mol Genet. 2004; 13:1225–40. https://doi.org/10.1093/hmg/ddh140 [PubMed]
- 7. Lustbader JW, Cirilli M, Lin C, Xu HW, Takuma K, Wang N, Caspersen C, Chen X, Pollak S, Chaney M, Trinchese F, Liu S, Gunn-Moore F, et al. ABAD directly links abeta to mitochondrial toxicity in Alzheimer’s disease. Science. 2004; 304:448–52. https://doi.org/10.1126/science.1091230 [PubMed]
- 8. Kagan BL, Hirakura Y, Azimov R, Azimova R, Lin MC. The channel hypothesis of Alzheimer’s disease: current status. Peptides. 2002; 23:1311–15. https://doi.org/10.1016/s0196-9781(02)00067-0 [PubMed]
- 9. Seeley WW, Crawford RK, Zhou J, Miller BL, Greicius MD. Neurodegenerative diseases target large-scale human brain networks. Neuron. 2009; 62:42–52. https://doi.org/10.1016/j.neuron.2009.03.024 [PubMed]
- 10. Jiang S, Zhao Y, Zhang T, Lan J, Yang J, Yuan L, Zhang Q, Pan K, Zhang K. Galantamine inhibits β-amyloid-induced cytostatic autophagy in PC12 cells through decreasing ROS production. Cell Prolif. 2018; 51:e12427. https://doi.org/10.1111/cpr.12427 [PubMed]
- 11. Kim JY, Lee HK, Jang JY, Yoo JK, Seong YH. Ilex latifolia prevents amyloid β protein (25-35)-induced memory impairment by inhibiting apoptosis and tau phosphorylation in mice. J Med Food. 2015; 18:1317–26. https://doi.org/10.1089/jmf.2015.3443 [PubMed]
- 12. Fujiwara T, Morimoto K. A compound CP-31398 suppresses excitotoxicity-induced neurodegeneration. Biochem Biophys Res Commun. 2013; 440:359–63. https://doi.org/10.1016/j.bbrc.2013.08.052 [PubMed]
- 13. Lee SY, Ahn SM, Wang Z, Choi YW, Shin HK, Choi BT. Neuroprotective effects of 2,3,5,4'-tetrahydoxystilbene-2-O-β-D-glucoside from polygonum multiflorum against glutamate-induced oxidative toxicity in HT22 cells. J Ethnopharmacol. 2017; 195:64–70. https://doi.org/10.1016/j.jep.2016.12.001 [PubMed]
- 14. Scott HA, Gebhardt FM, Mitrovic AD, Vandenberg RJ, Dodd PR. Glutamate transporter variants reduce glutamate uptake in Alzheimer’s disease. Neurobiol Aging. 2011; 32:553.e1–11. https://doi.org/10.1016/j.neurobiolaging.2010.03.008 [PubMed]
- 15. Elphick LM, Hawat M, Toms NJ, Meinander A, Mikhailov A, Eriksson JE, Kass GE. Opposing roles for caspase and calpain death proteases in L-glutamate-induced oxidative neurotoxicity. Toxicol Appl Pharmacol. 2008; 232:258–67. https://doi.org/10.1016/j.taap.2008.07.008 [PubMed]
- 16. Guillot-Sestier MV, Doty KR, Gate D, Rodriguez J
Jr , Leung BP, Rezai-Zadeh K, Town T. Il10 deficiency rebalances innate immunity to mitigate Alzheimer-like pathology. Neuron. 2015; 85:534–48. https://doi.org/10.1016/j.neuron.2014.12.068 [PubMed] - 17. Griciuc A, Serrano-Pozo A, Parrado AR, Lesinski AN, Asselin CN, Mullin K, Hooli B, Choi SH, Hyman BT, Tanzi RE. Alzheimer’s disease risk gene CD33 inhibits microglial uptake of amyloid beta. Neuron. 2013; 78:631–43. https://doi.org/10.1016/j.neuron.2013.04.014 [PubMed]
- 18. Young KW, Piñon LG, Bampton ET, Nicotera P. Different pathways lead to mitochondrial fragmentation during apoptotic and excitotoxic cell death in primary neurons. J Biochem Mol Toxicol. 2010; 24:335–41. https://doi.org/10.1002/jbt.20343 [PubMed]
- 19. Hascup KN, Hascup ER. Altered neurotransmission prior to cognitive decline in AβPP/PS1 mice, a model of Alzheimer’s disease. J Alzheimers Dis. 2015; 44:771–76. https://doi.org/10.3233/JAD-142160 [PubMed]
- 20. Schallier A, Smolders I, Van Dam D, Loyens E, De Deyn PP, Michotte A, Michotte Y, Massie A. Region- and age-specific changes in glutamate transport in the AβPP23 mouse model for Alzheimer’s disease. J Alzheimers Dis. 2011; 24:287–300. https://doi.org/10.3233/JAD-2011-101005 [PubMed]
- 21. Atlante A, Calissano P, Bobba A, Giannattasio S, Marra E, Passarella S. Glutamate neurotoxicity, oxidative stress and mitochondria. FEBS Lett. 2001; 497:1–5. https://doi.org/10.1016/s0014-5793(01)02437-1 [PubMed]
- 22. Giacomello M, Drago I, Pizzo P, Pozzan T. Mitochondrial Ca2+ as a key regulator of cell life and death. Cell Death Differ. 2007; 14:1267–74. https://doi.org/10.1038/sj.cdd.4402147 [PubMed]
- 23. Tang XQ, Feng JQ, Chen J, Chen PX, Zhi JL, Cui Y, Guo RX, Yu HM. Protection of oxidative preconditioning against apoptosis induced by H2O2 in PC12 cells: mechanisms via MMP, ROS, and Bcl-2. Brain Res. 2005; 1057:57–64. https://doi.org/10.1016/j.brainres.2005.07.072 [PubMed]
- 24. Takata T, Tsuchiya Y, Watanabe Y. 90-kDa ribosomal S6 kinase 1 is inhibited by S-glutathionylation of its active-site cysteine residue during oxidative stress. FEBS Lett. 2013; 587:1681–86. https://doi.org/10.1016/j.febslet.2013.04.017 [PubMed]
- 25. Lukiw WJ, Bazan NG. Inflammatory, apoptotic, and survival gene signaling in Alzheimer’s disease. A review on the bioactivity of neuroprotectin D1 and apoptosis. Mol Neurobiol. 2010; 42:10–16. https://doi.org/10.1007/s12035-010-8126-4 [PubMed]
- 26. Kling A, Jantos K, Mack H, Hornberger W, Drescher K, Nimmrich V, Relo A, Wicke K, Hutchins CW, Lao Y, Marsh K, Moeller A. Discovery of novel and highly selective inhibitors of calpain for the treatment of Alzheimer’s disease: 2-(3-phenyl-1H-pyrazol-1-yl)-nicotinamides. J Med Chem. 2017; 60:7123–38. https://doi.org/10.1021/acs.jmedchem.7b00731 [PubMed]
- 27. Kandimalla R, Reddy PH. Multiple faces of dynamin-related protein 1 and its role in Alzheimer’s disease pathogenesis. Biochim Biophys Acta. 2016; 1862:814–28. https://doi.org/10.1016/j.bbadis.2015.12.018 [PubMed]
- 28. Zhang J, Wang X, Vikash V, Ye Q, Wu D, Liu Y, Dong W. ROS and ROS-mediated cellular signaling. Oxid Med Cell Longev. 2016; 2016:4350965. https://doi.org/10.1155/2016/4350965 [PubMed]
- 29. Fão L, Mota SI, Rego AC. Shaping the Nrf2-ARE-related pathways in Alzheimer’s and Parkinson’s diseases. Ageing Res Rev. 2019; 54:100942. https://doi.org/10.1016/j.arr.2019.100942 [PubMed]
- 30. James SA, Churches QI, de Jonge MD, Birchall IE, Streltsov V, McColl G, Adlard PA, Hare DJ. Iron, Copper, and Zinc Concentration in Aβ Plaques in the APP/PS1 Mouse Model of Alzheimer's Disease Correlates with Metal Levels in the Surrounding Neuropil. ACS Chem Neurosci. 2017; 8:629–37. https://doi.org/10.1021/acschemneuro.6b00362 [PubMed]
- 31. Lin R, Li L, Zhang Y, Huang S, Chen S, Shi J, Zhuo P, Jin H, Li Z, Liu W, Wang Z, Chen L, Tao J. Electroacupuncture ameliorate learning and memory by improving N-acetylaspartate and glutamate metabolism in APP/PS1 mice. Biol Res. 2018; 51:21. https://doi.org/10.1186/s40659-018-0166-7 [PubMed]
- 32. Cheignon C, Tomas M, Bonnefont-Rousselot D, Faller P, Hureau C, Collin F. Oxidative stress and the amyloid beta peptide in Alzheimer’s disease. Redox Biol. 2018; 14:450–64. https://doi.org/10.1016/j.redox.2017.10.014 [PubMed]
- 33. Wang X, Wang W, Li L, Perry G, Lee HG, Zhu X. Oxidative stress and mitochondrial dysfunction in Alzheimer’s disease. Biochim Biophys Acta. 2014; 1842:1240–47. https://doi.org/10.1016/j.bbadis.2013.10.015 [PubMed]
- 34. Qu Z, Zhang J, Yang H, Huo L, Gao J, Chen H, Gao W. Protective effect of tetrahydropalmatine against d-galactose induced memory impairment in rat. Physiol Behav. 2016; 154:114–25. https://doi.org/10.1016/j.physbeh.2015.11.016 [PubMed]
- 35. Wojnicz A, Avendaño Ortiz J, Casas AI, Freitas AE, López MG, Ruiz-Nuño A. Simultaneous determination of 8 neurotransmitters and their metabolite levels in rat brain using liquid chromatography in tandem with mass spectrometry: application to the murine Nrf2 model of depression. Clin Chim Acta. 2016; 453:174–81. https://doi.org/10.1016/j.cca.2015.12.023 [PubMed]
- 36. Cabrera-Pastor A, Arenas YM, Taoro-Gonzalez L, Montoliu C, Felipo V. Chronic hyperammonemia alters extracellular glutamate, glutamine and GABA and membrane expression of their transporters in rat cerebellum. Modulation by extracellular cGMP. Neuropharmacology. 2019; 161:107496. https://doi.org/10.1016/j.neuropharm.2019.01.011 [PubMed]
- 37. Huang F, Li J, Shi HL, Wang TT, Muhtar W, Du M, Zhang BB, Wu H, Yang L, Hu ZB, Wu XJ. Simultaneous quantification of seven hippocampal neurotransmitters in depression mice by LC-MS/MS. J Neurosci Methods. 2014; 229:8–14. https://doi.org/10.1016/j.jneumeth.2014.04.004 [PubMed]
- 38. Solas M, Puerta E, Ramirez MJ. Treatment options in Alzheimer’s disease: the GABA story. Curr Pharm Des. 2015; 21:4960–71. https://doi.org/10.2174/1381612821666150914121149 [PubMed]
- 39. Zhang Y, Pi Z, Song F, Liu Z. Ginsenosides attenuate d-galactose- and AlCl3-inducedspatial memory impairment by restoring the dysfunction of the neurotransmitter systems in the rat model of Alzheimer’s disease. J Ethnopharmacol. 2016; 194:188–95. https://doi.org/10.1016/j.jep.2016.09.007 [PubMed]
- 40. Ponnusamy R, McNerney MW, Moghadam S, Salehi A. Assessing disease-modifying effects of norepinephrine in Down syndrome and Alzheimer’s disease. Brain Res. 2019; 1702:3–11. https://doi.org/10.1016/j.brainres.2017.09.035 [PubMed]
- 41. Ferreira-Vieira TH, Guimaraes IM, Silva FR, Ribeiro FM. Alzheimer’s disease: targeting the cholinergic system. Curr Neuropharmacol. 2016; 14:101–15. https://doi.org/10.2174/1570159x13666150716165726 [PubMed]
- 42. Zlomuzica A, Dere D, Binder S, De Souza Silva MA, Huston JP, Dere E. Neuronal histamine and cognitive symptoms in Alzheimer’s disease. Neuropharmacology. 2016; 106:135–45. https://doi.org/10.1016/j.neuropharm.2015.05.007 [PubMed]
- 43. Wang C, Li J, Liu Q, Yang R, Zhang JH, Cao YP, Sun XJ. Hydrogen-rich saline reduces oxidative stress and inflammation by inhibit of JNK and NF-κB activation in a rat model of amyloid-beta-induced Alzheimer’s disease. Neurosci Lett. 2011; 491:127–32. https://doi.org/10.1016/j.neulet.2011.01.022 [PubMed]
- 44. Tian Y, Wang W, Xu L, Li H, Wei Y, Wu Q, Jia J. Activation of Nrf2/ARE pathway alleviates the cognitive deficits in PS1V97L-Tg mouse model of Alzheimer’s disease through modulation of oxidative stress. J Neurosci Res. 2019; 97:492–505. https://doi.org/10.1002/jnr.24357 [PubMed]
- 45. Murata H, Takamatsu H, Liu S, Kataoka K, Huh NH, Sakaguchi M. NRF2 regulates PINK1 expression under oxidative stress conditions. PLoS One. 2015; 10:e0142438. https://doi.org/10.1371/journal.pone.0142438 [PubMed]
- 46. Jhang KA, Lee EO, Kim HS, Chong YH. Norepinephrine provides short-term neuroprotection against Aβ1-42 by reducing oxidative stress independent of Nrf2 activation. Neurobiol Aging. 2014; 35:2465–73. https://doi.org/10.1016/j.neurobiolaging.2014.05.020 [PubMed]
- 47. Xing H, Lu M, Xian L, Zhang J, Yang T, Yang L, Ding P. Molecular weight determination of a newly synthesized guanidinylated disulfide-containing poly(amido amine) by gel permeation chromatography. Asian J Pharm Sci. 2017; 12:292–98. https://doi.org/10.1016/j.ajps.2016.11.001 [PubMed]
- 48. Phat C, Moon B, Lee C. Evaluation of umami taste in mushroom extracts by chemical analysis, sensory evaluation, and an electronic tongue system. Food Chem. 2016; 192:1068–77. https://doi.org/10.1016/j.foodchem.2015.07.113 [PubMed]
- 49. Kochanowski N, Blanchard F, Cacan R, Chirat F, Guedon E, Marc A, Goergen JL. Intracellular nucleotide and nucleotide sugar contents of cultured CHO cells determined by a fast, sensitive, and high-resolution ion-pair RP-HPLC. Anal Biochem. 2006; 348:243–51. https://doi.org/10.1016/j.ab.2005.10.027 [PubMed]
- 50. Park HC, Kim YJ, Lee CW, Rho YT, Kang J, Lee DH, Seong YJ, Park YC, Lee D, Kim SG. Production of D-ribose by metabolically engineered Escherichia coli. Process Biochem. 2017; 52:73–77. https://doi.org/10.1016/j.procbio.2016.10.001
- 51. Shafaei A, Halim NH, Zakaria N, Ismail Z. Analysis of free amino acids in different extracts of Orthosiphon stamineus leaves by high-performance liquid chromatography combined with solid-phase extraction. Pharmacogn Mag. 2017 (Suppl 3); 13:S385–91. https://doi.org/10.4103/0973-1296.216337 [PubMed]
- 52. Wang C, Hao J, Liu X, Li C, Yuan X, Lee RJ, Bai T, Wang D. Isoforsythiaside attenuates Alzheimer’s disease via regulating mitochondrial function through the PI3K/AKT pathway. Int J Mol Sci. 2020; 21:5687. https://doi.org/10.3390/ijms21165687 [PubMed]
- 53. Hu S, Wang D, Zhang J, Du M, Cheng Y, Liu Y, Zhang N, Wang D, Wu Y. Mitochondria related pathway is essential for polysaccharides purified from sparassis crispa mediated neuro-protection against glutamate-induced toxicity in differentiated PC12 cells. Int J Mol Sci. 2016; 17:133. https://doi.org/10.3390/ijms17020133 [PubMed]
- 54. Zhang Y, Wang J, Wang C, Li Z, Liu X, Zhang J, Lu J, Wang D. Pharmacological basis for the use of evodiamine in Alzheimer’s disease: antioxidation and antiapoptosis. Int J Mol Sci. 2018; 19:1527. https://doi.org/10.3390/ijms19051527 [PubMed]
- 55. Liu Z, Tu MJ, Zhang C, Jilek JL, Zhang QY, Yu AM. A reliable LC-MS/MS method for the quantification of natural amino acids in mouse plasma: method validation and application to a study on amino acid dynamics during hepatocellular carcinoma progression. J Chromatogr B Analyt Technol Biomed Life Sci. 2019; 1124:72–81. https://doi.org/10.1016/j.jchromb.2019.05.039 [PubMed]
- 56. Hammad LA, Neely M, Bridge B, Mechref Y. Fast liquid chromatography separation and multiple-reaction monitoring mass spectrometric detection of neurotransmitters. J Sep Sci. 2009; 32:2369–76. https://doi.org/10.1002/jssc.200900158 [PubMed]
- 57. Wang C, Tang Y, Wang Y, Li G, Wang L, Li Y. Label-free quantitative proteomics identifies Smarca4 is involved in vascular calcification. Ren Fail. 2019; 41:220–28. https://doi.org/10.1080/0886022X.2019.1591997 [PubMed]