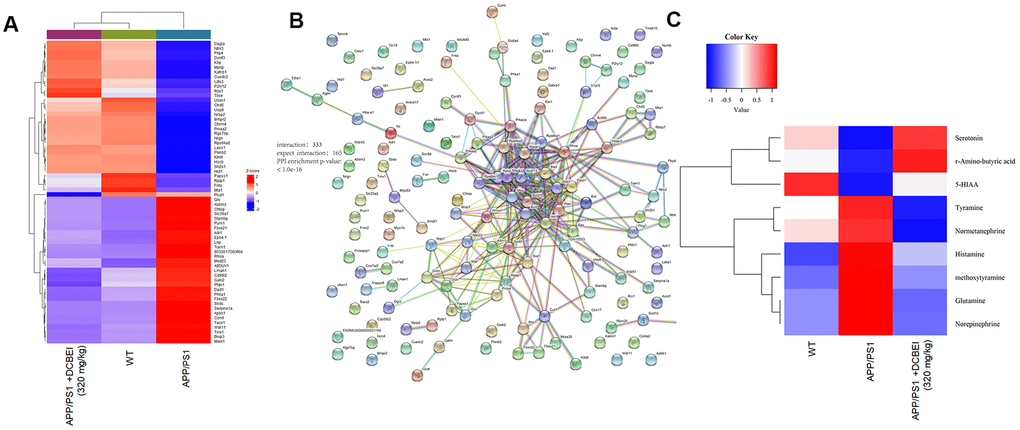
Figure 5.Proteomic and metabonomic profiling of the effects of DCBEI in APP/PS1 mice. (A) Heat map of differentially expressed factors (n = 3). (B) The relationship between proteins processed through STRINGdb. (C) Serum neurotransmitter levels were quantified using HPLC-MS/MS. Significant differences in the levels of nine neurotransmitters (R-amino-butyric acid, norepinephrine, 5-HIAA, serotonin, methoxytyramine, histamine, tyramine, glutamine and normetanephrine) was observed (n = 3).