


Introduction
According to the 2020 Colorectal Cancer Statistics, in the United States, colorectal cancer (CRC) is the second most common cause of cancer death [1]. The early symptoms of CRC are not obvious. As cancer grows, bowel habits change, including blood in the stool, diarrhea, alternating diarrhea and constipation, and local abdominal pain [2].
The latest report points out that the age of onset of CRC is getting younger, with the median age dropping from 72 years in 2001-2002 to 66 years in 2015-2016. However, new cases are still predominantly middle-aged and elderly, accounting for 88% of new diagnostic CRC patients in the United States in 2020. After age stratification, for people over 55 years old, the incidence rate increases by about 30% for each increase of 5 years old [1].
Population aging is a typical feature of many developed countries. The association between aging and cancer is becoming more and more apparent [3]. Aging is an important biological process and a general feature of biological organisms. The major manifestations of aging are the gradual loss of function or degeneration at the molecular, cellular, tissue and body levels [4]. Aging is an essential risk factor for cancer, as well. One of the characteristics of aging is hyperplasia, the most serious of which are cancers. Besides, cancer, like other aging-related diseases, mostly begins at the midpoint of life [5]. Identifying the key features of senescence and induction of senescence in cancer cells has been considered in anti-cancer research [6]. Impaired antitumor immunity is a typical example of immune aging [7]. Immune-related risk signature [8], hypoxia-related signature [9], autophagy score signature [10] and somatic mutation signatures [11] have been constructed to predict the overall survival (OS) of CRC patients. However, the aging-related risk signature to predict the survival of CRC patients has never been built.
In this study, based on the Gene Set Enrichment Analysis (GSEA), we found that the aging-related gene sets, GO_AGING, GO_CELL_AGING and GO_CELLULAR_SENESCENCE, were activated significantly in CRC tissues. Next, we extracted 49 aging-related gene sets at the Molecular Signatures Database v7.1, from which we collected 1693 aging-related genes shared by the training group TCGA and testing group GSE39582. In the TCGA data set, we mined 258 differentially expressed aging-related genes and 26 prognostic aging-related genes. Based on the LASSO regression analysis, the 15-gene-aging-related risk signature was constructed, significantly associated with the OS of CRC patients in both the training and testing groups. Survival analysis stratified by age, gender, American Joint Committee on Cancer (AJCC) stage, tumor size in situ (T), lymph node metastasis (N) and distant metastasis (M), clarified the stability and independence of aging-related risk signature. Univariate and multivariate COX regression analysis further confirmed that our risk signature was an independent prognostic factor. At the same time, the Receiver Operating Characteristic (ROC) curve demonstrated the accuracy of this risk signature. The aging-related risk score was significantly increased in the advanced stage, T, N and M and positively correlated with the degree of 5 types of immune cell infiltration. The 15 aging-related genes included in the signature were named hub genes. We further investigated the mutation and copy number alteration (CNA) of these hub genes at the DNA level. At the GeneMANIA website, we mined functionally similar genes of hub genes and constructed a protein-protein interaction network. Functional enrichment showed that these hub genes and functionally similar genes were mainly involved in platelet alpha granule and regulation of endopeptidase activity, consistent with results in plasma proteomic signature of age in healthy humans. In terms of hallmark gene sets and KEGG gene sets, we performed the gene set enrichment analysis (GSEA) between high- and low-risk groups to understand our risk signature’s molecular mechanisms and pathways.
In conclusion, the aging-related risk signature can predict the OS, severity and immune cell infiltration of CRC patients. 15 hub genes are expected to become novel therapeutic targets in the future.
Results
Compared with normal mucosa, the aging process of cells was activated significantly in colorectal cancer
In vertebrates, aging leads to degenerative and proliferative pathological changes, the most fatal of which was cancer. Based on 3 independent data sets, TCGA, GSE39582, GSE87211 (Table 1), we conducted the Gene Set Enrichment Analysis (GSEA) on the gene sets of "GO_AGING, GO_CELL_AGING and GO_CELLULAR_SENESCENCE" and found that the aging-related gene sets were significantly activated in colorectal cancer (CRC) tissues compared with normal tissues (Figure 1). The above results showed that the aging process was involved in the development of CRC and suggested that aging-related signature might predict the survival of CRC patients.
Table 1. Number of samples and genes in colorectal cancer data set.
| Data sets | Numbers of genes | Normal tissues | Tumor tissues |
| TCGA | 56753 | 44 | 568 |
| GSE39582 | 21655 | 19 | 566 |
| GSE87211 | 21754 | 160 | 203 |
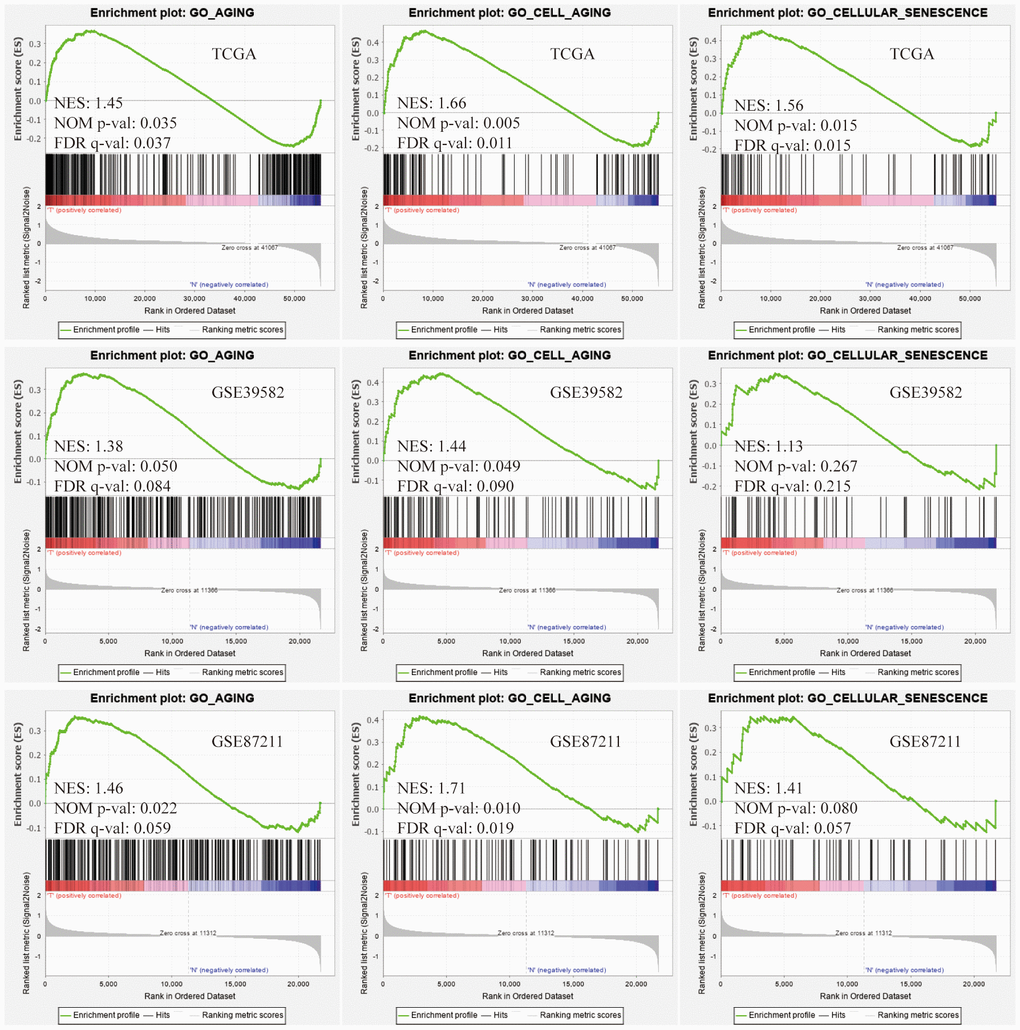
Figure 1. Gene Set Enrichment Analysis (GSEA). Three aging-related gene sets were significantly activated in colorectal cancer (CRC) tissues compared with normal tissues. The significance criteria were nominal P-value < 5% and FDR q-value<25%.
Identification of differentially expressed and prognostic aging-related genes in the training group
Based on the online Venn diagrams tool, we screened 1693 common aging-related genes in the TCGA and GSE39582 databases (Figure 2A). The former was the training group while the latter was the testing group. Among 1693 genes, we further extracted 258 differentially expressed genes in the TCGA and illustrated them in the heatmap (Figure 2B) and volcano map (Figure 2C), including 164 up-regulated and 94 down-regulated. As expected, the Gene Ontology (GO) analysis revealed that 258 differentially expressed genes were mainly involved in aging (Figure 2D). To predict the prognosis of CRC patients, among these 258 genes, 26 survival-related genes were screened and displayed in the forest plot (P <0.05), including 15 risky genes (HR > 1) and 11 protective genes (HR < 1) (Figure 2E).
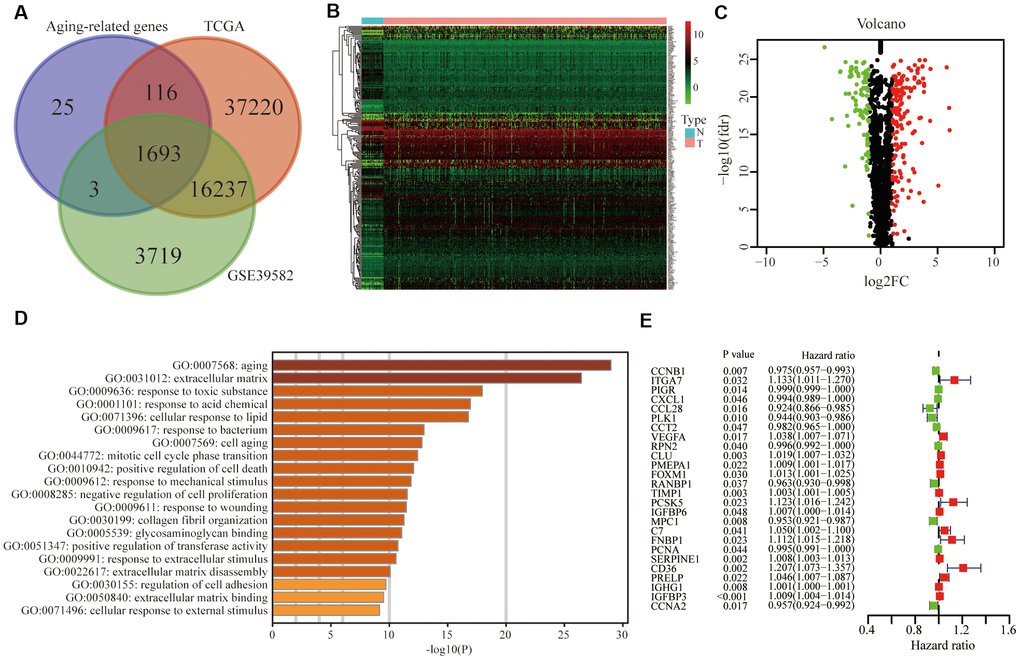
Figure 2. Identification of differentially expressed and prognostic aging-related genes in CRC. (A) Aging-related genes shared by the training group TCGA and testing group GSE39582. (B) Differentially expressed aging-related genes in the TCGA was displayed in the heatmap and (C) the volcano map. (D) Gene ontology (GO) analysis of these genes. (E) Forest plot of prognostic aging-related genes in the training group.
Protein-protein interaction and enrichment analysis among 258 aging-related genes
Based on the STRING database and Cytoscape plugin cytohubba, we constructed a protein-protein interaction (PPI) network (Figure 3A). The darker the color was, the greater the number of neighboring nodes was. The top 30 genes with the most neighboring nodes were shown in Figure 3B. Next, we performed PPI enrichment analysis at the Metascape and screened the first MCODE components, which were mainly enriched in the cell cycle (Figure 3C). On this website, the legend of the same MCODE component was shown in the same color.
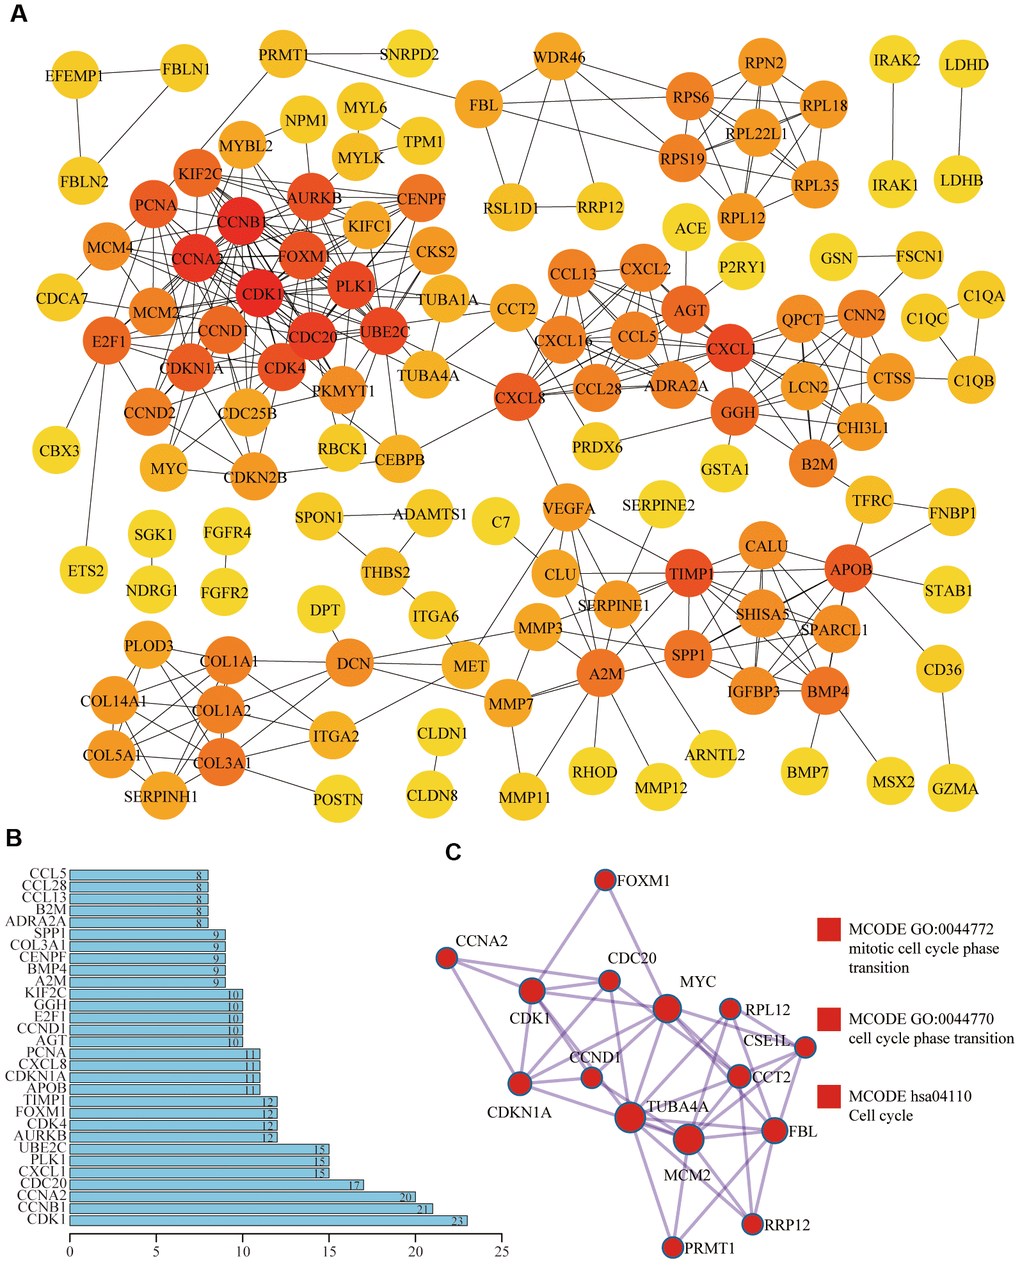
Figure 3. Protein-protein interaction (PPI) of differentially expressed aging-related genes. (A) In the PPI network, the darker the color was, the greater the number of neighboring nodes was. (B) Top 30 genes with the most neighboring nodes. (C) The first MCODE component identified in this gene list and pathway and process enrichment analysis of this MCODE component was significantly related to the cell cycle.
Development of aging-related risk signature
Based on TCGA data set, univariate COX and LASSO analysis, we established an aging-related risk signature of CRC patients. The explicit formula of aging-related risk signature was as follow: CCNB1 expression *(-0.00482) + PIGR expression *(-0.000151) + CXCL1 expression *(-0.000198) + CCL28 expression *(-0.00104) + PLK1 expression *(-0.0130) + VEGFA expression *0.0201 + RPN2 expression *(-0.00195) + CLU expression *0.00171 + FOXM1 expression *0.0117 + TIMP1 expression *0.00144 + PCSK5 expression *0.0167 + MPC1 expression *(-0.00826) +CD36 expression *0.0405 + IGHG1 expression *1.33e-05 + IGFBP3 expression *0.00373. The 15 genes included in the model were named hub genes. In terms of the training group TCGA, according to the median of the risk score, we equally divided CRC patients into 2 groups, low- and high-risk groups (Figure 4A). The number of deaths of CRC patients in the high-risk group was significantly higher than that in the low-risk group (Figure 4B). Heatmap showed the differential expression of hub genes between high- and low-risk groups (Figure 4C). We also confirmed that the overall survival (OS) of the low-risk group was significantly longer than that of the high-risk group (P<0.05) (Figure 4D).
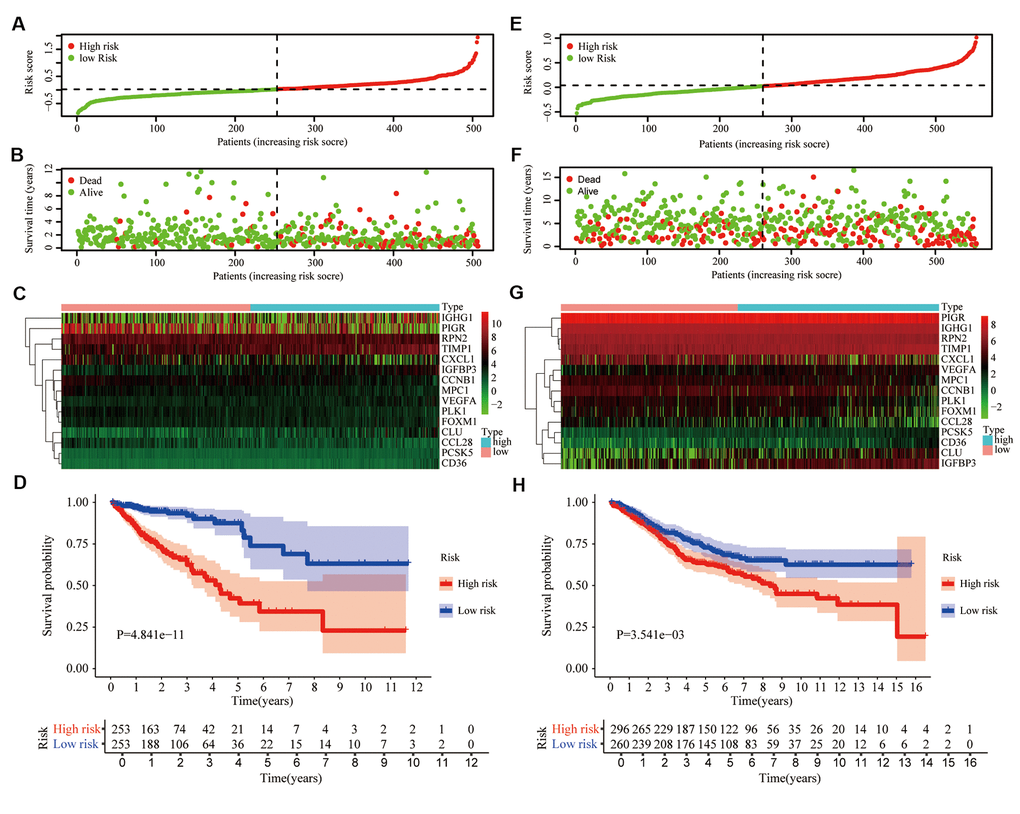
Figure 4. Prognostic signature based on 15 hub genes. (A) Distribution of groups based on the aging-related risk score. (B) The scatter plot demonstrated the differences in the survival status of CRC patients between high- and low-risk groups. (C) Heatmap showed differential expression of included 15 hub genes in both groups. (D) The overall survival (OS) of the high-risk group was significantly shorter than that of the low-risk group. (E–H) The second verification was performed in the testing group GSE39582.
To demonstrate the universality of the risk signature, based on the median of risk score in the training group TCGA, we divided CRC patients of the testing group GSE39582 into low- and high-risk groups (Figure 4E). The number of deaths of CRC patients in the high-risk group was slightly higher than that in the low-risk group (Figure 4F), and hub genes were also differentially expressed between these 2 groups (Figure 4G). Next, we draw the same conclusion that the aging-related risk signature was significantly associated with the OS of CRC patients in the testing group (P<0.05) (Figure 4H).
Validation of the aging-related risk signature
To investigate whether our aging-related risk signature was a clinically independent prognostic factor, we performed univariate independent prognostic analysis and found that our signature was an independent prognostic factor, like stage, T, N and M, in the training group (Figure 5A). Next, we conducted multivariate independent prognostic analysis and revealed that in the training group, stage and risk score were independent prognostic factors (Figure 5B). Second verification was performed in the testing group GSE39582 and we draw the same conclusions (Figure 5C, 5D). The above results suggested that the aging-related risk signature could be used to predict the survival of CRC patients. To exclude the effect of multicollinearity between stage and T, N, M, T, N and M were not included in the multivariate independent prognostic analysis.
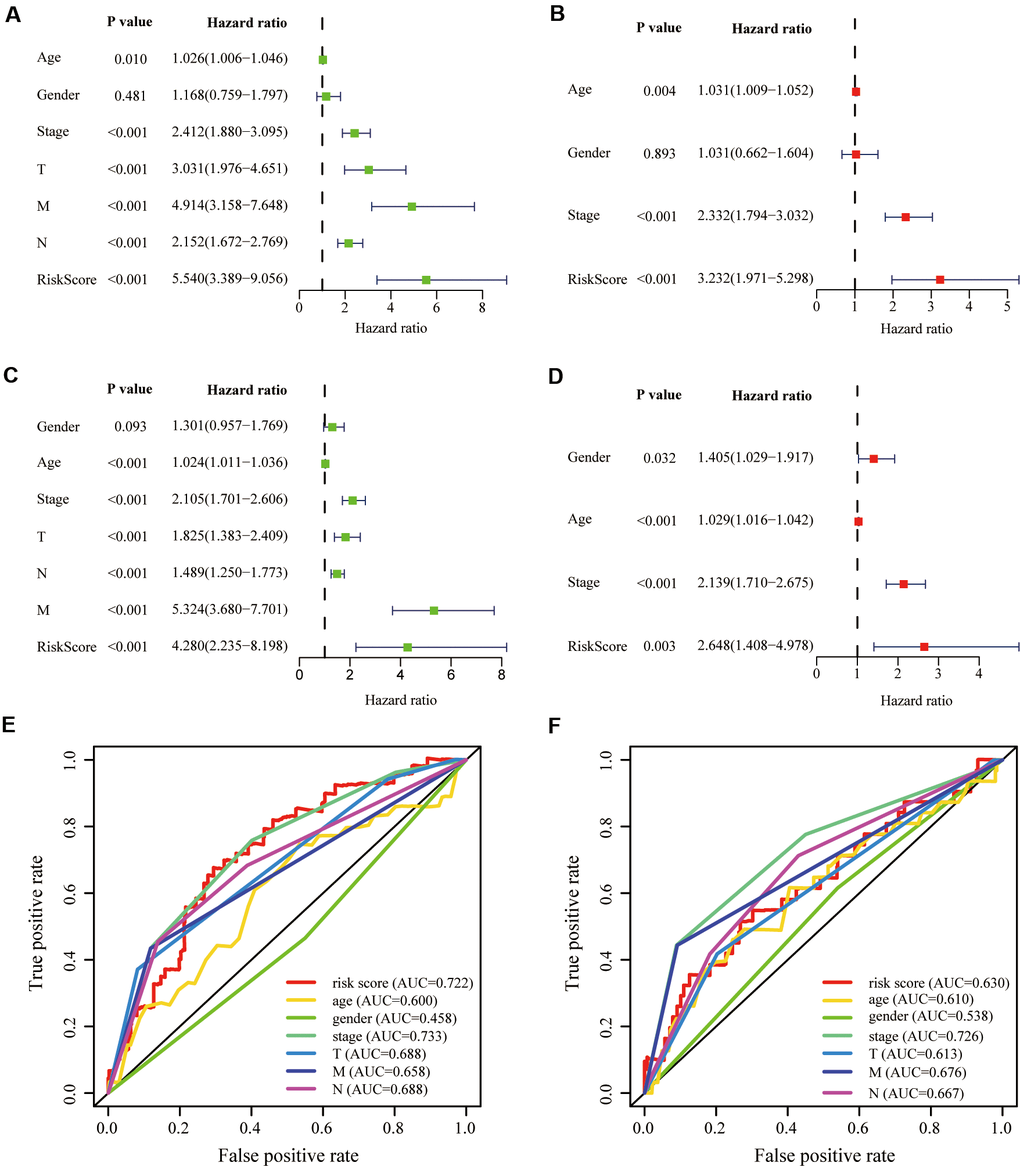
Figure 5. Validation of prognostic signature. (A, B) Univariate and multivariate COX regression analysis in the training group. (C, D) Univariate and multivariate COX regression analysis in the testing group. The receiver operating characteristic (ROC) curve and the areas under the curve verified the accuracy of prognostic signature in the (E) training and (F) testing groups.
To evaluate our signature’s prediction accuracy, we plotted the Receiver Operating Characteristic (ROC) curve and calculated the areas under the curves (AUC). Finally, we concluded that the risk score performed well in the training and testing groups, compared with T, N and M (Figure 5E, 5F).
Stratified survival assays
The clinical characteristics of the training and testing group were illustrated in Table 3. To verify our model’s stability and independence in different clinical subgroups, we performed the stratified survival analysis of 1015 CRC patients adjusted to age, gender, stage, T, N and M using the aging-related risk score. All CRC patients in the training and testing group were summarized in the stratified survival analysis. Finally, we concluded that our signature had an excellent prognosis stability. Results of stratified survival analysis were displayed in Figure 6.
Table 3. Clinical characteristics of the training group TCGA and the testing group GSE39582.
| Clinical characteristics | Number and percentage of CRC patients | ||||||||||||||||||||||||||||||||||||||||||||||||||||||||||||||||||||||||||||||||||||||||||||||||||
| TCGA (%) | GSE39582 (%) | ||||||||||||||||||||||||||||||||||||||||||||||||||||||||||||||||||||||||||||||||||||||||||||||||||
| Total | 490 | 525 | |||||||||||||||||||||||||||||||||||||||||||||||||||||||||||||||||||||||||||||||||||||||||||||||||
| Age (years) | ≤68 | 264 (53.9%) | 270 (51.4%) | ||||||||||||||||||||||||||||||||||||||||||||||||||||||||||||||||||||||||||||||||||||||||||||||||
| >68 | 226 (46.1%) | 255 (48.6%) | |||||||||||||||||||||||||||||||||||||||||||||||||||||||||||||||||||||||||||||||||||||||||||||||||
| Gender | Male | 266 (54.3%) | 285 (54.3%) | ||||||||||||||||||||||||||||||||||||||||||||||||||||||||||||||||||||||||||||||||||||||||||||||||
| Female | 224 (45.7%) | 240 (45.7%) | |||||||||||||||||||||||||||||||||||||||||||||||||||||||||||||||||||||||||||||||||||||||||||||||||
| Stage-AJCC | I&II | 277 (56.5%) | 278 (53.0%) | ||||||||||||||||||||||||||||||||||||||||||||||||||||||||||||||||||||||||||||||||||||||||||||||||
| III&IV | 213 (43.5%) | 247 (47.0%) | |||||||||||||||||||||||||||||||||||||||||||||||||||||||||||||||||||||||||||||||||||||||||||||||||
| T | T1-2 | 100 (20.4%) | 54 (10.3%) | ||||||||||||||||||||||||||||||||||||||||||||||||||||||||||||||||||||||||||||||||||||||||||||||||
| T3-4 | 390 (79.6%) | 471 (89.7%) | |||||||||||||||||||||||||||||||||||||||||||||||||||||||||||||||||||||||||||||||||||||||||||||||||
| N | N0 | 286 (58.4%) | 290 (55.2%) | ||||||||||||||||||||||||||||||||||||||||||||||||||||||||||||||||||||||||||||||||||||||||||||||||
| N1-3 | 204 (41.6%) | 235 (44.8%) | |||||||||||||||||||||||||||||||||||||||||||||||||||||||||||||||||||||||||||||||||||||||||||||||||
| M | M0 | 417 (85.1%) | 466 (88.8%) | ||||||||||||||||||||||||||||||||||||||||||||||||||||||||||||||||||||||||||||||||||||||||||||||||
| M1 | 73 (14.9%) | 59 (11.2%) | |||||||||||||||||||||||||||||||||||||||||||||||||||||||||||||||||||||||||||||||||||||||||||||||||
| *68 years old is the median age of 1,015 CRC patients in our study. | |||||||||||||||||||||||||||||||||||||||||||||||||||||||||||||||||||||||||||||||||||||||||||||||||||
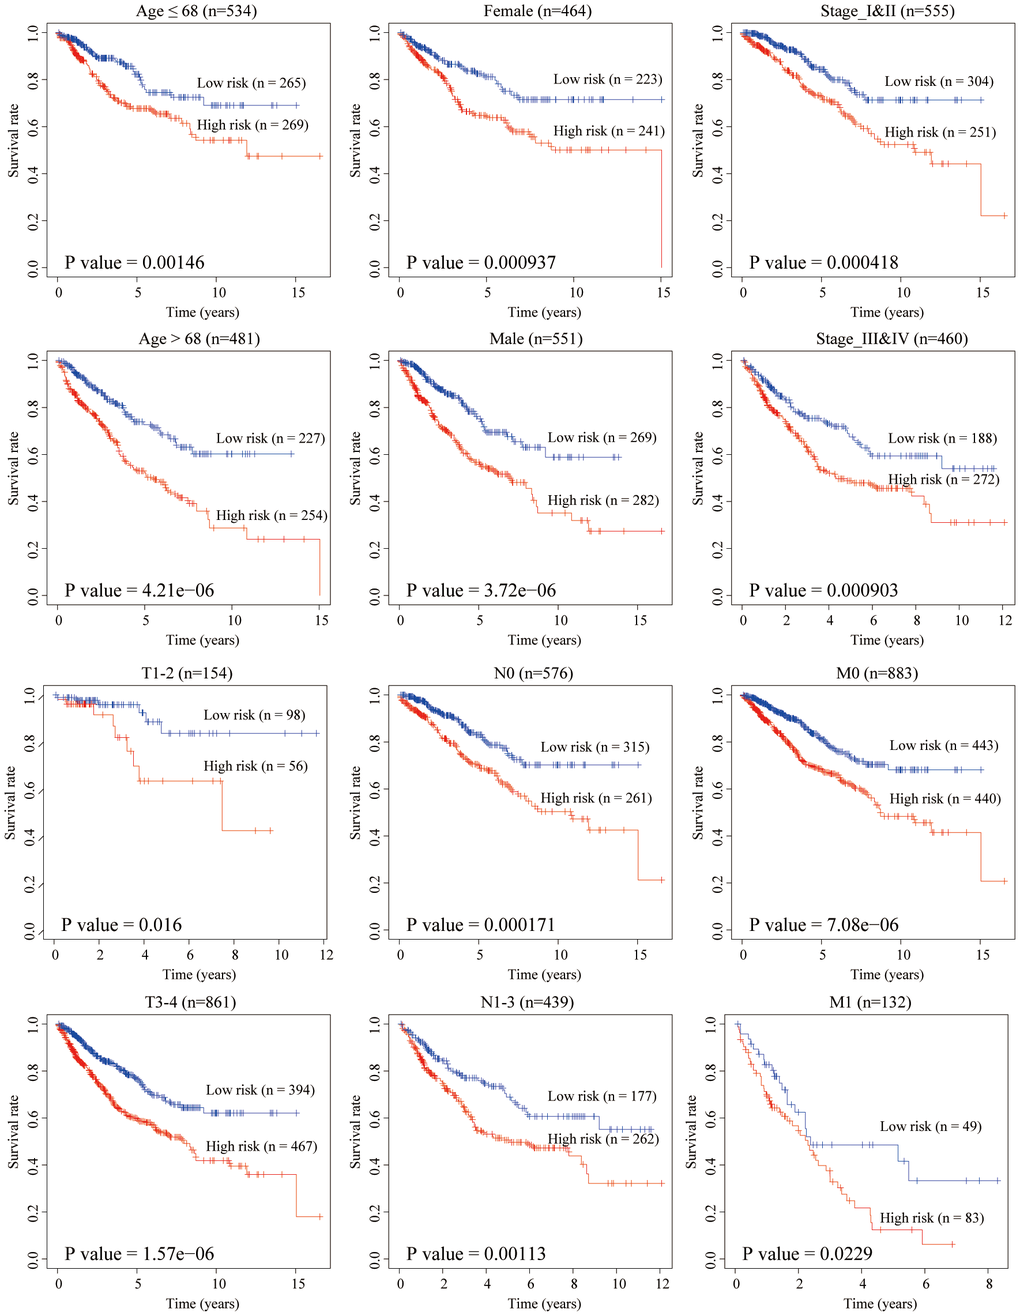
Figure 6. Stratified survival analysis adjusted to age, gender, stage, T, N and M. All CRC patients in the training and testing groups were summarized in the stratified survival analysis. 68 years old was the median age of 1,015 CRC patients.
Pearson correlation analysis between 15 hub genes
To clarify whether there was any epistasis among the 15 hub genes, by summarizing the training set and validation set data, we conducted a Pearson correlation analysis between 15 hub genes, and results showed that all the correlation coefficients were less than 0.6, which showed that the problem of gene epistasis could be ignored. The correlation diagram was shown in Supplementary Figure 1. Red and blue represented the negative correlation and positive correlation, respectively. Both values and dots size represented the Pearson correlation coefficient. * indicated the statistical difference and P-value was set to 0.05.
Clinical relevance of risk signature
In the training group, we assessed the relevance between the aging-related risk score and clinicopathological traits, including stage, T, N and M. The aging-related risk score was significantly increased in advanced stage cases (Figure 7A), advanced T stage cases (Figure 7B), positive lymph node metastasis cases (Figure 7C) and positive distant metastasis cases (Figure 7D). In the testing group, we got the same conclusion (Figure 7E). These results were consistent with the shorter OS of the high-risk group. Compared with other clinicopathological traits, we could clearly find that the P-values of 'M' were relatively less significant. The above results meant that care should be taken when judging whether CRC patients have distant metastases based on the score.
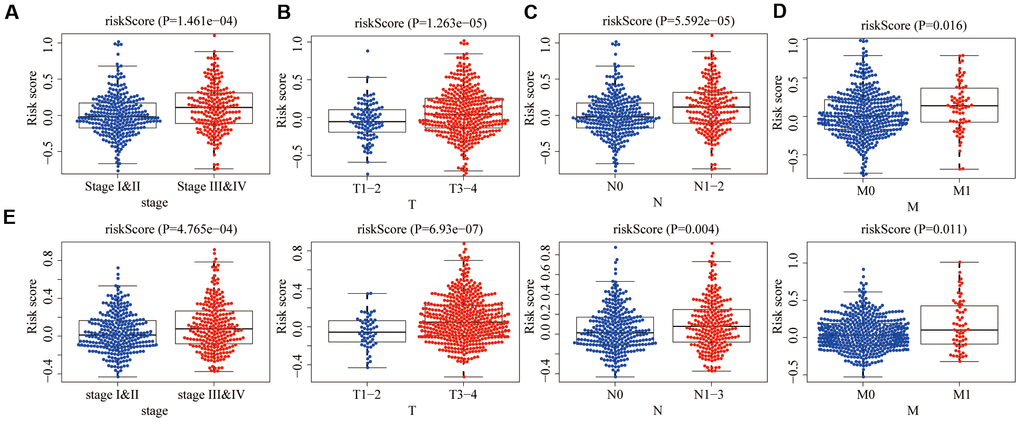
Figure 7. Relationships between risk score and clinicopathological traits. The aging risk score of (A) stage III & IV, (B) T3-4, (C) N1-3 and (D) M1 were significantly higher than that of stage I&II, T1-2, N0 and M0 in the training group (P < 0.05). (E) The same conclusion was obtained in the testing group.
Correlations with immune cell infiltration
One of aging characteristics is immune remodeling, which mainly included T cell immunosenescence and immune dysregulation. In order to determine whether this risk signature accurately reflected the immune status of the CRC tumor microenvironment, we evaluated the relationships between the infiltration of 6 types of immune cells and the aging risk score in the training group. We found that except B cells (Figure 8A), five types of immune cells, CD4+T cells (Figure 8B), CD8+T cells (Figure 8C), Neutrophils (Figure 8D), macrophages (Figure 8E) and dendritic cells (Figure 8F), were positively correlated with the aging risk score (P<0.05).
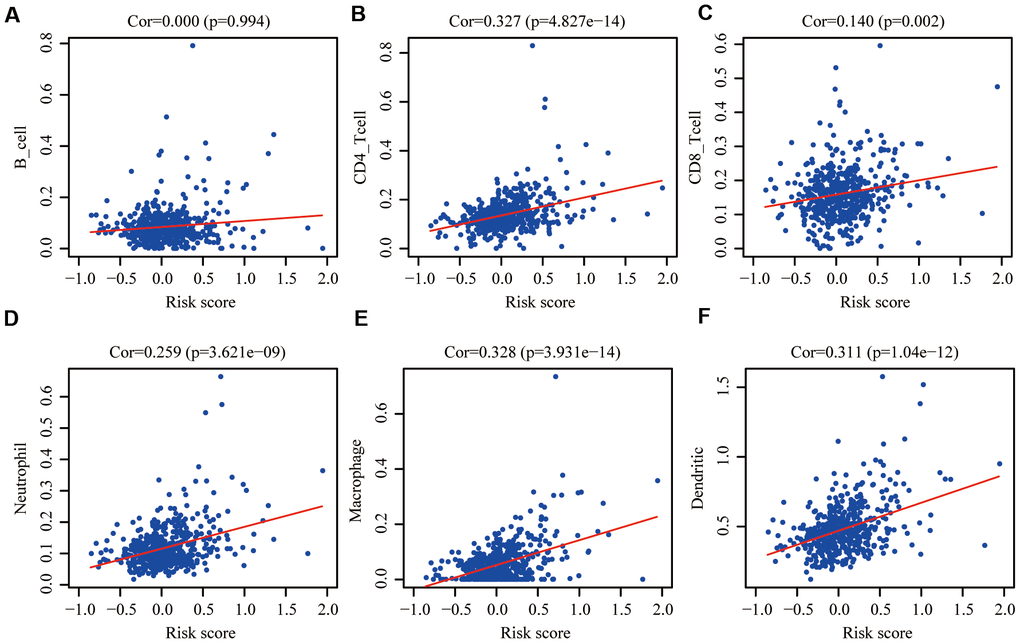
Figure 8. Pearson correlation analysis between the risk score and infiltration abundances of 6 types of immune cells in the training group. (A) B cells; (B) CD4+T cells; (C) CD8+T cells; (D) neutrophils; (E) macrophages and (F) dendritic cells. P < 0.05 was considered statistically significant.
Mutation and copy number alteration (CNA) analysis of 15 hub genes
At the cBioPortal, we found that these 15 hub genes were altered in 152 (29%) of 526 patients/samples (TCGA, PanCancer Atlas), specifically 35.71% of 56 cases with mucinous adenocarcinoma of the colon and rectum, 28.83% of 333 cases with colon adenocarcinoma patients and 26.28% of 137 cases with rectal adenocarcinoma (Figure 9A). The amplification of RPN2 and the deep deletion of CLU were the most frequent CNA among these 15 hub genes (frequency >5%), while there was no amplification or deep deletion changes in IGHG1 (Figure 9B).
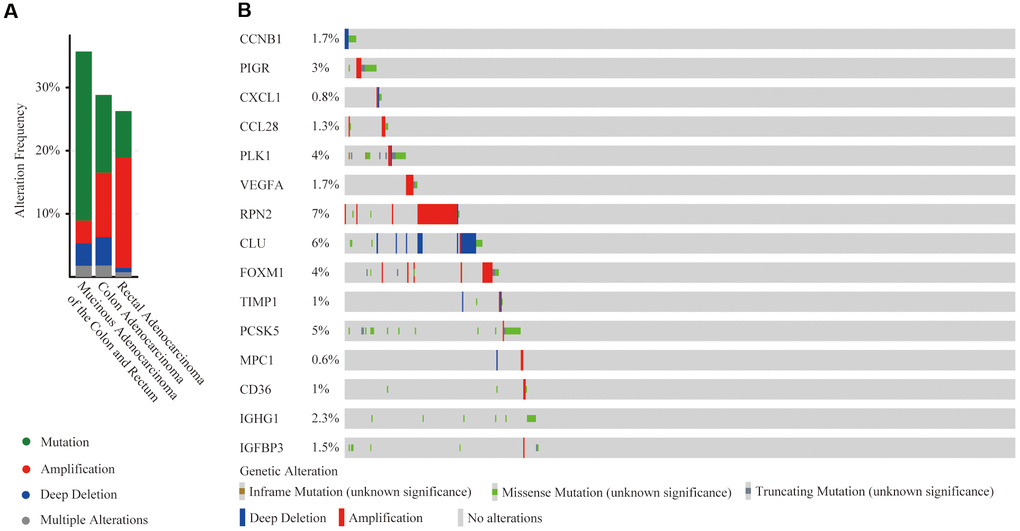
Figure 9. Mutation and copy number alteration (CNA) analysis of hub genes. (A) Frequency of mutation and CNA in hub genes in 3 types of CRC patients; (B) Mutation and CNA of each hub gene.
Protein-protein interactions (PPI) of hub genes at the GeneMANIA
The GeneMANIA is used to predict functionally similar genes of hub genes. We obtained 20 similar genes of hub genes (Figure 10). The hub genes were located in the inner circle, while the predicted genes were in the outer circle. Their functions focused on platelet alpha granule and endopeptidase activity, which coincided with the previous study of functional pathways of age-related proteins [12]. The release of platelet alpha granule increases during blood coagulation, and blood coagulation is the main functional pathway of age-related proteins.
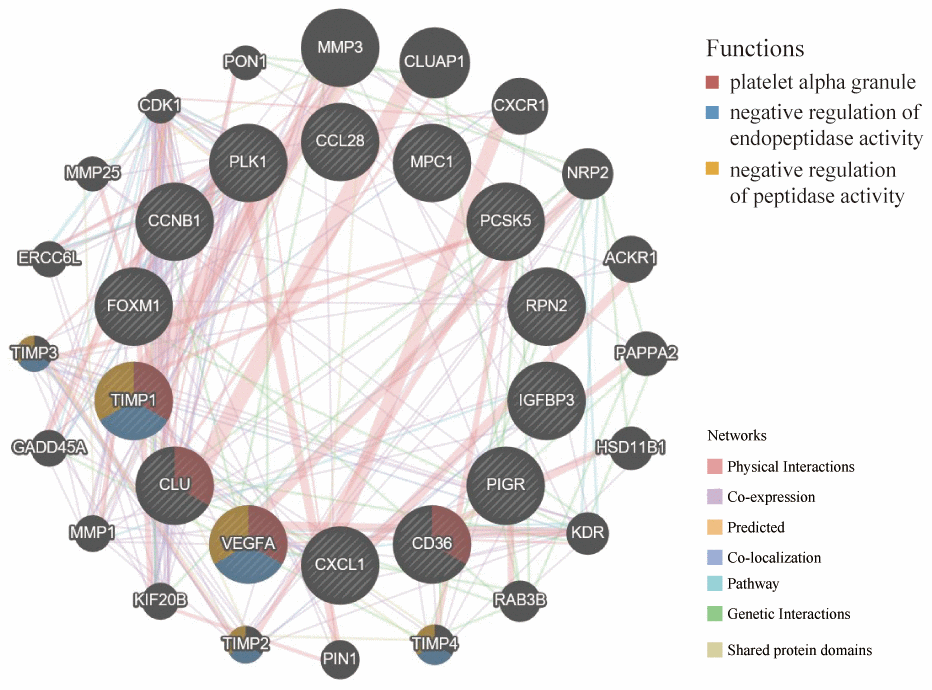
Figure 10. GeneMANIA website was used to identify functionally similar genes and establish a PPI network. The 20 functionally similar genes were located in the outer circle, while hub genes were located in the inner circle. The color of nodes was related to the protein function while line color represented the type of protein interaction.
Molecular characteristics and pathways of the aging-related risk signature
Based on the training and testing data sets, we conducted GSEA on 50 hallmark gene sets and 178 KEGG gene sets between low- and high-risk groups. For the hallmark gene sets, 23/50 gene sets were commonly upregulated in the high-risk group and 9/50 gene sets were commonly upregulated in low-risk groups (Figure 11A–11D). For the KEGG gene sets, KEGG_BASAL_CELL_CARCINOMA were commonly upregulated in high-risk groups, while none gene sets was commonly upregulated in low-risk groups. The filter criteria for enrichment was nominal P-value < 5% and FDR q-value<25%.
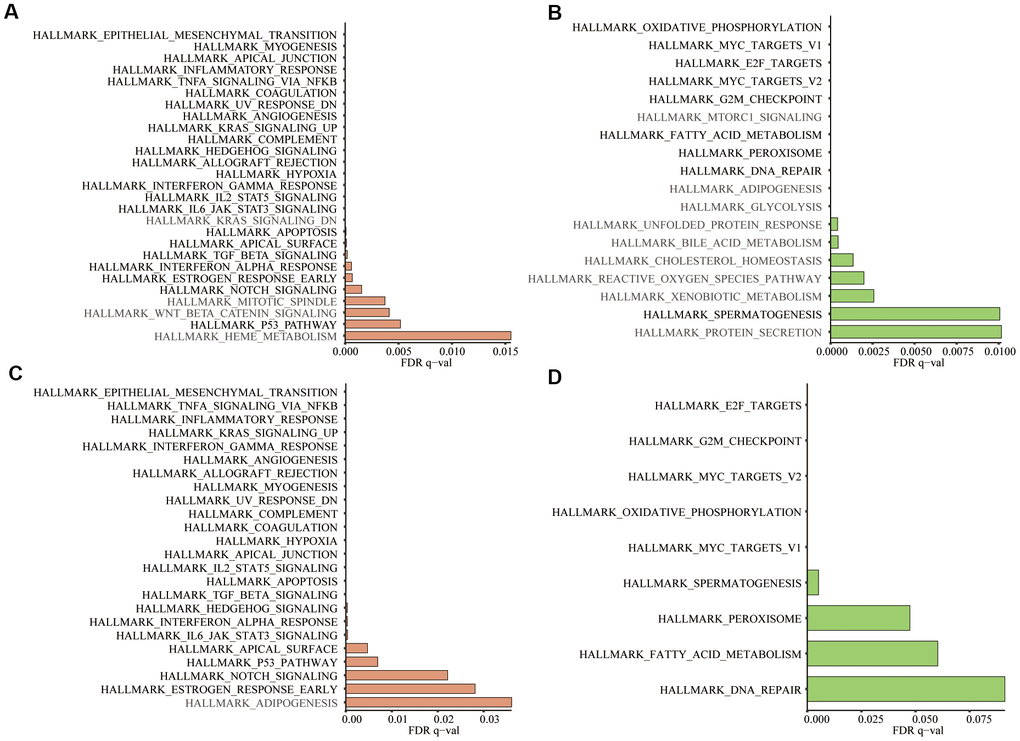
Figure 11. In the 50 hallmark gene sets, we conducted GSEA between the high- and low-risk groups. (A) Significant enrichment of 27 hallmark gene sets in the high-risk group of training group TCGA; (B) Significant enrichment of 18 hallmark gene sets in the low-risk group of the training group; (C) Significant enrichment of 24 hallmark gene sets in the high-risk group of testing group GSE39582; (D) Significant enrichment of 9 hallmark gene sets in the low-risk group of the testing group. Dark black represented the enrichment results common to both datasets (Nominal P-value < 5% and FDR q-value<25%).
Discussion
Colorectal cancer (CRC) remains the third most commonly diagnosed cancer, ranking second of cancer-related mortality. Due to changes in living habits and population aging, CRC incidence is increasing continuously [13].
As the public databases of the TCGA, GEO and Molecular Signatures Database (MSigDB) are freely available, increasing risk models have been established to prejudge the overall survival (OS) of CRC patients. However, among the various risk signatures, the aging-related risk signature has never been mentioned.
Our study identified 1693 aging-related genes shared in both the training group TCGA and testing group GSE39582 and further constructed a 15-gene risk signature using the LASSO COX regression analysis based on the TCGA data set. The aging-related risk score was significantly associated with the OS of CRC patients and higher in the advanced AJCC stage, T stage, N stage and M stage, whose accuracy for the prediction of the OS was credible based on the ROC curve and the area under the curve (AUC). We also confirmed that this aging-related risk signature was positively correlated with the degree of immune cell infiltration in the CRC tumor microenvironment. All in all, we could predict the survival, severity and immune cell infiltration of CRC patients based on our risk signature. The same conclusions were obtained in the testing group.
Biologically speaking, aging is an inevitable process that occurs spontaneously in organisms over time. It is manifested by the degenerative changes of structure and the decline of function, adaptability and resistance. Physiologically, aging is regarded as the history of individual development from the beginning of the fertilized egg to old age. Pathologically, aging is the results of stress, injury, infection, declining immune response, malnutrition, metabolic disorders and drug abuse. Aging is considered as an independent risk factor for many chronic diseases and most common malignancies, including CRC [6]. The mutation accumulation theory of aging partially explains the relationship between aging and cancer [14]. In cancer research, malignant tumors and aging can be seen as two aspects of the same underlying cellular and molecular process [15]. Aging promotes carcinogenesis, tumor progress and resistance to cancer therapy [16]. Inflammation, one of the seven pillars of aging, increases the risk of cancer and leads to the initial mutation of genes and metastasis of cancer [17]. Immunosuppression promotes age-related impairment of antitumor immunity, which is a typical example of immune aging [7]. Novel markers of aging also have prognostic potentials for cancer [18]. Besides, senescence also has tumor-suppressing functions, owing to the persistence of growth stagnation caused by senescence, which paves the way for cancer treatment [19]. The above facts indicate that there is an urgent need to improve our understanding of the relationship between aging biology and cancer.
Among 15 hub genes, ribophorin-II (RPN2) had a higher amplification frequency. Previous studies have revealed that increased RPN2 is significantly associated with poor histological differentiation, advanced stages and lymph nodes metastasis in patients with CRC [20]. RPN2 promotes CRC cell proliferation by upregulating the glycosylation of EGFR [21]. Moreover, the downregulation of RPN2 can induce apoptosis and inhibit migration and invasion [22]. Among 15 hub genes, the deep deletion of clusterin (CLU) was the most obvious. Previous studies have shown that high CLU mRNA expression levels in CRC patients often represent a poor outcome. Some controversial data have been published and reveals its dual faces as a tumor suppressor or a pro-survival factor in CRC [23]. Besides, Immunoglobulin Heavy Constant Gamma 1 (IGHG1) had no copy number changes in CRC patients. The role of IGHG1 in CRC has never been investigated. In prostate cancer research, inhibition of IGHG1 can suppress cell growth and induce cell cycle arrest and ultimate apoptosis [24].
In the study of plasma proteomic signature of age in healthy humans, functional pathways of age-related proteins mainly included blood coagulation, chemokines and inflammatory pathways, axon guidance, peptidase activity, and apoptosis [12]. At the GeneMANIA, hub genes and predicted 20 similar genes were mainly focused on blood coagulation and endopeptidase activity, which indicated that hub genes were associated with the aging process.
Our research’s advantage is a large number of samples in the TCGA and GEO databases to identify and verify risk signature. The limitation of our study is that only retrospective studies have been performed. Thus, a cohort of CRC patients will be needed to test this signature in the future.
CRC is getting younger and younger, and it is urgent to make accurate survival prediction for diagnosed patients and make better treatment strategies. We first constructed and verified the aging-related risk signature in different data sets. This risk score was significantly increased in patients with advanced AJCC stage, T3-4, positive lymph node metastasis and positive distant metastasis. Compared with other clinical parameters, the P-values of "M" is relatively insignificant. We need to be cautious when determining whether CRC patients have distant metastases based on this score. Moreover, this risk score was significantly and positively correlated with the richness of 5 types of immune cell infiltration in the tumor microenvironment.
Taken together, our prognostic signature can predict the severity of CRC and the level of immune cell infiltration. Aging-related risk signature will be a novel prognostic assessment tool, and the 15 hub genes also need more functional analysis to explore their possible clinical values.
Materials and Methods
Data collection
In this study, the transcriptome profiling data and corresponding clinical information of colorectal cancer (CRC) were downloaded from The Cancer Genome Atlas (TCGA) (https://portal.gdc.cancer.gov/) and Gene Expression Omnibus (GEO) (https://www.ncbi.nlm.nih.gov/geo/). The samples with follow-up time less than 30 days were excluded to reduce the interference of unrelated factors. 49 aging-related gene sets, 50 hallmark gene sets and 178 KEGG gene sets were downloaded from the Molecular Signatures Database v7.1 (https://www.gsea-msigdb.org/gsea/index.jsp) [25, 26]. The data on the immune cell content of 32 tumors in the TCGA database was downloaded from the Tumor-Infiltrating Immune Cells (TIMER) website (https://cistrome.shinyapps.io/timer/) [27].
Gene set enrichment analysis (GSEA)
Table 1 showed the number of CRC tumor samples, normal samples and detected genes in 3 data sets, TCGA, GSE39582 [28] and GSE87211 [29]. The GSEA was a computational method that could predict whether the defined set of genes showed statistically significant, concordant differences between 2 biological conditions [30]. To study the role of aging in CRC, GSEA was performed to analyze the enrichment of GO_AGING, GO_CELL_AGING and GO_CELLULAR_SENESCENCE between tumor samples and normal samples via GSEA software version 4.0.1. To investigate the aging-related risk signature’s molecular characteristics and pathways, we conducted GSEA to displayed differences between high- and low-risk groups in 50 hallmark gene sets and 178 KEGG gene sets. Significance criteria were nominal P-value <5% and false positive rate (FDR) <25%. Gene set permutations were performed 1,000 times for each analysis.
Differential gene analysis
With the help of the Venn diagrams tool (http://bioinformatics.psb.ugent.be/webtools/Venn/) and the R software “limma” package (http://www.bioconductor.org/) [31], 258 differentially expressed aging-related genes were extracted from the TCGA database. P<0.05 and logFC>1 were set as filter criteria. Heatmap and volcano plot were used to visualize differential genes.
Metascape
The Metascape (http://metascape.org) is a friendly, reliable tool for functional enrichment analysis [32]. The number of min overlaps and min enrichment were 3 and P-value cutoff was 0.05. Next, we performed the protein-protein interaction enrichment analysis on this website, and the Molecular Complex Detection (MCODE) algorithm had been applied to determine densely connected network components [33]. Pathway and process enrichment analysis had also been used to each MCODE component independently.
Protein-protein interaction (PPI)
The STRING website (https://string-db.org/) integrated and constructed the PPI using computational predictions, which visualized the intrinsic links among 258 differentially expressed aging-related genes [34]. Cytoscape's plugin CytoHubba was used to discover key nodes in the PPI network [35].
Development of the prognostic signature based on the LASSO COX regression
Univariate COX and LASSO-penalized COX regression were used to construct optimal prognostic risk signatures for CRC samples in the training group. The COX regression model with the LASSO penalty successfully achieved compression and selected 15 aging-related genes simultaneously [36]. The risk score formula was as follows:
Pearson correlation analysis
With the help of “corrplot” packages, we had drawn the correlation map, which reported Pearson correlation values between 15 hub genes.
Evaluating signature performance in training and testing groups
Aging-related risk signature and clinical parameters, including age, gender, stage, T, N and M, were considered as covariates. We performed univariate independent prognostic analysis. In order to avoid multicollinearity between stage and T, N, M, the multivariate independent prognostic analysis only included gender, age, stage and risk score. Results were illustrated in the forest plots. Green and red represented univariate and multivariate independent prognostic analysis, respectively. P-value, hazard ratios (HR) and 95% CI of each variable were also displayed in the forest plots. The “survivalROC” package was applied to confirm the predictive accuracy of the risk signature [37].
The clinical correlation and the correlation of immune cell infiltration
Differences between risk signature and clinicopathological parameters stage, T, N and M were tested using independent t-tests [38]. The Tumor IMmune Estimation Resource (TIMER) database analyzes the richness of immune cell infiltration in the tumor microenvironment [27]. The current version of TIMER incorporates 11510 samples across 32 cancer types of TCGA database [38]. 6 types of immune cells are B cells, CD4 T cells, CD8 T cells, neutrophils, macrophages and dendritic cells. Spearman correlation analysis was performed between aging-related risk score and immune cell infiltration. P-values of less than 0.05 were considered statistically significant.
Mutation and copy number alteration (CNA) analysis of hub genes
The cBioPortal (https://www.cbioportal.org) is a friendly website exploring, visualizing and analyzing multi-dimensional cancer genomic data [39]. The copy-number alteration (CNA) and mutation of 15 hub genes were identified using segmentation analysis and GISTIC algorithm in the cBioPortal among 526 CRC patients/samples (TCGA, PanCancer Atlas) [40].
GeneMANIA
The GeneMANIA website (http://genemania.org) is used to predict functionally similar genes of hub genes and construct the PPI network among them [41]. It can also predict the relationships among functionally similar genes and hub genes, including protein-protein, protein-DNA interactions, pathways, physiological and biochemical reactions, co-expression, co-localization [42]. In this study, we explored functionally similar genes of hub genes and performed functional enrichment analysis.
Statistical analysis
Statistical analysis in this study were performed with R software 3.6.1. P <0.05 and logFC>1 were the filtering criteria for differential genes. LASSO regression analysis was utilized to exclude highly correlated aging-related genes and prevented the signature from overfitting. The Kaplan-Meier survival curves were constructed to analyze survival differences between the low- and high -risk groups. Student's t-test was used to determine the relationships between the risk score and clinical parameters. Based on univariate and multivariate COX proportional hazard models, we calculated the hazard ratios of prognostic factors and screened independent prognostic factors. The ROC curve was used to evaluate the accuracy of our aging signature. P < 0.05 was considered as statistical significance.
Supplementary Materials
Author Contributions
Conception and design: Yucun Liu, Shuai Zuo, Pengyuan Wang and Shanwen Chen. Data collection, analysis and processing: Taohua Yue and Shanwen Chen. Paper writing: Taohua Yue. Paper revision: Pengyuan Wang, Jing Zhu, Shihao Guo and Zhihao Huang. Final approval of manuscript: All authors.
Acknowledgments
We sincerely thank the R package developers and the maintainers of the TCGA database, GEO database, GeneMANIA, cBioPortal, STRING, TIMER and Metascape website.
Conflicts of Interest
We have no conflicts of interest to declare.
Funding
This study was supported by the National Science and Technology Major Project of China (No. 2018ZX10723204), Scientific Research Seed Fund of Peking University First Hospital (No. 2019SF01) and the National Natural Science Foundation of China (No. 81902384 and No. 81770522).
References
- 1. Siegel RL, Miller KD, Goding Sauer A, Fedewa SA, Butterly LF, Anderson JC, Cercek A, Smith RA, Jemal A. Colorectal cancer statistics, 2020. CA Cancer J Clin. 2020; 70:145–64. https://doi.org/10.3322/caac.21601 [PubMed]
- 2. Adelstein BA, Macaskill P, Chan SF, Katelaris PH, Irwig L. Most bowel cancer symptoms do not indicate colorectal cancer and polyps: a systematic review. BMC Gastroenterol. 2011; 11:65. https://doi.org/10.1186/1471-230X-11-65 [PubMed]
- 3. Smetana K
Jr , Lacina L, Szabo P, Dvořánková B, Brož P, Šedo A. Ageing as an important risk factor for cancer. Anticancer Res. 2016; 36:5009–17. https://doi.org/10.21873/anticanres.11069 [PubMed] - 4. Campisi J. Aging, cellular senescence, and cancer. Annu Rev Physiol. 2013; 75:685–705. https://doi.org/10.1146/annurev-physiol-030212-183653 [PubMed]
- 5. Hanahan D, Weinberg RA. Hallmarks of cancer: the next generation. Cell. 2011; 144:646–74. https://doi.org/10.1016/j.cell.2011.02.013 [PubMed]
- 6. Calcinotto A, Kohli J, Zagato E, Pellegrini L, Demaria M, Alimonti A. Cellular senescence: aging, cancer, and injury. Physiol Rev. 2019; 99:1047–78. https://doi.org/10.1152/physrev.00020.2018 [PubMed]
- 7. Brahmer J, Reckamp KL, Baas P, Crinò L, Eberhardt WE, Poddubskaya E, Antonia S, Pluzanski A, Vokes EE, Holgado E, Waterhouse D, Ready N, Gainor J, et al. Nivolumab versus docetaxel in advanced squamous-cell non-small-cell lung cancer. N Engl J Med. 2015; 373:123–35. https://doi.org/10.1056/NEJMoa1504627 [PubMed]
- 8. Hu X, Li YQ, Ma XJ, Zhang L, Cai SJ, Peng JJ. A risk signature with inflammatory and T immune cells infiltration in colorectal cancer predicting distant metastases and efficiency of chemotherapy. Front Oncol. 2019; 9:704. https://doi.org/10.3389/fonc.2019.00704 [PubMed]
- 9. Yang Y, Qu A, Wu Q, Zhang X, Wang L, Li C, Dong Z, Du L, Wang C. Prognostic value of a hypoxia-related microRNA signature in patients with colorectal cancer. Aging (Albany NY). 2020; 12:35–52. https://doi.org/10.18632/aging.102228 [PubMed]
- 10. Zhou Z, Mo S, Dai W, Ying Z, Zhang L, Xiang W, Han L, Wang Z, Li Q, Wang R, Cai G. Development and validation of an autophagy score signature for the prediction of post-operative survival in colorectal cancer. Front Oncol. 2019; 9:878. https://doi.org/10.3389/fonc.2019.00878 [PubMed]
- 11. Menor M, Zhu Y, Wang Y, Zhang J, Jiang B, Deng Y. Development of somatic mutation signatures for risk stratification and prognosis in lung and colorectal adenocarcinomas. BMC Med Genomics. 2019 (Suppl 1); 12:24. https://doi.org/10.1186/s12920-018-0454-7 [PubMed]
- 12. Tanaka T, Biancotto A, Moaddel R, Moore AZ, Gonzalez-Freire M, Aon MA, Candia J, Zhang P, Cheung F, Fantoni G, Semba RD, Ferrucci L, and CHI consortium. Plasma proteomic signature of age in healthy humans. Aging Cell. 2018; 17:e12799. https://doi.org/10.1111/acel.12799 [PubMed]
- 13. Nasaif HA, Al Qallaf SM. Knowledge of colorectal cancer symptoms and risk factors in the kingdom of Bahrain: a cross- sectional study. Asian Pac J Cancer Prev. 2018; 19:2299–304. https://doi.org/10.22034/APJCP.2018.19.8.2299 [PubMed]
- 14. Hughes KA, Alipaz JA, Drnevich JM, Reynolds RM. A test of evolutionary theories of aging. Proc Natl Acad Sci USA. 2002; 99:14286–91. https://doi.org/10.1073/pnas.222326199 [PubMed]
- 15. López-Otín C, Blasco MA, Partridge L, Serrano M, Kroemer G. The hallmarks of aging. Cell. 2013; 153:1194–217. https://doi.org/10.1016/j.cell.2013.05.039 [PubMed]
- 16. Aaldriks AA, van der Geest LG, Giltay EJ, le Cessie S, Portielje JE, Tanis BC, Nortier JW, Maartense E. Frailty and malnutrition predictive of mortality risk in older patients with advanced colorectal cancer receiving chemotherapy. J Geriatr Oncol. 2013; 4:218–26. https://doi.org/10.1016/j.jgo.2013.04.001 [PubMed]
- 17. Collerton J, Martin-Ruiz C, Davies K, Hilkens CM, Isaacs J, Kolenda C, Parker C, Dunn M, Catt M, Jagger C, von Zglinicki T, Kirkwood TB. Frailty and the role of inflammation, immunosenescence and cellular ageing in the very old: cross-sectional findings from the newcastle 85+ study. Mech Ageing Dev. 2012; 133:456–66. https://doi.org/10.1016/j.mad.2012.05.005 [PubMed]
- 18. Eberhardt K, Beleites C, Marthandan S, Matthäus C, Diekmann S, Popp J. Raman and infrared spectroscopy distinguishing replicative senescent from proliferating primary human fibroblast cells by detecting spectral differences mainly due to biomolecular alterations. Anal Chem. 2017; 89:2937–47. https://doi.org/10.1021/acs.analchem.6b04264 [PubMed]
- 19. Sager R. Senescence as a mode of tumor suppression. Environ Health Perspect. 1991; 93:59–62. https://doi.org/10.1289/ehp.919359 [PubMed]
- 20. Zhou T, Wu L, Wang Q, Jiang Z, Li Y, Ma N, Chen W, Hou Z, Gan W, Chen S. MicroRNA-128 targeting RPN2 inhibits cell proliferation and migration through the Akt-p53-cyclin pathway in colorectal cancer cells. Oncol Lett. 2018; 16:6940–49. https://doi.org/10.3892/ol.2018.9506 [PubMed]
- 21. Li H, Al-Japairai K, Tao Y, Xiang Z. RPN2 promotes colorectal cancer cell proliferation through modulating the glycosylation status of EGFR. Oncotarget. 2017; 8:72633–51. https://doi.org/10.18632/oncotarget.20005 [PubMed]
- 22. Bi C, Jiang B. Downregulation of RPN2 induces apoptosis and inhibits migration and invasion in colon carcinoma. Oncol Rep. 2018; 40:283–93. https://doi.org/10.3892/or.2018.6434 [PubMed]
- 23. Mazzarelli P, Pucci S, Spagnoli LG. CLU and colon cancer. The dual face of CLU: from normal to Malignant phenotype. Adv Cancer Res. 2009; 105:45–61. https://doi.org/10.1016/S0065-230X(09)05003-9 [PubMed]
- 24. Chu J, Li Y, Deng Z, Zhang Z, Xie Q, Zhang H, Zhong W, Pan B. IGHG1 regulates prostate cancer growth via the MEK/ERK/c-Myc pathway. Biomed Res Int. 2019; 2019:7201562. https://doi.org/10.1155/2019/7201562 [PubMed]
- 25. Subramanian A, Tamayo P, Mootha VK, Mukherjee S, Ebert BL, Gillette MA, Paulovich A, Pomeroy SL, Golub TR, Lander ES, Mesirov JP. Gene set enrichment analysis: a knowledge-based approach for interpreting genome-wide expression profiles. Proc Natl Acad Sci USA. 2005; 102:15545–50. https://doi.org/10.1073/pnas.0506580102 [PubMed]
- 26. Liberzon A, Birger C, Thorvaldsdóttir H, Ghandi M, Mesirov JP, Tamayo P. The molecular signatures database (MSigDB) hallmark gene set collection. Cell Syst. 2015; 1:417–25. https://doi.org/10.1016/j.cels.2015.12.004 [PubMed]
- 27. Li B, Severson E, Pignon JC, Zhao H, Li T, Novak J, Jiang P, Shen H, Aster JC, Rodig S, Signoretti S, Liu JS, Liu XS. Comprehensive analyses of tumor immunity: implications for cancer immunotherapy. Genome Biol. 2016; 17:174. https://doi.org/10.1186/s13059-016-1028-7 [PubMed]
- 28. Marisa L, de Reyniès A, Duval A, Selves J, Gaub MP, Vescovo L, Etienne-Grimaldi MC, Schiappa R, Guenot D, Ayadi M, Kirzin S, Chazal M, Fléjou JF, et al. Gene expression classification of colon cancer into molecular subtypes: characterization, validation, and prognostic value. PLoS Med. 2013; 10:e1001453. https://doi.org/10.1371/journal.pmed.1001453 [PubMed]
- 29. Hu Y, Gaedcke J, Emons G, Beissbarth T, Grade M, Jo P, Yeager M, Chanock SJ, Wolff H, Camps J, Ghadimi BM, Ried T. Colorectal cancer susceptibility loci as predictive markers of rectal cancer prognosis after surgery. Genes Chromosomes Cancer. 2018; 57:140–49. https://doi.org/10.1002/gcc.22512 [PubMed]
- 30. Powers RK, Goodspeed A, Pielke-Lombardo H, Tan AC, Costello JC. GSEA-InContext: identifying novel and common patterns in expression experiments. Bioinformatics. 2018; 34:i555–64. https://doi.org/10.1093/bioinformatics/bty271 [PubMed]
- 31. Ritchie ME, Phipson B, Wu D, Hu Y, Law CW, Shi W, Smyth GK. Limma powers differential expression analyses for RNA-sequencing and microarray studies. Nucleic Acids Res. 2015; 43:e47. https://doi.org/10.1093/nar/gkv007 [PubMed]
- 32. Zhou Y, Zhou B, Pache L, Chang M, Khodabakhshi AH, Tanaseichuk O, Benner C, Chanda SK. Metascape provides a biologist-oriented resource for the analysis of systems-level datasets. Nat Commun. 2019; 10:1523. https://doi.org/10.1038/s41467-019-09234-6 [PubMed]
- 33. Bader GD, Hogue CW. An automated method for finding molecular complexes in large protein interaction networks. BMC Bioinformatics. 2003; 4:2. https://doi.org/10.1186/1471-2105-4-2 [PubMed]
- 34. Szklarczyk D, Gable AL, Lyon D, Junge A, Wyder S, Huerta-Cepas J, Simonovic M, Doncheva NT, Morris JH, Bork P, Jensen LJ, Mering CV. STRING v11: protein-protein association networks with increased coverage, supporting functional discovery in genome-wide experimental datasets. Nucleic Acids Res. 2019; 47:D607–13. https://doi.org/10.1093/nar/gky1131 [PubMed]
- 35. Shannon P, Markiel A, Ozier O, Baliga NS, Wang JT, Ramage D, Amin N, Schwikowski B, Ideker T. Cytoscape: a software environment for integrated models of biomolecular interaction networks. Genome Res. 2003; 13:2498–504. https://doi.org/10.1101/gr.1239303 [PubMed]
- 36. Friedman J, Hastie T, Tibshirani R. Regularization paths for generalized linear models via coordinate descent. J Stat Softw. 2010; 33:1–22. [PubMed]
- 37. Ploeg M, Aben KK, Kiemeney LA. The present and future burden of urinary bladder cancer in the world. World J Urol. 2009; 27:289–93. https://doi.org/10.1007/s00345-009-0383-3 [PubMed]
- 38. Lin P, Guo YN, Shi L, Li XJ, Yang H, He Y, Li Q, Dang YW, Wei KL, Chen G. Development of a prognostic index based on an immunogenomic landscape analysis of papillary thyroid cancer. Aging (Albany NY). 2019; 11:480–500. https://doi.org/10.18632/aging.101754 [PubMed]
- 39. Gao J, Aksoy BA, Dogrusoz U, Dresdner G, Gross B, Sumer SO, Sun Y, Jacobsen A, Sinha R, Larsson E, Cerami E, Sander C, Schultz N. Integrative analysis of complex cancer genomics and clinical profiles using the cBioPortal. Sci Signal. 2013; 6:pl1. https://doi.org/10.1126/scisignal.2004088 [PubMed]
- 40. Li W, Li X, Gao LN, You CG. Integrated analysis of the functions and prognostic values of RNA binding proteins in lung squamous cell carcinoma. Front Genet. 2020; 11:185. https://doi.org/10.3389/fgene.2020.00185 [PubMed]
- 41. Xu M, Li Y, Li W, Zhao Q, Zhang Q, Le K, Huang Z, Yi P. Immune and Stroma Related Genes in Breast Cancer: A Comprehensive Analysis of Tumor Microenvironment Based on the Cancer Genome Atlas (TCGA) Database. Front Med (Lausanne). 2020; 7:64. https://doi.org/10.3389/fmed.2020.00064 [PubMed]
- 42. Franz M, Rodriguez H, Lopes C, Zuberi K, Montojo J, Bader GD, Morris Q. GeneMANIA update 2018. Nucleic Acids Res. 2018; 46:W60–64. https://doi.org/10.1093/nar/gky311 [PubMed]