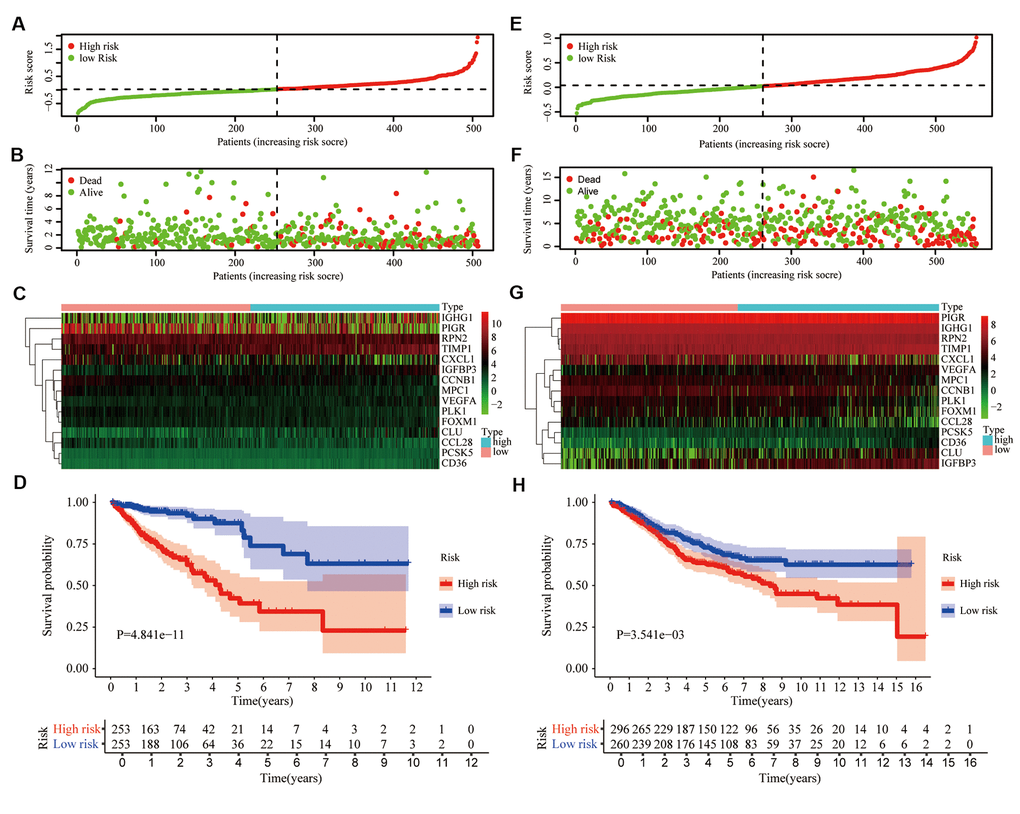
Figure 4.Prognostic signature based on 15 hub genes. (A) Distribution of groups based on the aging-related risk score. (B) The scatter plot demonstrated the differences in the survival status of CRC patients between high- and low-risk groups. (C) Heatmap showed differential expression of included 15 hub genes in both groups. (D) The overall survival (OS) of the high-risk group was significantly shorter than that of the low-risk group. (E–H) The second verification was performed in the testing group GSE39582.