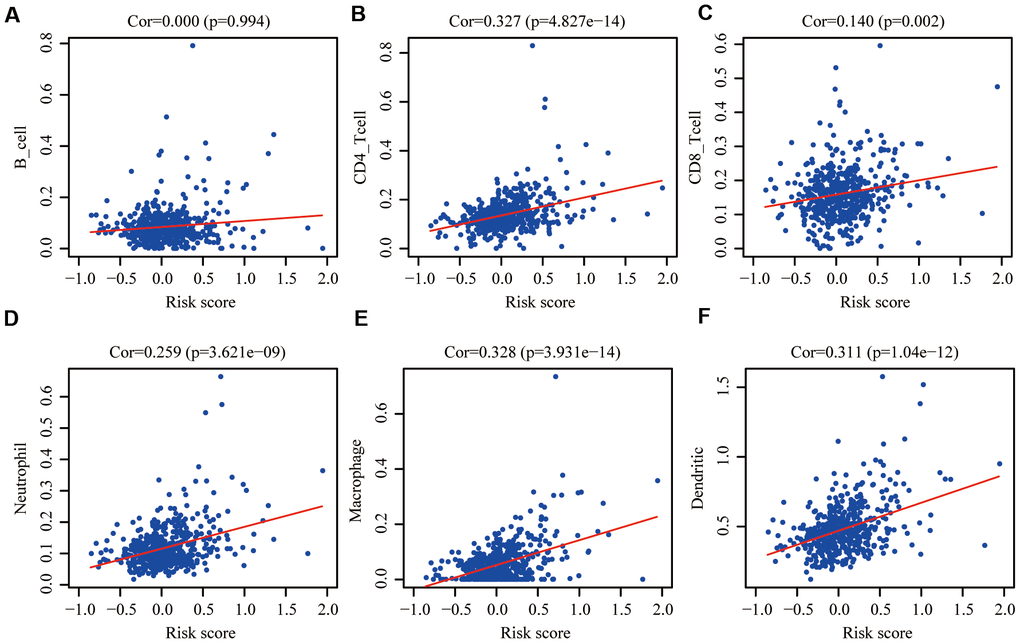
Figure 8.Pearson correlation analysis between the risk score and infiltration abundances of 6 types of immune cells in the training group. (A) B cells; (B) CD4+T cells; (C) CD8+T cells; (D) neutrophils; (E) macrophages and (F) dendritic cells. P < 0.05 was considered statistically significant.