


Introduction
Aging is defined as progressive multifactorial functional decline over time at the molecular, cellular, tissue, and organismal levels [1]. The aging organism becomes frail, with increased disease susceptibility. Aging is a major risk factor for aging-related diseases including neurodegeneration, cardiovascular disease, osteoporosis, and cancer [2]. This process depends on the interaction between numerous genetic, environmental, and lifestyle factors [3]. The individual genetic or epigenetic background affects cellular senescence. Consequently, the genetic and epigenetic backgrounds are the main factors related to aging within organisms. Molecular mechanisms of aging can be attributed to accumulated genetic mutations and epigenetic dysfunction [4]. These molecular alterations interact directly with the transcriptional network. Thus, identifying aging-related molecular features has critical implications for enhancing our understanding of aging and the mechanism underlying aging-induced disease.
Because peripheral whole blood sampling is easy to access and non-invasive, researchers use whole blood to investigate molecular profiles and disease-associated molecular biomarkers [5]. This approach is based on the idea that gene expression in peripheral whole blood reflects expression profiles related to pathological changes in other tissues [6]. To fully explore the information contained in the molecular blood signature, molecular profiling tools using -omics analyses were applied to whole blood, giving rise to the field of “bloodomics” [7]. Numerous investigators apply bloodomics assays in studies on aging [8–11]. Large-scale analyses of the relationship between aging and gene expression have been performed using human peripheral blood samples [9, 12]. Most studies are cross-sectional; however, several longitudinal studies focused on specific aging-related hypofunction [13], only used short-term observations [14], or examined specific cell populations [15, 16]. While these massive scale studies provide insights into the complex biological processes associated with human aging, transcriptome studies involving natural aging over time using identical samples and controlled environmental conditions remain lacking.
To date, studies on aging have laid extensive groundwork using models such as worms, flies, fish, and rodents. These models provide insights into the process of aging. However, for clinical applications, more complex animal models such as non-human primates (NHPs), which exhibit aging mechanisms that are similar to those observed during human aging, are required [17]. NHPs share genetic, physiological, immunological, and behavioral similarities with humans. In addition, inter-individual variation in NHPs is similar to the variation observed in humans, and NHP models recapitulate naturally-occurring age-associated diseases even in the absence of genetic manipulation [18, 19]. NHP studies permit complete control of environmental exposures including diet, environmental factors, housing, and social interactions. Therefore, longitudinal NHP studies can overcome the limitations associated with other models of aging and human studies. Thus, longitudinal NHP studies provide an excellent opportunity to study the actual mechanisms involved in aging over time.
The African green monkey (AGM) is a medium-sized Old World monkey (OWM) that originated in Africa. AGMs have an average lifespan of 11-13 years in the wild, while they can survive for more than 31 years in captivity [19]. Traditionally, AGMs are used as an experimental NHP model for biomedical research [20], particularly as models of infectious disease, human immunodeficiency virus, and preclinical pharmacokinetic studies [21]. They are also important models of neurological, degenerative, and cardiovascular disease, and cognitive and social behavior. AGMs exhibit the same or similar degenerative diseases as humans, including cancer, dementia, Parkinson’s disease, and cardiovascular impairments. For these reasons, AGMs serve as an excellent animal model for studying changes related to aging and age-associated disease. In addition, the draft genome of AGM was recently published and is now available in GenBank (AGM GenBank Assembly ID, GCA_000409795.2). Therefore, the above-mentioned characteristics make AGMs an attractive animal model in aging-related studies.
Here, we performed a longitudinal gene expression study in healthy aged AGMs (n=9) by obtaining peripheral blood cells at three time points over a period of two years using non-invasive biopsy. To identify the most relevant gene expression signatures for aging over time, we performed transcriptomic analysis at three time points and compared differentially expressed genes (DEGs) between two time points. Furthermore, candidate aging genes were selected by time series analysis. Gene ontology (GO) and gene interaction analyses showed that upregulated genes or candidate aging genes are associated various biological processes, with ribosome and translation processes among the most represented.
Results
Global transcriptional profiling and clustering
To compare the temporal transcriptional changes, samples from nine naturally-aged AGMs (age 15 to 23, and consisting of seven females and two males) were analyzed by RNA-seq over a period of two years. Samples from each animal were collected at three consecutive time points (Supplementary Figure 1 and Supplementary Table 1). About 43.1-62.3 million raw reads from each sample were sequenced (Supplementary Table 2). After the low-quality reads were filtered out, 82.3-90.0% reads were analyzed and uniquely mapped to the AGM ChlSab1.1 reference genome. The expression of each gene was normalized to fragments per kb per million fragments (FPKM); the FPKM values were considered the final level of expression for each gene. We calculated Pearson’s correlation coefficients to compare global gene expression between samples (Supplementary Table 3). The intra-individual correlation coefficients decreased over time. Furthermore, the number of high inter-individual correlation coefficients exhibited a time-dependent decrease at the second and third time points compared with the first time point.
We also performed unsupervised clustering analysis and generated heat maps from whole transcriptome data using Cluster 3.0 software. Genes with an FPKM value above 25 in at least one sample and a fold change greater than 2 between the highest and lowest samples were excluded to remove noninformative genes for clustering. This resulted in 1866 unique genes. Hierarchical clustering analysis identified gene groups at each time point (Figure 1A). Cluster 1 contained 289 genes, and the correlation between genes in the cluster was 0.52. Then, Cluster 1 was annotated using the PANTHER (Protein Analysis through Evolutionary Relationships) classification system, which identified 272 mRNAs distributed in various GO categories. Among the GO categories, metabolic processes, cellular component organization or biogenesis, biological regulation, binding, and cell terms were dominant (Figure 1B–1D).
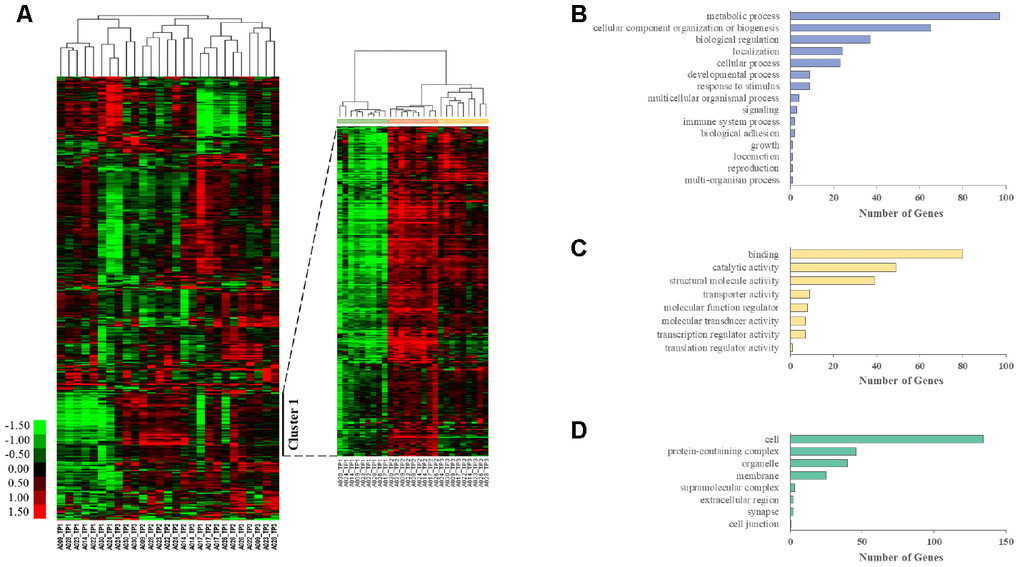
Figure 1. Longitudinal aging-associated global expression profiling. (A) Hierarchical clustering is presented in a matrix format, where each row represents an individual gene and each column represents a different time point in each AGM. Red, high expression; green, low expression. Cluster 1 contains the genes that are highly expressed in TP2 and TP3 compared with those in TP1. PANTHER GO slim enrichment analysis of (B) biological processes (BP), (C) molecular function (MF), and (D) cellular components (CC).
Characterization of individual aging processes in aged AGMs
We analyzed RNA-seq data from whole-blood samples of aged AGMs. Then, we selected genes that were differentially expressed over time for each individual. Genes that satisfied the following two conditions were considered as DEGs: (1) p-value < 0.05, and (2) |fold change| ≥ 1.3. The DEGs were compared as follows: (1) time point (TP) 2 vs TP 1; (2) TP 3 vs TP 2; and (3) TP 3 vs TP 1. To investigate aging in each individual, we compared the number of DEGs in each aged AGM. Linear regression analysis of DEGs showed that the number of DEGs tended to increase with age (Figure 2). Then, we identified the aging-related DEGs using Venn diagram analysis (Supplementary Figure 2). The aging-related DEGs were defined as overlapping genes in each DEG set. Then, the aging-related DEGs were annotated using the PANTHER classification system for GO analysis. In this analysis, GO terms with a corrected p-value < 0.05 were considered significantly enriched. Then, we selected GO terms with two criteria: i.e., -log(p-value) > 2.5 and enrichment fold > 5. When we analyzed the upregulated aging-related DEGs, we found significant enrichment in translation- and ATP synthesis-related biological processes in more than half of all the aged AGMs (Figure 3A). The molecular functions, “structural ribosome constituent” and “structural molecule activity” were overrepresented in all aged AGMs (Figure 3B). The most overrepresented cellular components were “ribosome,” “ribosomal subunit,” “cytosol,” “spliceosome,” “proteasome,” and “mitochondrial membrane” in all or more than half of the aged AGMs (Figure 3C). Individual GO terms were “RNA splicing” and “protein folding associated with protein quality control” (Figure 3A). In the case of downregulated genes, significant GO-term enrichment was not detected.
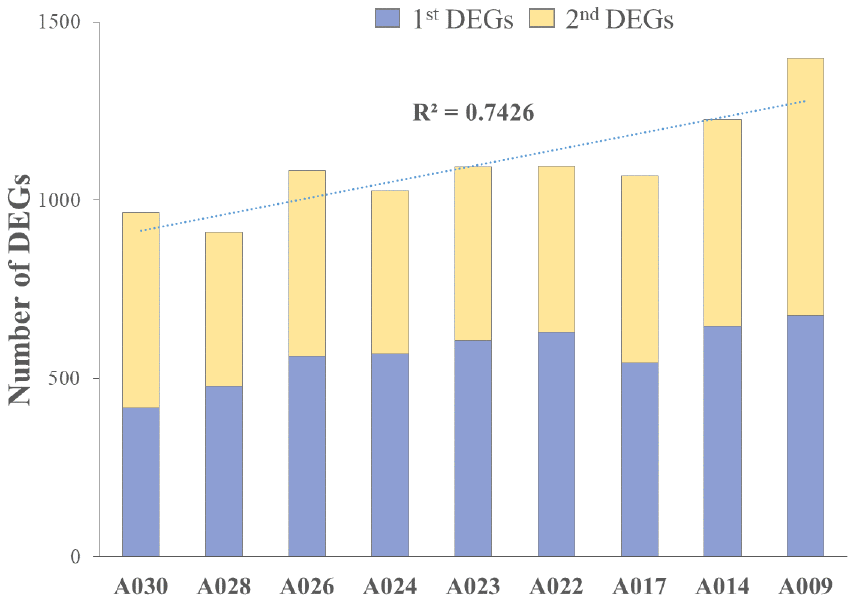
Figure 2. Cumulative individual DEGs in aged AGMs. The number of DEGs increased with chronological age. A030 to A009 were in reverse order of chronological age. A030 was the youngest, while A009 was the oldest.
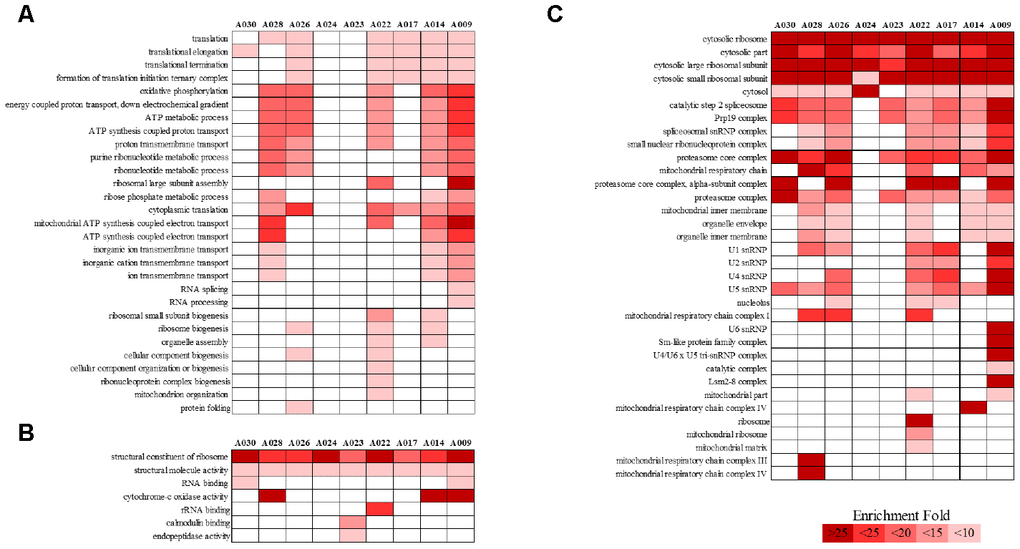
Figure 3. PANTHER GO slim analysis of individual aging-related DEGs. (A) BP, (B) MF, and (C) CC enrichment. Each GO term was sorted using the following parameters: –log10(p-value) > 2.5 and enrichment > 5. Gradient colors indicate the degree of enrichment.
Characterization of common aging-related genes in aged AGMs
We attempted to identify the common aging-related gene expression patterns among nine aged AGMs. Common DEGs over time were selected using the same criteria used to select individual DEGs. Each individual was regarded as a biological replicate. To identify the common aging-related DEGs, we performed Venn diagram analysis (Figure 4). The common aging-related DEGs were defined as overlapping genes in each DEG set. We identified 997 upregulated genes, which were annotated using the PANTHER classification system (Figure 4A). We selected GO terms using two criteria, i.e., -log(p-value) > 2.5 and enrichment fold > 5. The highest overrepresented biological processes were “ribosome biogenesis,” “ribonucleoprotein complex biogenesis,” “purine ribonucleotide metabolic process,” “oxidative phosphorylation,” and “ATP metabolic process” (Figure 5A). Overrepresented molecular functions were “structural constituent of ribosome” and “rRNA binding” (Figure 5B). The most overrepresented cellular components were “cytosolic ribosome,” “cytosolic small and large ribosomal subunit,” “U5 snRNP,” “spliceosomal snRNP complex,” and “proteasome core complex” (Figure 5C). In the case of downregulated genes (485 genes), we did not observe GO terms that met the appropriate criteria.
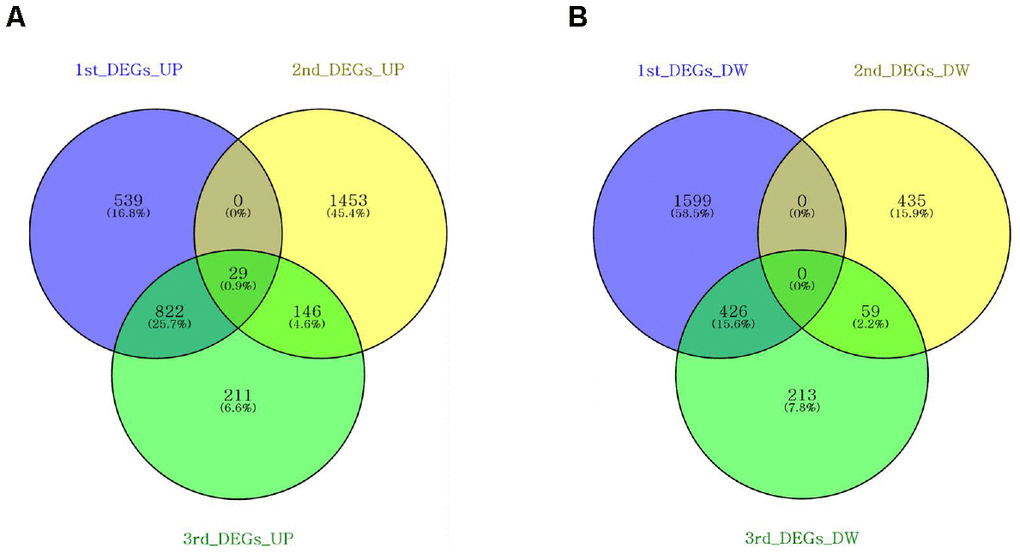
Figure 4. Venn diagrams showing the DEG overlap from pairwise comparisons of each time point. Venn diagrams were constructed using Venny online software. (A) Nine hundred and ninety-seven upregulated genes were shared across DEG sets. (B) Four hundred and eighty-five downregulated genes were shared across the DEG sets.
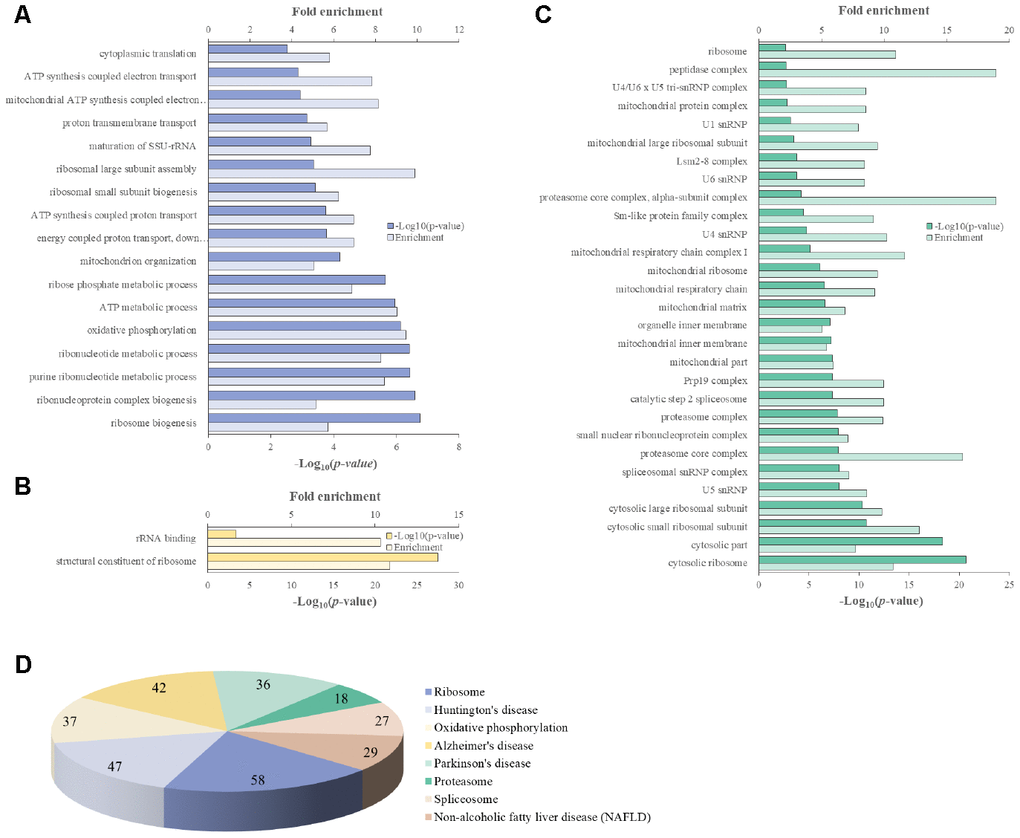
Figure 5. PANTHER GO slim analysis and KEGG pathway analysis of common aging-related DEGs. (A) BP, (B) MF, (C) CC enrichment, and (D) KEGG pathways. Each GO term and KEGG pathway were sorted using the following parameters: –log10(p-value) > 2.5 and enrichment > 5.
We identified 165 common aging-related genes contributing to KEGG pathways. KEGG pathways were selected using the criteria -log(p-value) > 2.5. Figure 5D shows the gene number distribution for various KEGG pathways. Among the KEGG pathways, the most represented was “ribosome pathway,” followed by “degenerative diseases pathways such as Huntington’s disease, Alzheimer’s disease, and Parkinson’s disease,” “oxidative phosphorylation pathway,” “proteasome pathway,” “non-alcoholic fatty liver disease pathway,” and “spliceosome pathway.”
Time series analysis and candidate aging genes
To investigate the global temporal transcriptional patterns, time series analysis was performed. We defined the DEGs across a time series as genes that are differentially expressed between two time points. Then, we performed time series expression profile clustering to identify common temporal expression patterns. DEGs were clustered into nine groups, i.e., up-up (29 genes), up-unchanged (1,034 genes), up-down (327 genes), unchanged-up (519 genes), unchanged-unchanged (21,977 genes), unchanged-down (167 genes), down-up (1,080 genes), down-unchanged (944 genes), and down-down (not detected) (Supplementary Figure 3). Based on the time series clustering, up-up cluster genes were selected as the candidate aging genes (Table 1). In particular, the changes in the expression of nine genes (RPL37A, RPS21, RPL37, RPS26, RPS27A, RPL13A, GLRX3, RPL32, and TMA7) showed a more cumulatively increased pattern than those in the other candidate aging genes.
Table 1. Candidate aging genes.
| Gene Name | Accession no. | Description | Chr | Srart | End | Strand | 1st DEGs | 2nd DEGs | ||
| p-value | Log2FC | p-value | Log2FC | |||||||
| RPL37A | ENSCSAG00000000609 | ribosomal protein L37a | 1 | 82546802 | 82547077 | - | 0.0043 | 0.60 | 5.00E-05 | 1.15 |
| RPS21 | ENSCSAG00000016013 | ribosomal protein S21 | 2 | 1841865 | 1843087 | - | 0.0076 | 0.81 | 5.00E-05 | 1.37 |
| RPL37 | ENSCSAG00000016909 | 60S ribosomal protein L37 | 4 | 39586974 | 39590110 | - | 5.00E-05 | 1.20 | 5.00E-05 | 1.80 |
| RPL6 | ENSCSAG00000018863 | 60S ribosomal protein L6 | 5 | 39187341 | 39188207 | + | 0.0001 | 1.24 | 0.00585 | 0.62 |
| RPS26 | ENSCSAG00000019637 | ribosomal protein S26 | 6 | 40596460 | 40596804 | - | 0.0107 | 0.75 | 0.0002 | 0.83 |
| BAX | ENSCSAG00000002776 | BCL2-associated X protein | 6 | 42186238 | 42194115 | + | 0.01115 | 0.58 | 0.0398 | 0.39 |
| RPS27A | ENSCSAG00000000427 | ribosomal protein S27a | 7 | 2002541 | 2003068 | + | 0.0012 | 0.86 | 5.00E-05 | 1.07 |
| H2AFZ | ENSCSAG00000000395 | H2A histone family member Z | 7 | 65001927 | 65002313 | - | 0.0064 | 0.66 | 0.0032 | 0.57 |
| NDUFS5 | ENSCSAG00000000098 | NADH dehydrogenase (ubiquinone) Fe-S protein 5 | 7 | 117309172 | 117309649 | + | 5.00E-05 | 1.79 | 0.0014 | 0.79 |
| CHCHD2 | ENSCSAG00000018548 | coiled-coil-helix-coiled-coil-helix domain containing 2, mitochondrial | 8 | 53292182 | 53292871 | + | 0.03975 | 0.47 | 0.02065 | 0.44 |
| RPL36 | ENSCSAG00000018603 | ribosomal protein L36 | 8 | 97021222 | 97021592 | + | 5.00E-05 | 0.90 | 0.0032 | 0.53 |
| RPL13A | ENSCSAG00000019054 | ribosomal protein L13a | 9 | 13383840 | 13384448 | - | 0.046 | 0.48 | 0.00585 | 0.57 |
| CHCHD1 | ENSCSAG00000008922 | coiled-coil-helix-coiled-coil-helix domain containing 1 | 9 | 57589462 | 57590554 | - | 0.0117 | 1.79 | 0.02235 | 0.78 |
| GLRX3 | ENSCSAG00000004419 | glutaredoxin 3 | 9 | 122737379 | 122781391 | + | 0.03215 | 0.47 | 0.00305 | 0.55 |
| MRPL51 | ENSCSAG00000010565 | mitochondrial ribosomal protein L51 | 11 | 6532431 | 6533536 | - | 0.0002 | 0.94 | 5.00E-05 | 0.82 |
| RPL32 | ENSCSAG00000018921 | 60S ribosomal protein L32 | 11 | 79856860 | 79857264 | - | 0.01655 | 0.55 | 5.00E-05 | 0.89 |
| C12orf75 | ENSCSAG00000002966 | chromosome 12 open reading frame 75 | 11 | 100538647 | 100575739 | + | 0.0104 | 1.75 | 0.01225 | 1.04 |
| MDH1 | ENSCSAG00000014691 | malate dehydrogenase 1, NAD | 14 | 43406499 | 43425095 | - | 0.00365 | 0.58 | 0.01465 | 0.44 |
| RPS4 | ENSCSAG00000019456 | 40S ribosomal protein S4 | 14 | 69231717 | 69232508 | - | 5.00E-05 | 2.16 | 0.0125 | 0.62 |
| SUPT4H1 | ENSCSAG00000005761 | suppressor of Ty 4 homolog 1 (S. cerevisiae) | 16 | 35047934 | 35054239 | + | 0.0409 | 0.44 | 0.03495 | 0.40 |
| COX7A2 | ENSCSAG00000014488 | cytochrome c oxidase subunit VIIa polypeptide 2 (liver) | 17 | 45771 | 51669 | + | 0.00015 | 1.17 | 0.00025 | 0.83 |
| TOMM6 | ENSCSAG00000011289 | Mitochondrial importreceptor subunit TOM6 homolog | 17 | 30373701 | 30375892 | - | 0.0104 | 0.60 | 0.035 | 0.38 |
| ATP5O | ENSCSAG00000019522 | ATP synthase, H+ transporting, mitochondrial F1 complex, O subunit | 21 | 116427583 | 116428215 | - | 0.00015 | 0.77 | 0.00285 | 0.54 |
| TMA7 | ENSCSAG00000018802 | translation machinery associated 7 homolog (S. cerevisiae) | 22 | 30956078 | 30956269 | - | 0.00775 | 1.06 | 5.00E-05 | 1.72 |
| PFDN1 | ENSCSAG00000012913 | prefoldin subunit 1 | 23 | 42892401 | 42953491 | - | 0.02735 | 0.46 | 0.0103 | 0.45 |
| MRPS14 | ENSCSAG00000011897 | mitochondrial ribosomal protein S14 | 25 | 54231643 | 54240472 | + | 0.00015 | 1.26 | 0.0118 | 0.66 |
| RPL39 | ENSCSAG00000019753 | 60S ribosomal protein L39 | 26 | 48140075 | 48140227 | - | 5.00E-05 | 4.37 | 0.0015 | 1.26 |
| SNURF | ENSCSAG00000006401 | SNRPN upstream reading frame protein | 26 | 57098072 | 57103910 | - | 0.00915 | 1.31 | 0.0268 | 0.86 |
| MRPL46 | ENSCSAG00000017201 | mitochondrial ribosomal protein L46 | 29 | 7025442 | 7033219 | - | 0.0371 | 0.51 | 0.03695 | 0.42 |
Discussion
To our knowledge, the longitudinal whole transcriptome study reported here is the first to examine aging in aged NHPs. In this study, we used aged AGMs to investigate the transcriptome over a period of two years to identify aging-related genes and potential aging-related pathways. Intriguingly, all our results indicated similar major biological processes, such as translation-associated ribosomal biogenesis, during normal aging. Specifically, 29 candidate aging genes with increased expression over time were identified. Our results also suggest that candidate aging genes may serve as new potential targets for aging or aging biomarkers.
Old World monkeys (e.g. Macaque species and AGMs) serve as robust aging models because they display a realistic aging course with time compression [22, 23]. AGMs have a relatively long lifespan (average, 20 years; maximum lifespan, ~31 years in captivity) [19]. In the case of rhesus monkeys (a Macaque species), the average lifespan in captivity is approximately 26 years [22, 24]. OWMs age in a manner similar to that observed in humans, but at a rate that is approximately three times faster than human aging [22]. Rhesus monkeys are generally considered old after approximately 20 years of age. Indeed, rhesus monkeys show significant signs of physical decline, such as reduced mobility and skin atrophy, by their late 20s [25]. At these later ages, they also develop many disorders common in older humans, including cancer, cataracts, osteopenia, and cardiovascular disease. Aging-related changes in OWMs more closely approximate similar changes observed in humans than those observed in shorter-lived aging models [18]. Though aging research using OWMs involves many difficulties, including high cost, specialized facilities, and NHP scientific specialists, OWMs provide a powerful aging model. Because of this, studies on aging using monkeys often have small sample sizes and are generally cross-sectional rather than longitudinal. Despite such difficulties, research on aging using OWMs remains the attractive translational approach to understand human aging, the mechanisms underlying aging, and aging-related disease [18]. In this study, we investigated the changes at the transcriptome level over a period of two years. For AGMs, two years are equivalent to nearly six to seven human years, so our AGM models can be considered equivalent to 50-70-year-old humans. During our study, we did not observe any other aging-related diseases except physical decline in our AGMs models. Thus, to our knowledge, we provide the first demonstration of transcriptome changes during normal aging using aged primate models.
While chronological age is the amount of time after birth, biological age is measured by physical or functional assessments. Biological age is influenced by various factors, including nutrition, stress, lifestyle, disease, and genetic background [3]. Although chronological age is the same, biological age could be different. Because of the different rates of aging, it is difficult to identify accurate indicators of aging using chronological age alone [26]. In longitudinal studies, serial samples allow comparisons in the same individual at different time points, rather than among other individuals at different ages. Thus, longitudinal studies that observe the same individual throughout their lifespan provide better understanding of aging. Our longitudinal study using aged AGM model allowed us to control for numerous environmental factors, so we could accurately analyze the changes in gene expression over time.
Previous studies suggest a direct connection between dysregulated ribosome biogenesis and aging. For instance, attenuated protein synthesis via caloric restriction or genetic manipulation of ribosome biogenesis-related genes is known to increase the lifespan of multiple organisms, including C. elegans, mice, and humans [27–29]. Therefore, promoting ribosome biogenesis could accelerate aging. Indeed, a recently published study revealed increased ribosomal biogenesis and activity as hallmarks of premature aging in human fibroblasts [30]. In our study, gene expression was clustered relatively well at each time point (Figure 1). This result suggests the existence of gene groups involved in the aging process over time. Indeed, we identified individual aging-related DEGs and common aging-related DEGs. The findings from the GO enrichment analyses indicated enrichment of biological processes involved in ribosome biogenesis and translation (Figures 3, 5). This is consistent with the finding that cytosolic ribosomal proteins are upregulated with age in various human tissues, including brain [31], kidney [32], and muscle [33]. Moreover, a 10-year longitudinal study demonstrated that a similar number of DEGs are expressed between the ages of 70 and 80 in human whole blood [8]. These DEGs showed significant enrichment for multiple aging-related pathways, including protein metabolism and oxidative phosphorylation. Many of these processes have been previously described in aging [30, 34, 35]. Individual GO terms were “RNA splicing” and “protein folding associated with protein quality control” (Figure 3A). These results suggest that the processes involved in common natural aging are associated with ribosome biogenesis and translation, and those involved in individual aging are associated with RNA splicing, protein folding, and protein quality control. Moreover, 29 candidate aging genes were associated with ribosomes, cytoplasmic translation, and mitochondrial translational termination. The expression of these genes in whole blood was consistently associated with these processes, with increased gene expression over the period of two years (Table 1). Increased expression of ribosome and translation-associated genes, including the 29 aging candidate genes identified in this study, appears to be a potential biomarker of aging that requires further functional analysis.
Several hypotheses have been suggested to explain the process of aging. Some gene-centric theories have been suggested; these primarily focus on harmful changes in the genome that accumulate during the life cycle [36], including DNA mutation and shortened telomeres. Other epigenetic theories have been suggested; these focus on how changes in the DNA and DNA-binding proteins affect gene expression [37]. These epigenetic changes include DNA methylation, histone modification, and loss of chromosomal organization. Other theories of aging suggest declining quality of control systems during protein synthesis and degradation and chaperone systems [38]. The decline in protein quality control is involved in abnormal protein accumulation, because protein production and disposal become increasingly compromised with age. However, we already know that due to the complexity of the aging process, an integrated approach is needed to better understand the mechanism of aging. In this respect, genomics, transcriptomics, epigenomics, proteomics, and metabolomics could provide crucial evidence for explaining the complex and interconnected changes that occur during aging, though current knowledge of these molecular interactions is still limited.
Previous research showed that errors in DNA repair and inaccurate replication lead to the accumulation of DNA mutations and epimutations with age [39, 40]. Genomic instability via accumulated DNA damage in aging may also promote specific epigenetic alterations, such as global loss of chromatin compaction through the recruitment of chromatin modifiers, including Polycomb, SIRT1, SIRT6, and methyltransferases [40]. The accumulation of epimutations via chromatin modifications in aging may also induce changes in gene expression, thus inducing transcriptional instability [4]. Although we have focused on temporal transcriptome changes with aging in this study, we suggest a hypothesis called the “snowball effect via ribosomal biogenesis,” when considered with previous aging studies [41] (Figure 6). In this model, alterations in ribosomal biogenesis play a role in gradually increasing the effects on aging. The accumulation of DNA mutations induces epimutations during aging, thereby inducing transcriptional instability. Because the rate of protein translation is proportional to the rate of ribosome biogenesis, upregulated protein synthesis is related to disrupted global proteostasis [42]. While a normal healthy state maintains balanced cellular protein synthesis and recycling, aging induces an imbalanced state of protein synthesis and recycling (Figure 6A). In the common aging process, upregulated protein synthesis exhibits an increasingly greater impact on cellular aging, similar to a snowball rolling down a hill. Some individual aging processes would be affected via interventions of protein quality control systems (Figure 6B). Intervention of protein quality control systems would have induced individual difference in aging.
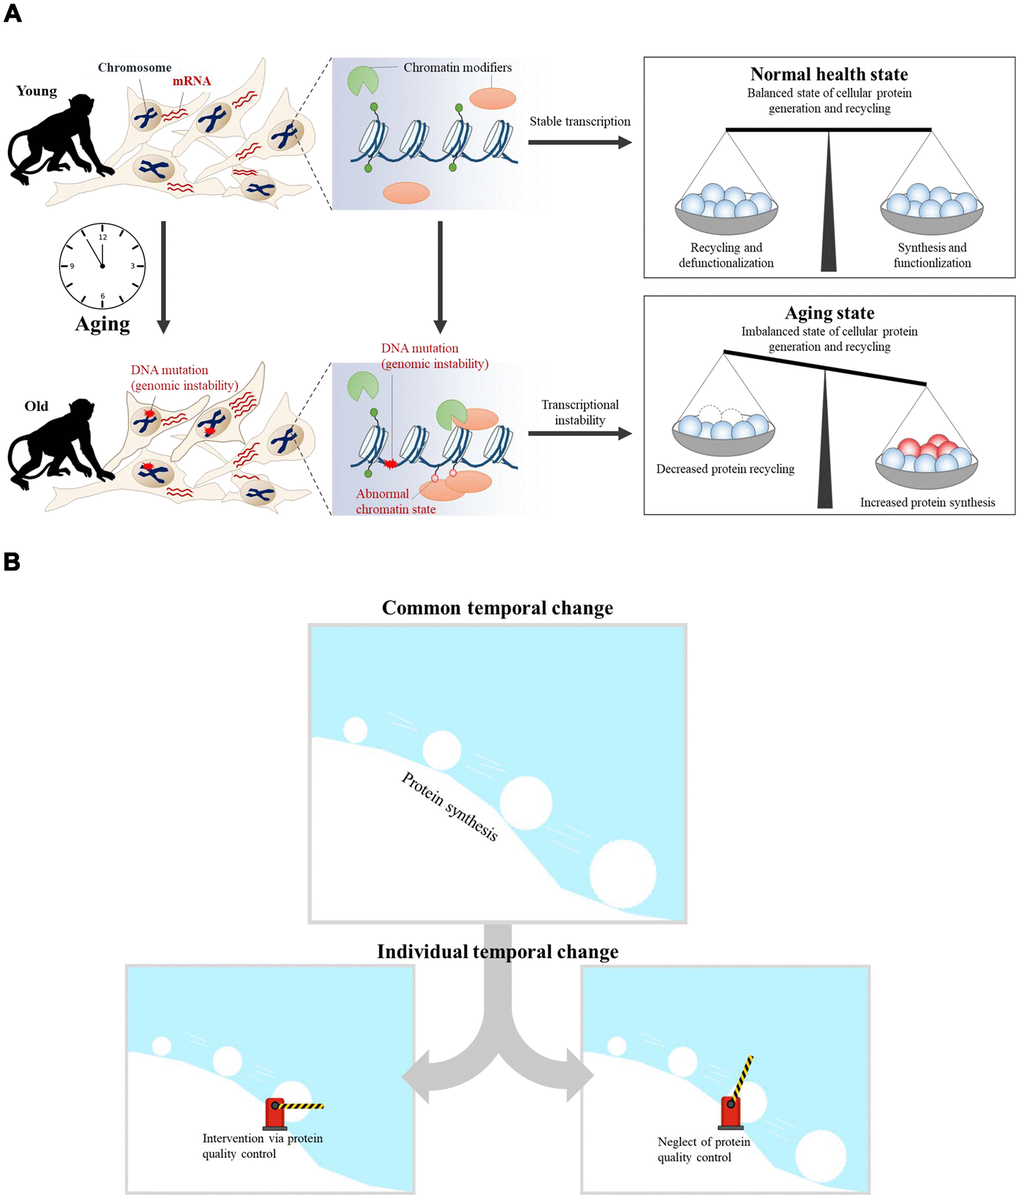
Figure 6. The aging snowball effect model. (A) In the case of young cells, transcriptional programs are tightly controlled by epigenetic regulators. As a result, balanced cellular protein synthesis and recycling are maintained in the ‘normal healthy state.’ However, transcriptional instability increases concomitantly with age. The accumulation of DNA mutations can trigger the recruitment of chromatin modifiers, which results in abnormal chromatin structure and transcriptional instability. Thus, the ‘aged state’ becomes an imbalanced state wherein cellular protein synthesis and recycling are dysregulated. (B) Aging is the result of accumulated dysregulation and damage that results in a “snowball” effect. Accumulated dysregulation and damage is promoted by upregulated protein synthesis during aging. Upregulated protein synthesis has an increasingly greater impact on cellular aging, similar to a snowball rolling down a hill. Individual aging processes could be affected by targeting protein quality control systems, provided that this is the common aging process.
In summary, we present the first longitudinal characterization of transcriptional changes in aging NHPs. Our findings indicate that translation-related genes, such as those involved in ribosome biogenesis, are upregulated in normal aging. We identified 29 candidate aging genes that could serve as an attractive target for the treatment of aging, or could function as biomarkers for aging. However, this is just the beginning of our understanding of the aging process. To substantially explain our aging hypothesis, our next step involves a comprehensive approach to collect integrated -omics evidence using genomics, transcriptomics, and epigenomics.
Materials and Methods
Ethical approval
All animal procedures were conducted based on the Guidelines of the Institutional Animal Care and Use Committee (KRIBB-AEC-14007, KRIBB-AEC-15031, and KRIBB-AEC-16067) at the Korea Research Institute of Bioscience and Biotechnology (KRIBB).
Animals and sampling
Nine naturally-aged AGMs were used in this study. Their characteristics are summarized in Supplementary Table 1. All animals were provided by the National Primate Research Center (NPRC) of Korea. In our experiments, specific pathogen-free (SPF) animals were used. All animals were subjected to a complete physical assessment, including viral, bacterial, and parasite examinations. On physical examination, SPF animals were examined for coat condition, appearance, weight, sex, and date of birth. Enzyme immunoassays were performed to detect viruses, such as simian herpes B virus (BV), simian T-cell lymphotropic/leukemia virus (STLV)-1 and -2, simian immunodeficiency virus (SIV), simian retrovirus (SRV)-1, -2, and -5, and simian virus 40 (SV40). In addition, tests were performed to detect Mycobacterium tuberculosis (TB), Shigella spp., Salmonella spp., and pathogenic E. coli. In our SPF animals, all these tests were negative. The monkeys were housed indoors in individual cages and fed commercial monkey chow2 (Harlan) supplemented daily with various fruits, and supplied water ad libitum. Environmental conditions were controlled to provide a constant temperature of 24 ± 2° C, 50 ± 5% relative humidity, 100% fresh air at ≥12 room changes/h, and a 12 h light:dark cycle. Each monkey was given access to environmental enrichment such as approved toys, perches, or music to promote psychological well-being. Animal health was monitored by the attending veterinarian consistent with the recommendations of the Weatherall Report. Nine naturally aged AGMs were exposed in the same environment during the study. These monkeys were in individual cages of the same indoor room and were provided the same food conditions, such as commercial monkey feed and fruits.
Peripheral blood samples from nine aged AGMs of varying ages from 15-23 years old were collected three times over a period of two years (Supplementary Table 1). The collected whole blood samples were analyzed the cell type composition by hematology analyzer (Hemavet950, Drew Scientific, USA) (Supplementary Figure 4). We performed paired t-test to considerate about potential confounding effects from collected blood samples at each time point. As a result of paired t-test, there was no statistical difference in blood cell counts between each group except monocyte at TP1 vs TP2 (Supplementary Table 4). Furthermore, blood samples were collected by venipuncture and stored in PAXgene tubes (PreAnalytiX, Hombrechtikon, Switzerland) for RNA extraction and sequencing. Peripheral blood sampling processes and methods were always same at each time-point.
RNA extraction and high-throughput paired-end RNA sequencing
Total RNA was extracted using PAXgene Blood RNA Kits (Qiagen, Hilden, Germany). RNase-free DNase (Qiagen, GmbH, Hilden, Germany) was used to eliminate DNA contamination from the total RNA preparations. The quality of the prepared total RNA was evaluated using an Agilent 2100 Bioanalyzer (Agilent, USA). Each total RNA had an RNA integrity number (RIN) >7.5. cDNA libraries for RNA-seq were prepared from RNA samples using oligo d(T) primer. Constructed libraries were sequenced using an Illumina HiSeq 2000 sequencer (Illumina, USA). We performed paired t-test to considerate about potential confounding effects from RNA extraction and RNA sequencing of samples at each time point. As a result of paired t-test, there was no statistical difference in total RNA quality between each group (Supplementary Table 5). Although, RNA extraction, library preparation, and sequencing were performed at each time-point, were always performed by the same technician to minimize confounding effects.
RNA-seq data processing
Images generated by the HiSeq 2000 were converted into nucleotide sequences by a base-calling pipeline and stored in FASTQ format. Low-quality reads were removed prior to mapping and assembly. Three criteria were used to filter out raw dirty reads, i.e., 1) reads with more than 10 % ‘N’ bases; 2) low-quality reads which had more than 40 % QA ≤ 20 bases; and 3) reads with an average quality score < 20. All subsequent analyses used clean reads.
Clean reads were mapped to the reference Chlorocebus sabaeus transcriptome sequences from the Ensembl database (ChlSab1.1), using Bowtie2 and Tophat 2.0.1. Mismatches ≤ 3 base pairs were allowed in each read alignment. FPKM values for each gene were calculated, and DEGs were identified using this value as described in the Results section. For genes with more than one alternative transcript, the longest transcript was used to calculate the FPKM value.
Gene expression analysis
Hierarchical clustering analysis was performed using Cluster 3.0. All FPKM values were increased by 1 and log2 transformed. The data were adjusted by centering genes at the median. Clustering was performed using differential distance metrics and average linkage as the method. TreeView Software was used to visualize the clustering results. Differential gene expression analysis was performed using Cuffdiff. The differential expression p-values were adjusted using the Benjamini and Hochberg procedure, resulting in the false discovery rate (FDR), which was set to an FDR < 0.05 cutoff. Venn diagrams were constructed using online Venny software (http://bioinfogp.cnb.csic.es/tools/venny/) to identify aging-associated genes. Then, aging-associated genes were defined as the intersecting DEGs between each time point. For time series expression analysis, p-values were used as the main filter to identify genes with differential expression across the time points. Therefore, genes with log2FC > 0 and p-value < 0.05 were classified as being upregulated, while genes with log2FC < 0 and p-value < 0.05 were classified as being downregulated.
Functional annotation
GO slim terms were analyzed using the PANTHER Classification System (http://www.pantherdb.org/) version 14.0. Functional annotation and KEGG pathway analysis were performed using DAVID (Database for Annotation, Visualization, and Integrated Discovery, version 6.8; http://david.abcc.ncifcrf.gov).
Supplementary Materials
Author Contributions
JRL, SHC, and YHK contributed equally to this study. JRL and JWH designed the project. SJP and JWH supervised the project. JRL, SHC, and YHK performed the experiments. JRL, SHC, YHK, HMC, HRP, and HEL analyzed the data and drafted the manuscript. HMC, HRP, HEL, and KJJ prepared the blood samples. HMC, HRP, and HEL generated the sequences from the samples. YBJ, JSK, SJP, and JWH reviewed the manuscript. All authors read and approved the final manuscript.
Acknowledgments
This research was supported by a grant from the KRIBB Research Initiative program (KGM4622013, KGM5282022) and the National Research Foundation of Korea (NRF) grant funded by the Korea government (NRF-2020R1I1A2071747 and NRF-2020R1I1A2071865).
Conflicts of Interest
The authors declare that they have no conflicts of interest.
References
- 1. Fedarko NS. The biology of aging and frailty. Clin Geriatr Med. 2011; 27:27–37. https://doi.org/10.1016/j.cger.2010.08.006 [PubMed]
- 2. Niccoli T, Partridge L. Ageing as a risk factor for disease. Curr Biol. 2012; 22:R741–52. https://doi.org/10.1016/j.cub.2012.07.024 [PubMed]
- 3. Hamczyk MR, Nevado RM, Barettino A, Fuster V, Andrés V. Biological versus chronological aging: JACC focus seminar. J Am Coll Cardiol. 2020; 75:919–30. https://doi.org/10.1016/j.jacc.2019.11.062 [PubMed]
- 4. Benayoun BA, Pollina EA, Brunet A. Epigenetic regulation of ageing: linking environmental inputs to genomic stability. Nat Rev Mol Cell Biol. 2015; 16:593–610. https://doi.org/10.1038/nrm4048 [PubMed]
- 5. Liew CC, Ma J, Tang HC, Zheng R, Dempsey AA. The peripheral blood transcriptome dynamically reflects system wide biology: a potential diagnostic tool. J Lab Clin Med. 2006; 147:126–32. https://doi.org/10.1016/j.lab.2005.10.005 [PubMed]
- 6. Luykx JJ, Olde Loohuis LM, Neeleman M, Strengman E, Bakker SC, Lentjes E, Borgdorff P, van Dongen EP, Bruins P, Kahn RS, Horvath S, de Jong S, Ophoff RA. Peripheral blood gene expression profiles linked to monoamine metabolite levels in cerebrospinal fluid. Transl Psychiatry. 2016; 6:e983. https://doi.org/10.1038/tp.2016.245 [PubMed]
- 7. Mohr S, Liew CC. The peripheral-blood transcriptome: new insights into disease and risk assessment. Trends Mol Med. 2007; 13:422–32. https://doi.org/10.1016/j.molmed.2007.08.003 [PubMed]
- 8. Balliu B, Durrant M, Goede O, Abell N, Li X, Liu B, Gloudemans MJ, Cook NL, Smith KS, Knowles DA, Pala M, Cucca F, Schlessinger D, et al. Genetic regulation of gene expression and splicing during a 10-year period of human aging. Genome Biol. 2019; 20:230. https://doi.org/10.1186/s13059-019-1840-y [PubMed]
- 9. Peters MJ, Joehanes R, Pilling LC, Schurmann C, Conneely KN, Powell J, Reinmaa E, Sutphin GL, Zhernakova A, Schramm K, Wilson YA, Kobes S, Tukiainen T, et al, and NABEC/UKBEC Consortium. The transcriptional landscape of age in human peripheral blood. Nat Commun. 2015; 6:8570. https://doi.org/10.1038/ncomms9570 [PubMed]
- 10. Lehallier B, Gate D, Schaum N, Nanasi T, Lee SE, Yousef H, Moran Losada P, Berdnik D, Keller A, Verghese J, Sathyan S, Franceschi C, Milman S, et al. Undulating changes in human plasma proteome profiles across the lifespan. Nat Med. 2019; 25:1843–50. https://doi.org/10.1038/s41591-019-0673-2 [PubMed]
- 11. Valdes AM, Glass D, Spector TD. Omics technologies and the study of human ageing. Nat Rev Genet. 2013; 14:601–07. https://doi.org/10.1038/nrg3553 [PubMed]
- 12. Viñuela A, Brown AA, Buil A, Tsai PC, Davies MN, Bell JT, Dermitzakis ET, Spector TD, Small KS. Age-dependent changes in mean and variance of gene expression across tissues in a twin cohort. Hum Mol Genet. 2018; 27:732–41. https://doi.org/10.1093/hmg/ddx424 [PubMed]
- 13. Furman D, Chang J, Lartigue L, Bolen CR, Haddad F, Gaudilliere B, Ganio EA, Fragiadakis GK, Spitzer MH, Douchet I, Daburon S, Moreau JF, Nolan GP, et al. Expression of specific inflammasome gene modules stratifies older individuals into two extreme clinical and immunological states. Nat Med. 2017; 23:174–84. https://doi.org/10.1038/nm.4267 [PubMed]
- 14. Bryois J, Buil A, Ferreira PG, Panousis NI, Brown AA, Viñuela A, Planchon A, Bielser D, Small K, Spector T, Dermitzakis ET. Time-dependent genetic effects on gene expression implicate aging processes. Genome Res. 2017; 27:545–52. https://doi.org/10.1101/gr.207688.116 [PubMed]
- 15. Harris SE, Riggio V, Evenden L, Gilchrist T, McCafferty S, Murphy L, Wrobel N, Taylor AM, Corley J, Pattie A, Cox SR, Martin-Ruiz C, Prendergast J, et al. Age-related gene expression changes, and transcriptome wide association study of physical and cognitive aging traits, in the lothian birth cohort 1936. Aging (Albany NY). 2017; 9:2489–503. https://doi.org/10.18632/aging.101333 [PubMed]
- 16. Jung M, Jin SG, Zhang X, Xiong W, Gogoshin G, Rodin AS, Pfeifer GP. Longitudinal epigenetic and gene expression profiles analyzed by three-component analysis reveal down-regulation of genes involved in protein translation in human aging. Nucleic Acids Res. 2015; 43:e100. https://doi.org/10.1093/nar/gkv473 [PubMed]
- 17. Wagar LE, DiFazio RM, Davis MM. Advanced model systems and tools for basic and translational human immunology. Genome Med. 2018; 10:73. https://doi.org/10.1186/s13073-018-0584-8 [PubMed]
- 18. Messaoudi I, Ingram DK. Overview of aging research using nonhuman primate models. Age (Dordr). 2012; 34:1047–49. https://doi.org/10.1007/s11357-011-9370-x [PubMed]
- 19. Colman RJ. Non-human primates as a model for aging. Biochim Biophys Acta Mol Basis Dis. 2018; 1864:2733–41. https://doi.org/10.1016/j.bbadis.2017.07.008 [PubMed]
- 20. Lee JR, Ryu DS, Park SJ, Choe SH, Cho HM, Lee SR, Kim SU, Kim YH, Huh JW. Successful application of human-based methyl capture sequencing for methylome analysis in non-human primate models. BMC Genomics. 2018; 19:267. https://doi.org/10.1186/s12864-018-4666-1 [PubMed]
- 21. Jasinska AJ, Schmitt CA, Service SK, Cantor RM, Dewar K, Jentsch JD, Kaplan JR, Turner TR, Warren WC, Weinstock GM, Woods RP, Freimer NB. Systems biology of the vervet monkey. ILAR J. 2013; 54:122–43. https://doi.org/10.1093/ilar/ilt049 [PubMed]
- 22. Colman RJ, Anderson RM. Nonhuman primate calorie restriction. Antioxid Redox Signal. 2011; 14:229–39. https://doi.org/10.1089/ars.2010.3224 [PubMed]
- 23. Didier ES, MacLean AG, Mohan M, Didier PJ, Lackner AA, Kuroda MJ. Contributions of nonhuman primates to research on aging. Vet Pathol. 2016; 53:277–90. https://doi.org/10.1177/0300985815622974 [PubMed]
- 24. Balasubramanian P, Mattison JA, Anderson RM. Nutrition, metabolism, and targeting aging in nonhuman primates. Ageing Res Rev. 2017; 39:29–35. https://doi.org/10.1016/j.arr.2017.02.002 [PubMed]
- 25. Uno H. Age-related pathology and biosenescent markers in captive rhesus macaques. Age (Omaha). 1997; 20:1–13. https://doi.org/10.1007/s11357-997-0001-5 [PubMed]
- 26. Belsky DW, Caspi A, Houts R, Cohen HJ, Corcoran DL, Danese A, Harrington H, Israel S, Levine ME, Schaefer JD, Sugden K, Williams B, Yashin AI, et al. Quantification of biological aging in young adults. Proc Natl Acad Sci USA. 2015; 112:E4104–10. https://doi.org/10.1073/pnas.1506264112 [PubMed]
- 27. Schosserer M, Minois N, Angerer TB, Amring M, Dellago H, Harreither E, Calle-Perez A, Pircher A, Gerstl MP, Pfeifenberger S, Brandl C, Sonntagbauer M, Kriegner A, et al. Methylation of ribosomal RNA by NSUN5 is a conserved mechanism modulating organismal lifespan. Nat Commun. 2015; 6:6158. https://doi.org/10.1038/ncomms7158 [PubMed]
- 28. Passtoors WM, Beekman M, Deelen J, van der Breggen R, Maier AB, Guigas B, Derhovanessian E, van Heemst D, de Craen AJ, Gunn DA, Pawelec G, Slagboom PE. Gene expression analysis of mTOR pathway: association with human longevity. Aging Cell. 2013; 12:24–31. https://doi.org/10.1111/acel.12015 [PubMed]
- 29. Hofmann JW, Zhao X, De Cecco M, Peterson AL, Pagliaroli L, Manivannan J, Hubbard GB, Ikeno Y, Zhang Y, Feng B, Li X, Serre T, Qi W, et al. Reduced expression of MYC increases longevity and enhances healthspan. Cell. 2015; 160:477–88. https://doi.org/10.1016/j.cell.2014.12.016 [PubMed]
- 30. Buchwalter A, Hetzer MW. Nucleolar expansion and elevated protein translation in premature aging. Nat Commun. 2017; 8:328. https://doi.org/10.1038/s41467-017-00322-z [PubMed]
- 31. Berchtold NC, Cribbs DH, Coleman PD, Rogers J, Head E, Kim R, Beach T, Miller C, Troncoso J, Trojanowski JQ, Zielke HR, Cotman CW. Gene expression changes in the course of normal brain aging are sexually dimorphic. Proc Natl Acad Sci USA. 2008; 105:15605–10. https://doi.org/10.1073/pnas.0806883105 [PubMed]
- 32. Rodwell GE, Sonu R, Zahn JM, Lund J, Wilhelmy J, Wang L, Xiao W, Mindrinos M, Crane E, Segal E, Myers BD, Brooks JD, Davis RW, et al. A transcriptional profile of aging in the human kidney. PLoS Biol. 2004; 2:e427. https://doi.org/10.1371/journal.pbio.0020427 [PubMed]
- 33. Zahn JM, Sonu R, Vogel H, Crane E, Mazan-Mamczarz K, Rabkin R, Davis RW, Becker KG, Owen AB, Kim SK. Transcriptional profiling of aging in human muscle reveals a common aging signature. PLoS Genet. 2006; 2:e115. https://doi.org/10.1371/journal.pgen.0020115.eor [PubMed]
- 34. Gonskikh Y, Polacek N. Alterations of the translation apparatus during aging and stress response. Mech Ageing Dev. 2017; 168:30–36. https://doi.org/10.1016/j.mad.2017.04.003 [PubMed]
- 35. Brace LE, Vose SC, Stanya K, Gathungu RM, Marur VR, Longchamp A, Treviño-Villarreal H, Mejia P, Vargas D, Inouye K, Bronson RT, Lee CH, Neilan E, et al. Increased oxidative phosphorylation in response to acute and chronic DNA damage. NPJ Aging Mech Dis. 2016; 2:16022. https://doi.org/10.1038/npjamd.2016.22 [PubMed]
- 36. da Costa JP, Vitorino R, Silva GM, Vogel C, Duarte AC, Rocha-Santos T. A synopsis on aging-theories, mechanisms and future prospects. Ageing Res Rev. 2016; 29:90–112. https://doi.org/10.1016/j.arr.2016.06.005 [PubMed]
- 37. Zhang W, Qu J, Liu GH, Belmonte JC. The ageing epigenome and its rejuvenation. Nat Rev Mol Cell Biol. 2020; 21:137–50. https://doi.org/10.1038/s41580-019-0204-5 [PubMed]
- 38. Hipp MS, Kasturi P, Hartl FU. The proteostasis network and its decline in ageing. Nat Rev Mol Cell Biol. 2019; 20:421–35. https://doi.org/10.1038/s41580-019-0101-y [PubMed]
- 39. Vijg J, Suh Y. Genome instability and aging. Annu Rev Physiol. 2013; 75:645–68. https://doi.org/10.1146/annurev-physiol-030212-183715 [PubMed]
- 40. Burgess RC, Misteli T, Oberdoerffer P. DNA damage, chromatin, and transcription: the trinity of aging. Curr Opin Cell Biol. 2012; 24:724–30. https://doi.org/10.1016/j.ceb.2012.07.005 [PubMed]
- 41. Booth LN, Brunet A. The aging epigenome. Mol Cell. 2016; 62:728–44. https://doi.org/10.1016/j.molcel.2016.05.013 [PubMed]
- 42. Tiku V, Antebi A. Nucleolar function in lifespan regulation. Trends Cell Biol. 2018; 28:662–72. https://doi.org/10.1016/j.tcb.2018.03.007 [PubMed]