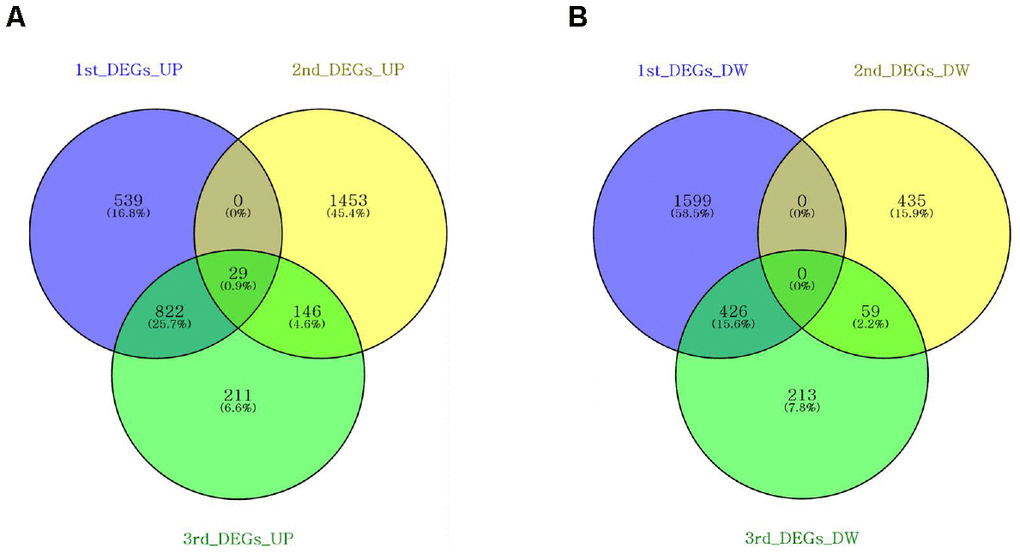
Figure 4.Venn diagrams showing the DEG overlap from pairwise comparisons of each time point. Venn diagrams were constructed using Venny online software. (A) Nine hundred and ninety-seven upregulated genes were shared across DEG sets. (B) Four hundred and eighty-five downregulated genes were shared across the DEG sets.