


Introduction
Kidney renal clear cell carcinoma (KIRC) is the most common histological type of renal cell carcinoma and is associated with the highest metastasis and mortality rates [1]. The number of new cases of KIRC was 73,820 in the United States, and it had caused approximately 14,770 deaths based on cancer statistics data in 2019 [2]. Contrast-enhanced, triple-phase helical computed tomography (CT) and surgery are the most important diagnostic and treatment methods, respectively [3]. Although the treatment for KIRC has improved significantly, its mortality rate is still increasing [2]. Up to 50% of patients who undergo nephrectomy will progress to distant metastasis, and the 5-year survival rate of patients with metastasis is below 12% [4]. The TNM stage remains the most important prognostic predictor for KIRC, but the survival rate can differ greatly for patients even with the same stage because of tumor heterogeneity [5]. Therefore, it is essential to identify effective prognostic biomarkers to identify high-risk patients with poor survival.
Enhancer RNAs (eRNAs) are a subclass of long non-coding RNAs transcribed from enhancer regions. eRNAs are known to promote the formation of enhancer–promoter loops and play diverse and emerging roles in the regulation of gene expression and cell fate [6–8]. In addition, increasing evidence suggests that eRNAs are closely associated with carcinogenesis [9–13]. However, few studies have investigated the role of eRNAs in KIRC. In this study, we explored and identified the eRNAs associated with survival in patients with KIRC. We found that eRNA EMX2OS, located in the tissue-specific enhancer of a tumor suppressor gene EMX2 [14–16], was positively correlated with favorable clinicopathological characteristics and was significantly related to overall survival (OS) in patients with KIRC.
Results
Putative prognostic eRNAs in KIRC
After matching the patients’ clinical information and gene expression data, 535 patients with KIRC were enrolled in the study. Among them, 531 patients had information regarding survival. The patients’ clinicopathological features are summarized in Table 1. A total of 2695 eRNAs, which were annotated using the Encyclopedia of DNA Elements database and derived from tissue-specific enhancers, as well as 2303 predicted target genes, have been identified previously using the PreSTIGE algorithm [17]. We used these eRNA-target pairs to identify potential key eRNAs in KIRC. Finally, 16 eRNA-target pairs were identified with certain conditions (Kaplan-Meier log rank of p < 0.001 and correlation coefficient of r > 0.6 and p < 0.001) (Table 2).
Table 1. Correlations between the expression of EMX2OS/EMX2 and clinicopathologic characteristics in KIRC.
| Characteristic | n (%) | EMX2OS expression (%) | p-value* | EMX2 expression (%) | p-value* | ||||||||||||||||||||||||||||||||||||||||||||||||||||||||||||||||||||||||||||||||||||||||||||||
| High | Low | High | Low | ||||||||||||||||||||||||||||||||||||||||||||||||||||||||||||||||||||||||||||||||||||||||||||||||
| Total | 535 (100) | 267 (49.91) | 268 (50.09) | 267 (49.91) | 268 (50.09) | ||||||||||||||||||||||||||||||||||||||||||||||||||||||||||||||||||||||||||||||||||||||||||||||
| Age | 0.897 | 0.195 | |||||||||||||||||||||||||||||||||||||||||||||||||||||||||||||||||||||||||||||||||||||||||||||||||
| ≤ 60 years | 267 (49.91) | 132 (49.4) | 135 (50.4) | 141 (52.8) | 126 (47.0) | ||||||||||||||||||||||||||||||||||||||||||||||||||||||||||||||||||||||||||||||||||||||||||||||
| > 60 years | 268 (50.09) | 135 (50.6) | 133 (49.6) | 126 (47.2) | 142 (53.0) | ||||||||||||||||||||||||||||||||||||||||||||||||||||||||||||||||||||||||||||||||||||||||||||||
| Gender | 0.001 | 0.029 | |||||||||||||||||||||||||||||||||||||||||||||||||||||||||||||||||||||||||||||||||||||||||||||||||
| Female | 186 (34.77) | 111 (41.6) | 75 (28.0) | 105 (39.3) | 81 (30.2) | ||||||||||||||||||||||||||||||||||||||||||||||||||||||||||||||||||||||||||||||||||||||||||||||
| Male | 349 (65.23) | 156 (58.4) | 193 (72.0) | 162 (60.7) | 187 (69.8) | ||||||||||||||||||||||||||||||||||||||||||||||||||||||||||||||||||||||||||||||||||||||||||||||
| Cancer status | < 0.001 | < 0.001 | |||||||||||||||||||||||||||||||||||||||||||||||||||||||||||||||||||||||||||||||||||||||||||||||||
| Tumor free | 336 (62.8) | 186 (69.7) | 150 (56.0) | 186 (69.7) | 150 (56.0) | ||||||||||||||||||||||||||||||||||||||||||||||||||||||||||||||||||||||||||||||||||||||||||||||
| With tumor | 148 (27.66) | 47 (17.6) | 101 (37.7) | 48 (18.0) | 100 (37.3) | ||||||||||||||||||||||||||||||||||||||||||||||||||||||||||||||||||||||||||||||||||||||||||||||
| Unknow | 51 (9.53) | 34 (12.7) | 17 (6.3) | 33 (12.4) | 18 (6.7) | ||||||||||||||||||||||||||||||||||||||||||||||||||||||||||||||||||||||||||||||||||||||||||||||
| Race | 0.021 | 0.015 | |||||||||||||||||||||||||||||||||||||||||||||||||||||||||||||||||||||||||||||||||||||||||||||||||
| White | 463 (86.54) | 222 (83.1) | 241 (89.9) | 222 (83.1) | 241 (89.9) | ||||||||||||||||||||||||||||||||||||||||||||||||||||||||||||||||||||||||||||||||||||||||||||||
| Asian | 8 (1.5) | 5 (1.9) | 3 (1.1) | 4 (1.5) | 4 (1.5) | ||||||||||||||||||||||||||||||||||||||||||||||||||||||||||||||||||||||||||||||||||||||||||||||
| Black | 57 (10.65) | 38 (14.2) | 19 (7.1) | 39 (14.6) | 18 (6.7) | ||||||||||||||||||||||||||||||||||||||||||||||||||||||||||||||||||||||||||||||||||||||||||||||
| Unknow | 7 (1.31) | 2 (0.7) | 5 (1.9) | 2 (0.7) | 5 (1.9) | ||||||||||||||||||||||||||||||||||||||||||||||||||||||||||||||||||||||||||||||||||||||||||||||
| Grade | < 0.001 | < 0.001 | |||||||||||||||||||||||||||||||||||||||||||||||||||||||||||||||||||||||||||||||||||||||||||||||||
| G1 | 14 (2.62) | 13 (4.9) | 1 (0.4) | 13 (4.9) | 1 (0.4) | ||||||||||||||||||||||||||||||||||||||||||||||||||||||||||||||||||||||||||||||||||||||||||||||
| G2 | 231 (43.18) | 137 (51.3) | 94 (35.1) | 142 (53.2) | 89 (33.2) | ||||||||||||||||||||||||||||||||||||||||||||||||||||||||||||||||||||||||||||||||||||||||||||||
| G3 | 207 (38.69) | 100 (37.5) | 107 (39.9) | 93 (34.8) | 114 (42.5) | ||||||||||||||||||||||||||||||||||||||||||||||||||||||||||||||||||||||||||||||||||||||||||||||
| G4 | 75 (14.02) | 14 (5.2) | 61 (22.8) | 17 (6.4) | 58 (21.6) | ||||||||||||||||||||||||||||||||||||||||||||||||||||||||||||||||||||||||||||||||||||||||||||||
| Unknow | 8 (1.5) | 3 (1.1) | 5 (1.9) | 2 (0.7) | 6 (2.2) | ||||||||||||||||||||||||||||||||||||||||||||||||||||||||||||||||||||||||||||||||||||||||||||||
| T stage | < 0.001 | < 0.001 | |||||||||||||||||||||||||||||||||||||||||||||||||||||||||||||||||||||||||||||||||||||||||||||||||
| T1 | 275 (51.4) | 164 (61.4) | 111 (41.4) | 166 (62.2) | 109 (40.7) | ||||||||||||||||||||||||||||||||||||||||||||||||||||||||||||||||||||||||||||||||||||||||||||||
| T2 | 70 (13.08) | 32 (12.0) | 38 (14.2) | 31 (11.6) | 39 (14.6) | ||||||||||||||||||||||||||||||||||||||||||||||||||||||||||||||||||||||||||||||||||||||||||||||
| T3 | 179 (33.46) | 70 (26.2) | 109 (40.7) | 69 (25.8) | 110 (41.0) | ||||||||||||||||||||||||||||||||||||||||||||||||||||||||||||||||||||||||||||||||||||||||||||||
| T4 | 11 (2.06) | 1 (0.4) | 10 (3.7) | 1 (0.4) | 10 (3.7) | ||||||||||||||||||||||||||||||||||||||||||||||||||||||||||||||||||||||||||||||||||||||||||||||
| N stage | 0.008 | < 0.001 | |||||||||||||||||||||||||||||||||||||||||||||||||||||||||||||||||||||||||||||||||||||||||||||||||
| N0 | 240 (44.86) | 112 (41.9) | 128 (47.8) | 115 (43.1) | 125 (46.6) | ||||||||||||||||||||||||||||||||||||||||||||||||||||||||||||||||||||||||||||||||||||||||||||||
| N1 | 16 (2.99) | 2 (0.7) | 14 (5.2) | 0 (0.0) | 16 (6.0) | ||||||||||||||||||||||||||||||||||||||||||||||||||||||||||||||||||||||||||||||||||||||||||||||
| Unknow | 279 (52.15) | 153 (57.3) | 126 (47.0) | 152 (56.9) | 127 (47.4) | ||||||||||||||||||||||||||||||||||||||||||||||||||||||||||||||||||||||||||||||||||||||||||||||
| M stage | 0.001 | < 0.001 | |||||||||||||||||||||||||||||||||||||||||||||||||||||||||||||||||||||||||||||||||||||||||||||||||
| M0 | 424 (79.25) | 219 (82.0) | 205 (76.5) | 219 (82.0) | 205 (76.5) | ||||||||||||||||||||||||||||||||||||||||||||||||||||||||||||||||||||||||||||||||||||||||||||||
| M1 | 78 (14.58) | 24 (9.0) | 54 (20.1) | 23 (8.6) | 55 (20.5) | ||||||||||||||||||||||||||||||||||||||||||||||||||||||||||||||||||||||||||||||||||||||||||||||
| Unknow | 33 (6.17) | 24 (9.0) | 9 (3.4) | 25 (9.4) | 8 (3.0) | ||||||||||||||||||||||||||||||||||||||||||||||||||||||||||||||||||||||||||||||||||||||||||||||
| AJCC stage | < 0.001 | < 0.001 | |||||||||||||||||||||||||||||||||||||||||||||||||||||||||||||||||||||||||||||||||||||||||||||||||
| Stage I | 269 (50.28) | 163 (61.0) | 106 (39.6) | 164 (61.4) | 105 (39.2) | ||||||||||||||||||||||||||||||||||||||||||||||||||||||||||||||||||||||||||||||||||||||||||||||
| Stage II | 58 (10.84) | 28 (10.5) | 30 (11.2) | 26 (9.7) | 32 (11.9) | ||||||||||||||||||||||||||||||||||||||||||||||||||||||||||||||||||||||||||||||||||||||||||||||
| Stage III | 123 (22.99) | 51 (19.1) | 72 (26.9) | 51 (19.1) | 72 (26.9) | ||||||||||||||||||||||||||||||||||||||||||||||||||||||||||||||||||||||||||||||||||||||||||||||
| Stage IV | 82 (15.33) | 24 (9.0) | 58 (21.6) | 25 (9.4) | 57 (21.3) | ||||||||||||||||||||||||||||||||||||||||||||||||||||||||||||||||||||||||||||||||||||||||||||||
| Unknow | 3 (0.56) | 1 (0.4) | 2 (0.7) | 1 (0.4) | 2 (0.7) | ||||||||||||||||||||||||||||||||||||||||||||||||||||||||||||||||||||||||||||||||||||||||||||||
| KIRC, Kidney renal clear cell carcinoma; AJCC, American Joint Committee on Cancer. | |||||||||||||||||||||||||||||||||||||||||||||||||||||||||||||||||||||||||||||||||||||||||||||||||||
| *Patients with the missing details were excluded when calculating the p value of the corresponding characteristic. | |||||||||||||||||||||||||||||||||||||||||||||||||||||||||||||||||||||||||||||||||||||||||||||||||||
Table 2. Survival-associated eRNAs and their predicted target.
| eRNA | Log-rank test p-value | Predicted target | correlation coefficient r | Spearman p-value |
| EMX2OS | 3.91E-07 | EMX2 | 0.809 | <0.001 |
| CYP1B1-AS1 | 1.94E-06 | CYP1B1 | 0.669 | <0.001 |
| CCDC18-AS1 | 4.18E-06 | CCDC18 | 0.748 | <0.001 |
| LINC00323 | 6.03E-05 | BACE2 | 0.765 | <0.001 |
| JPX | 8.10E-05 | XIST | 0.679 | <0.001 |
| STX4 | 8.13E-05 | FBXL19 | 0.623 | <0.001 |
| STX4 | 8.13E-05 | HSD3B7 | 0.625 | <0.001 |
| STX4 | 8.13E-05 | PRSS53 | 0.651 | <0.001 |
| SSPO | 0.000105 | ZNF862 | 0.678 | <0.001 |
| LINC00937 | 0.000228 | POU5F1P3 | 0.643 | <0.001 |
| BAALC-AS1 | 0.000329 | FZD6 | 0.672 | <0.001 |
| HOTAIR | 0.000461 | HOXC11 | 0.688 | <0.001 |
| WDFY3-AS2 | 0.000473 | WDFY3 | 0.641 | <0.001 |
| LINC00671 | 0.000583 | G6PC | 0.705 | <0.001 |
| AFG3L1P | 0.000591 | MC1R | 0.786 | <0.001 |
| APCDD1L-DT | 0.000724 | APCDD1L | 0.855 | <0.001 |
EMX2OS is a key eRNA in KIRC
As shown in Table 2, EMX2OS was the putative eRNA most associated with survival, and it showed an obviously positive correlation with its predicted target EMX2. Thus, we performed further analysis for EMX2OS. Based on the expression data of 535 KIRC samples and 72 normal kidney samples, we found that EMX2OS expression was significantly lower in tumor tissues than in normal tissues (p < 0.001) (Figure 1A). According to the median expression level of EMX2OS, 531 patients with KIRC with survival information were divided into the high-EMX2OS and low-EMX2OS expression groups. Kaplan–Meier survival analysis demonstrated that EMX2OS downregulation was significantly associated with poorer OS (hazard ratio [HR] = 0.64, p < 0.001, Figure 1B). Lower EMX2 expression was also related to poorer OS (HR = 0.68, p < 0.001, Figure 1C). Furthermore, there was a strong co-expression relationship between EMX2OS and its predicted target EMX2 (correlation coefficient r = 0.81; p < 0.001) (Figure 1D). We next investigated the relationship between EMX2OS expression and the clinicopathological characteristics of KIRC. We found that the EMX2OS expression level was significantly related to several clinicopathological features of KIRC, including gender (p = 0.001), cancer status (p < 0.001), race (p = 0.021), histological grade (p < 0.001), tumor size (T stage, p < 0.001), lymph node stage (N stage, p = 0.008), distant metastasis (M stage, p = 0.001), and American Joint Committee on Cancer (AJCC) stage (p < 0.001) (Table 1). Moreover, EMX2 expression showed a similar relationship with the clinicopathological characteristics of KIRC (Table 1). Further analysis showed that EMX2OS expression was negatively correlated with histological grade (p < 0.001), T stage (p < 0.001), and AJCC stage (p < 0.001) (Figure 1E–1G). To validate the results, we explored the differential expression and prognostic value of EMX2OS and its correlation with EMX2 in pan-cancer data (32 other cancer types) from The Cancer Genome Atlas (TCGA) as an internal validation. Interestingly, EMX2OS expression was significantly lower in many other types of cancers, including breast invasive carcinoma, colon adenocarcinoma, kidney chromophobe, and liver hepatocellular carcinoma, than in normal tissues (Figure 1H). EMX2OS also played a prognostic role in adrenocortical carcinoma, cervical squamous cell carcinoma and endocervical adenocarcinoma, stomach adenocarcinoma, and uveal melanoma (Table 3). Of interest, EMX2OS and EMX2 showed significant correlations in all cancers, except cholangiocarcinoma (Table 3). These results suggest that EMX2OS functions as a tumor suppressor in KIRC.
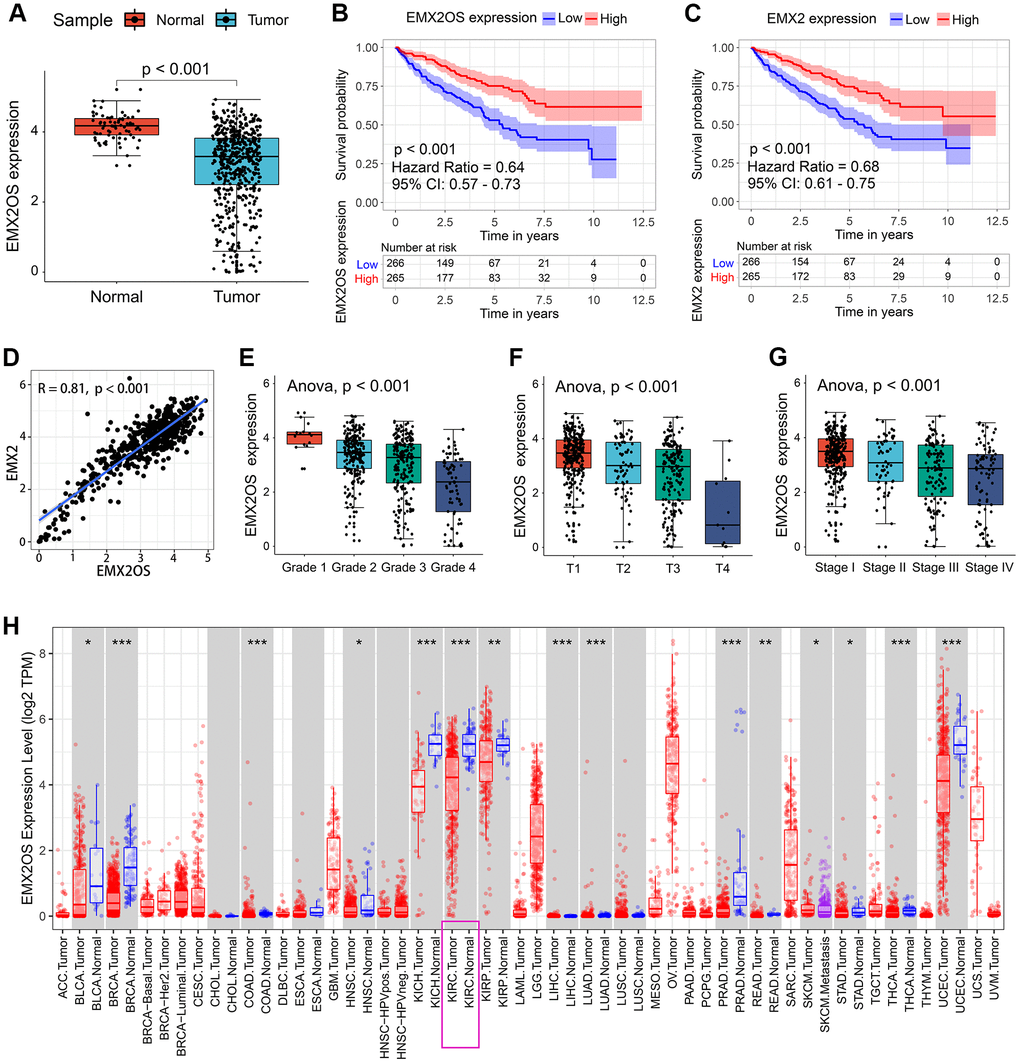
Figure 1. Association between EMX2OS expression and the key clinicopathological characteristics of KIRC. (A) EMX2OS expression was significantly lower in KIRC tissue samples than in normal tissue samples. (B) EMX2OS downregulation was significantly correlated with poorer overall survival in KIRC. (C) EMX2 downregulation was significantly correlated with poorer overall survival in KIRC. (D) Correlation analysis between EMX2OS and its predicted target EMX2. (E) EMX2OS expression significantly decreased with increasing histological grade. (F) EMX2OS expression significantly decreased with increasing tumor size (T stage). (G) EMX2OS expression significantly decreased with advanced AJCC stages. (H) EMX2OS expression in pan-cancer from TIMER database (https://cistrome.shinyapps.io/timer/). KIRC, kidney renal clear cell carcinoma; AJCC, American Joint Committee on Cancer.
Table 3. Kaplan-Meier survival analysis and correlations analysis for EMX2OS and EMX2 in pan-cancer (33 types of cancer from TCGA).
| Abbreviation | Detail | Log-rank test p-value | Correlation coefficient r | Spearman p-value |
| ACC | Adrenocortical carcinoma | 0.002 | 0.844 | < 0.001 |
| BLCA | Bladder Urothelial Carcinoma | 0.083 | 0.952 | < 0.001 |
| BRCA | Breast invasive carcinoma | 0.989 | 0.917 | < 0.001 |
| CESC | Cervical squamous cell carcinoma and endocervical adenocarcinoma | 0.020 | 0.954 | < 0.001 |
| CHOL | Cholangio carcinoma | 0.061 | 0.311 | 0.065 |
| COAD | Colon adenocarcinoma | 0.783 | 0.649 | < 0.001 |
| DLBC | Lymphoid Neoplasm Diffuse Large B-cell Lymphoma | 0.744 | 0.713 | < 0.001 |
| ESCA | Esophageal carcinoma | 0.872 | 0.710 | < 0.001 |
| GBM | Glioblastoma multiforme | 0.226 | 0.924 | < 0.001 |
| HNSC | Head and Neck squamous cell carcinoma | 0.498 | 0.862 | < 0.001 |
| KICH | Kidney Chromophobe | 0.121 | 0.792 | < 0.001 |
| KIRC | Kidney renal clear cell carcinoma | 0.000 | 0.809 | < 0.001 |
| KIRP | Kidney renal papillary cell carcinoma | 0.068 | 0.787 | < 0.001 |
| LAML | Acute Myeloid Leukemia | 0.762 | 0.594 | < 0.001 |
| LGG | Brain Lower Grade Glioma | 0.172 | 0.919 | < 0.001 |
| LIHC | Liver hepatocellular carcinoma | 0.979 | 0.418 | < 0.001 |
| LUAD | Lung adenocarcinoma | 0.359 | 0.514 | < 0.001 |
| LUSC | Lung squamous cell carcinoma | 0.886 | 0.694 | < 0.001 |
| MESO | Mesothelioma | 0.838 | 0.928 | < 0.001 |
| OV | Ovarian serous cystadenocarcinoma | 0.859 | 0.799 | < 0.001 |
| PAAD | Pancreatic adenocarcinoma | 0.634 | 0.793 | < 0.001 |
| PCPG | Pheochromocytoma and Paraganglioma | 0.504 | 0.835 | < 0.001 |
| PRAD | Prostate adenocarcinoma | 0.382 | 0.847 | < 0.001 |
| READ | Rectum adenocarcinoma | 0.829 | 0.703 | < 0.001 |
| SARC | Sarcoma | 0.986 | 0.938 | < 0.001 |
| SKCM | Skin Cutaneous Melanoma | 0.126 | 0.896 | < 0.001 |
| STAD | Stomach adenocarcinoma | 0.002 | 0.762 | < 0.001 |
| TGCT | Testicular Germ Cell Tumors | 0.440 | 0.891 | < 0.001 |
| THCA | Thyroid carcinoma | 0.356 | 0.862 | < 0.001 |
| THYM | Thymoma | 0.141 | 0.746 | < 0.001 |
| UCEC | Uterine Corpus Endometrial Carcinoma | 0.677 | 0.860 | < 0.001 |
| UCS | Uterine Carcinosarcoma | 0.529 | 0.908 | < 0.001 |
| UVM | Uveal Melanoma | 0.013 | 0.808 | < 0.001 |
Independent prognostic value of EMX2OS in KIRC
As Kaplan–Meier survival analysis showed that patients with different EMX2OS expressions had significant different OS, we further explored whether EMX2OS had an independent prognostic value in KIRC using univariate and multivariate Cox regression analyses. Because information on the M stage, N stage, T stage, cancer status, and race were missing or were unevenly distributed in most cases, these data were excluded. Finally, 520 patients with information on age, gender, histological grade, AJCC stage, and EMX2OS expression were included in the Cox regression analysis. We found that there was a significantly prognostic difference between the high-EMX2OS and low-EMX2OS expression groups in both univariate (HR, 0.654; 95%CI, 0.579 - 0.739; p < 0.001) and multivariate (HR, 0.783; 95%CI, 0.684 - 0.896; p < 0.001) Cox regression analysis (Figure 2A, 2B). EMX2OS expression, age, histological grade, and AJCC stage had independent prognostic values in KIRC. Additionally, the stratified analysis revealed that the patients in the low-EMX2OS expression group had significantly poorer OS than those in the high-EMX2OS expression group regarding age ≤ 60 years (p = 0.001), age > 60 years (p < 0.001), male sex (p = 0.002), female sex (p < 0.001), AJCC stage I/II (p = 0.044), AJCC stage III/IV (p = 0.007), and histological grade ¾ (p < 0.001) but not histological grade 1/2 (p = 0.235) (Figure 3A–3D).
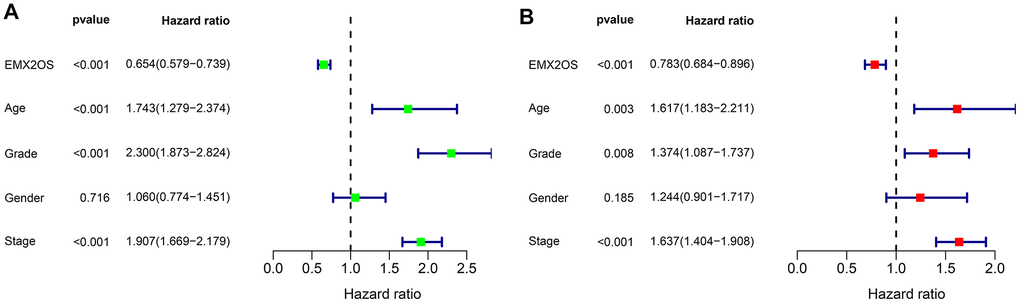
Figure 2. Forest plot of Cox regression analysis in KIRC. (A) Forest plot of univariate Cox regression analysis. (B) Forest plot of multivariate Cox regression analysis.
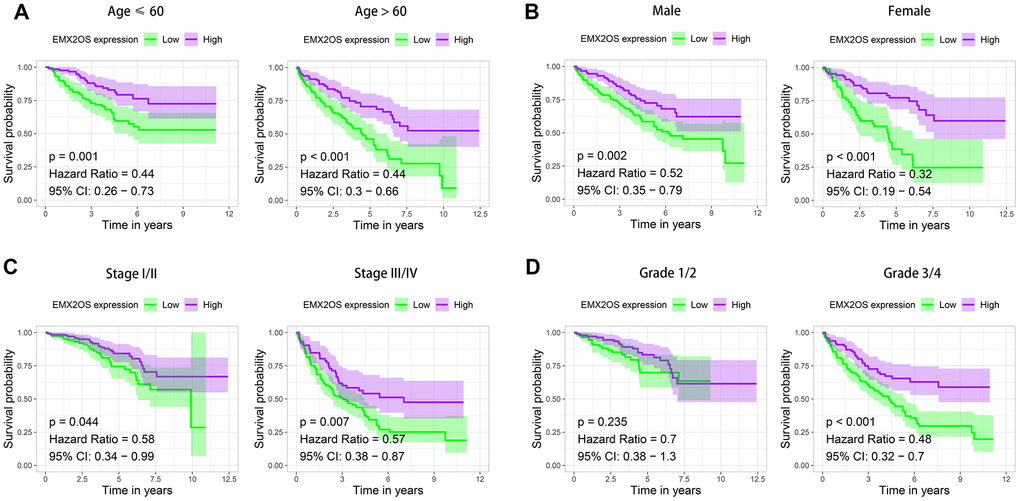
Figure 3. Kaplan–Meier survival analysis of EMX2OS expression according to age, gender, stage, and grade stratification. (A) Age ≤ 60 years and age > 60 years. (B) Male and female. (C) Stage I/II and stage III/IV. (D) Grade 1/2 and grade 3/4.
Determination of EMX2OS and EMX2 levels using RT-qPCR
Quantitative reverse transcription polymerase chain reaction (RT-qPCR) was performed to measure the relative expression of EMX2OS and EMX2 in 12 patients with KIRC. Compared with the matched tumor-free samples, EMX2OS and EMX2 expression levels were downregulated in 91.7% (11 of 12) and 83.3% (10 of 12) of KIRC samples, respectively (Figure 4A). However, compared with normal samples, only EMX2OS was significantly downregulated in KIRC samples (p = 0.013), although it was nearly significantly different for EMX2 (p = 0.054), possibly because of the small sample size (Figure 4B). Additionally, there was an obviously significant positive correlation between EMX2OS and EMX2 in both normal (r = 0.85; p < 0.001) and tumor samples (r = 0.89; p < 0.001) (Figure 4C).
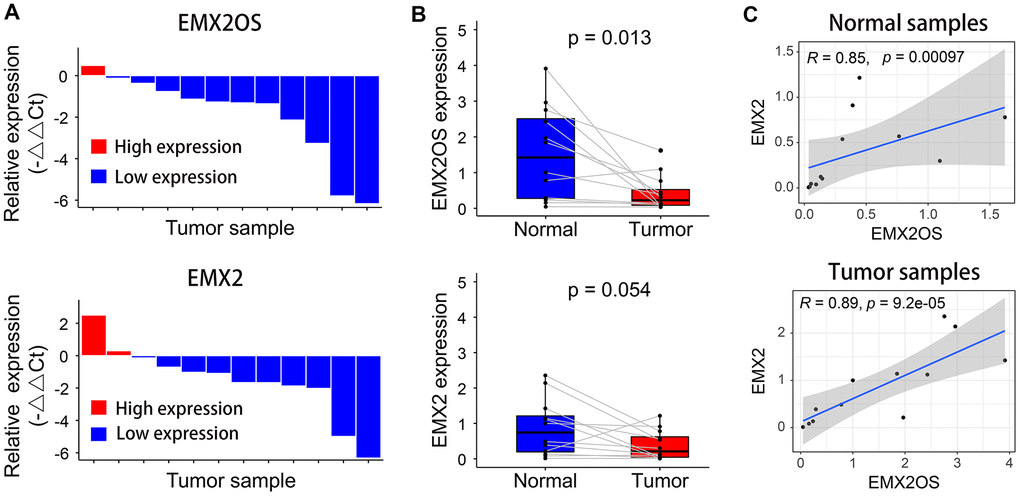
Figure 4. Relative expression levels of EMX2OS and EMX2 in 12 pairs of KIRC and normal samples measured using RT-qPCR. (A) EMX2OS and EMX2 were downregulated in 11 of 12 and 10 of 12 KIRC samples, respectively. (B) Compared with than in normal samples, EMX2OS was significantly downregulated in tumor samples, while no significant difference was found for EMX2. (C) There was a significant positive correlation between EMX2OS and EMX2 in both normal and tumor samples.
Functional enrichment analysis
To further investigate the function of EMX2OS, we identified 2124 significantly co-expressed genes with EMX2OS in KIRC (r > 0.4; p < 0.001) (Supplementary Table 1). Gene Ontology (GO) functional enrichment analysis showed that several catabolic processes, including small molecule, carboxylic acid, and fatty acid catabolic processes, were significantly enriched (Figure 5A). Kyoto Encyclopedia of Genes and Genomes (KEGG) analysis revealed that the metabolism of several important energy substances, including fatty acid, pyruvate, and tryptophan, was enriched. Moreover, FOXO and PPAR signaling pathways were also enriched (Figure 5B).
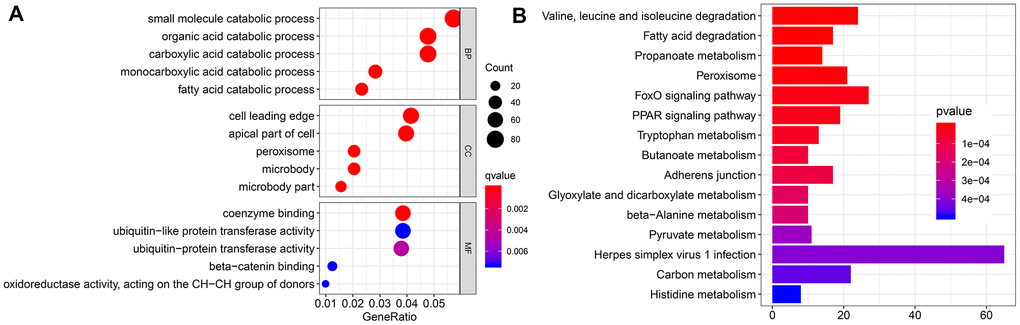
Figure 5. Functional enrichment analysis. (A) Bubble chart shows the result of Gene Ontology (GO) analysis. (B) Bar chart shows the top 15 pathways enriched by Kyoto Encyclopedia of Genes and Genomes (KEGG).
Discussion
The treatment for KIRC remains a challenge across the world because of its substantial morbidity and mortality [18]. Thus, identifying novel markers for prognosis and therapy is needed to improve the survival of patients with KIRC. Recently, with rapid advanced in high-throughput sequencing technology and bioinformatics, more novel biomarkers have been identified. One of the most surprising discoveries is eRNAs. Accumulation evidence has shown that the dysregulation of eRNAs is closely associated with various human diseases and that eRNAs are a new therapeutic target [19–22].
eRNAs are transcribed from putative enhancer regions distinguished by high levels of histone H3 lysine 27 acetylation and histone H3 lysine 4 monomethylation and low levels of histone H3 lysine 4 trimethylation. PreSTIGE is a recently developed algorithm to predict tissue-specific enhancers and their targets based on the H3K4me1 marker and tissue-specific expression of mRNAs [23]. Using this enhancer prediction approach, 2695 eRNAs and their predicted targets were identified in a previous study [17]. As the role of eRNAs had been rarely studied in KIRC, we used these 2695 eRNA– target pairs as candidates to identify key eRNAs in KIRC. Using Kaplan–Meier survival and correlation analyses, EMX2OS was found to be the most survival-associated eRNA with high correlation with its predicted target EMX2.
EMX2OS is a long non-coding RNA, an antisense transcript from EMX2 [24]. EMX2 encodes a homeobox protein and is a vital gene that promotes the formation of the urogenital and central nervous systems during embryonic development [25, 26]. In cancer, EMX2 usually acts as a tumor suppressor [15, 16]. Although rarely reported, we speculate that EMX2OS also serves as a tumor suppressor because of its strong co-expression relationship with EMX2. In this study, we found that EMX2OS was significantly downregulated in KIRC tissues compared with that in normal kidney tissues. EMX2OS downregulation was significantly associated with unfavorable clinicopathological features such as higher histological grade, larger tumor size, lymph node metastasis, distant metastasis, and advanced AJCC stage. Kaplan–Meier survival analysis showed that downregulated EMX2OS expression was significantly associated with poorer OS. Furthermore, multivariate Cox regression analysis confirmed that EMX2OS played an independent prognostic role in KIRC. Additionally, patients with lower EMX2OS expression had significantly poorer OS than patients with higher EMX2OS expression in stratified analysis according to age, gender, and AJCC stage. However, a significant difference in survival was found in patients with histological grade 3/4 but not in those with histological grade 1/2. A possible reason for this difference is that the tumors with low histological grades were relatively less malignant.
To validate the aforementioned results, we used data of 32 other types of cancer from TCGA as internal validation and RT-qPCR analysis of 12 pairs of KIRC and normal real-world samples as external validation. Pan-cancer analysis showed that significant expression and survival differences of EMX2OS existed in several types of cancers. The RT-qPCR results further confirmed the downregulation of EMX2OS in KIRC. All results were consistent and suggested that EMX2OS serves as a tumor suppressor in KIRC.
GO and KEGG functional enrichment analyses provided some clues on how EMX2OS influences patients’ survival. These analyses showed that the metabolism of several energy-involved substances, such as fatty acid and pyruvate, were enriched, which suggests that EMX2OS influences the energy metabolism of the tumor. In the KEGG pathway analysis, FOXO and PPAR signaling pathways were also enriched. The FOXO signaling pathway plays an important role in the regulation of metabolic homeostasis and suppression of tumor growth [27–29]. PPARs are nuclear receptors that regulate cellular and whole-body energy homeostasis during carbohydrate and lipid metabolism, cell growth, and cancer development [30]. Alternatively, energy metabolism reprogramming is an emerging hallmark of cancers [31]. Thus, we speculated that EMX2OS may regulate energy metabolism by enriching the FOXO and PPAR signaling pathways to influence the prognosis of KIRC.
Although this study discovered the potential prognostic value of EMX2OS in KIRC for the first time, several limitations need to be considered. First, our data were mainly sourced from TCGA, and most patients were white. Second, the tissue specimens used for RT-qPCR analyses were limited. Therefore, additional data and samples from different races are necessary to confirm the results of this study. Finally, basic experiments are essential to detect the molecular mechanism of EMX2OS in KIRC.
In conclusion, this study demonstrated that EMX2OS is a key survival-associated eRNA in KIRC. With a potential role in energy metabolism, EMX2OS may be a novel therapeutic target in patients with KIRC.
Materials and Methods
Data extraction and identification of prognostic eRNAs in KIRC
The gene expression profiles and clinical data of KIRC and 32 other types of cancers from TCGA were acquired using the University of California Santa Cruz Xena database (https://xena.ucsc.edu/). We matched the patients’ clinical information and gene expression data. Thus, patients with clinical information and gene expression data were enrolled for further analysis. Next, we obtained a list of eRNAs transcribed from active tissue-specific enhancers and their target predicted using the Predicting Specific Tissue Interactions of Genes and Enhancers (PresSTIGE) method [17, 23]. The association between the level of putative eRNAs and OS of patients with KIRC was investigated using the R packages “survival” and “survminer” (The R Foundation for Statistical Computing, Vienna, Austria). Co-expression analysis was also performed to evaluate the correlation between the level of eRNAs and their predicted targets. Putative eRNAs were considered candidates if they satisfied the following two criteria: significant association with OS (Kaplan–Meier log rank of p < 0.001) and co-expression with the predicted target (r > 0.6 and p < 0.001). Then, we selected the most significant survival-associated eRNA for further analysis. The differential expression between tissues with KIRC and normal tissues was explored. The independent prognostic role of eRNAs in KIRC was investigated. The correlation between the expression level of the selected eRNA and clinicopathological characteristics in KIRC was also assessed. Finally, we validated the results using the pan-cancer data from TCGA (32 other types of cancers) and RT-qPCR results of 12 pairs of KIRC and normal real-world samples as internal and external validations, respectively.
RT-qPCR
RT-qPCR was used to further validate the RNA-sequencing data obtained from TCGA. We collected KIRC tissues and paired adjacent normal tissues from 12 patients who underwent nephrectomies or partial nephrectomies at Meizhou People’s Hospital between 2019 and 2020. Informed consent was obtained from all patients. We extracted total RNA using the TRIzol™ reagent (Waltham, Massachusetts, USA). The PrimeScript RT reagent kit (Takara Bio, Inc., Dalian, China) was used to synthesize complementary DNAs following the manufacturer’s protocols. The SYBR Green PCR kit (Takara Bio, Inc., Dalian, China) was used to conduct quantitative real-time PCR using the ABI 7500 fluorescent quantitative PCR system (Applied Biosystems Inc., Foster City, CA, USA). We used glyceraldehyde 3-phosphate dehydrogenase (GAPDH) as the internal control. The primer sequences were as follows: EMX2OS (forward: GTGACTTGCACAAGGACACAA; reverse: CCTGTCTGGCCATTCCTCT), EMX2 (forward: CGGCACTCAGCTACGCTAAC; reverse: CAAGTCCGGGTTGGAGTAGAC), and GAPDH (forward: ATGACATCAAGAAGGTGGTG; reverse: CATACCAGGAAATGAGCTTG). The expressions of EMX2OS and EMX2 were measured using 2−ΔΔCt method.
Functional enrichment analysis
To determine the underlying molecular mechanisms, we explored the co-expressed genes with the selected eRNA (correlation coefficient r > 0.4, p < 0.001). Then, GO and KEGG analyses were performed.
Statistics
All data processing and statistical analysis were performed using R (version 3.6.1; The R Foundation for Statistical Computing, Vienna, Austria), Strawberry Perl (version 5.30.1.1; http://strawberryperl.com/), and Statistical Package for Social Sciences (version 25.0; IBM, Armonk, New York, USA). Analysis of variance or t-test was used to compare the gene expression level among different subgroups. Spearman’s rank correlation coefficient was used to evaluate the correlation strength. A result was considered statistically significant when the p value was < 0.05, except when stated otherwise.
Supplementary Materials
Author Contributions
HMJ conceived and designed the study, performed the RT-qPCR, and wrote the manuscript. NHC designed the study and revised the manuscript. HBC analyzed the data and revised the manuscript. PW analyzed the data. SDS generated the tables and figures. The authors read and approved the final manuscript.
Acknowledgments
The authors thank TCGA for sharing the sequencing dataset on open access. The authors also thank the related databases for their contribution to facilitate the analyses of TCGA.
Conflicts of Interest
The authors declare that they have no conflicts of interests.
Funding
The work was supported by the Peiyu Project of Meizhou People’s Hospital (Grant/Award No. PY-C2020004).
References
- 1. Shuch B, Amin A, Armstrong AJ, Eble JN, Ficarra V, Lopez-Beltran A, Martignoni G, Rini BI, Kutikov A. Understanding pathologic variants of renal cell carcinoma: distilling therapeutic opportunities from biologic complexity. Eur Urol. 2015; 67:85–97. https://doi.org/10.1016/j.eururo.2014.04.029 [PubMed]
- 2. Siegel RL, Miller KD, Jemal A. Cancer statistics, 2019. CA Cancer J Clin. 2019; 69:7–34. https://doi.org/10.3322/caac.21551 [PubMed]
- 3. Gray RE, Harris GT. Renal cell carcinoma: diagnosis and management. Am Fam Physician. 2019; 99:179–84. [PubMed]
- 4. Padala SA, Barsouk A, Thandra KC, Saginala K, Mohammed A, Vakiti A, Rawla P, Barsouk A. Epidemiology of renal cell carcinoma. World J Oncol. 2020; 11:79–87. https://doi.org/10.14740/wjon1279 [PubMed]
- 5. Martínez-Salamanca JI, Huang WC, Millán I, Bertini R, Bianco FJ, Carballido JA, Ciancio G, Hernández C, Herranz F, Haferkamp A, Hohenfellner M, Hu B, Koppie T, et al, and International Renal Cell Carcinoma-Venous Thrombus Consortium. Prognostic impact of the 2009 UICC/AJCC TNM staging system for renal cell carcinoma with venous extension. Eur Urol. 2011; 59:120–27. https://doi.org/10.1016/j.eururo.2010.10.001 [PubMed]
- 6. Arnold PR, Wells AD, Li XC. Diversity and emerging roles of enhancer RNA in regulation of gene expression and cell fate. Front Cell Dev Biol. 2020; 7:377. https://doi.org/10.3389/fcell.2019.00377 [PubMed]
- 7. Lam MT, Li W, Rosenfeld MG, Glass CK. Enhancer RNAs and regulated transcriptional programs. Trends Biochem Sci. 2014; 39:170–82. https://doi.org/10.1016/j.tibs.2014.02.007 [PubMed]
- 8. Chen H, Du G, Song X, Li L. Non-coding transcripts from enhancers: new insights into enhancer activity and gene expression regulation. Genomics Proteomics Bioinformatics. 2017; 15:201–07. https://doi.org/10.1016/j.gpb.2017.02.003 [PubMed]
- 9. Ding M, Liu Y, Li J, Yao L, Liao X, Xie H, Yang K, Zhou Q, Liu Y, Huang W, Cai Z. Oestrogen promotes tumorigenesis of bladder cancer by inducing the enhancer RNA-eGREB1. J Cell Mol Med. 2018; 22:5919–27. https://doi.org/10.1111/jcmm.13861 [PubMed]
- 10. Liu Y, Ding M, Liao X, Gao Q, He A, Liu B, Hu K, Xie H, Zhou Q, Zhan H, Liu Y, Huang W, Mei H. High expression of enhancer RNA MARC1 or its activation by DHT is associated with the Malignant behavior in bladder cancer. Exp Cell Res. 2018; 370:303–11. https://doi.org/10.1016/j.yexcr.2018.06.032 [PubMed]
- 11. Gu X, Wang L, Boldrup L, Coates PJ, Fahraeus R, Sgaramella N, Wilms T, Nylander K. AP001056.1, a prognosis-related enhancer RNA in squamous cell carcinoma of the head and neck. Cancers (Basel). 2019; 11:347. https://doi.org/10.3390/cancers11030347 [PubMed]
- 12. Fatima R, Choudhury SR, T R D, Bhaduri U, Rao MR. A novel enhancer RNA, Hmrhl, positively regulates its host gene, phkb, in chronic myelogenous leukemia. Noncoding RNA Res. 2019; 4:96–108. https://doi.org/10.1016/j.ncrna.2019.08.001 [PubMed]
- 13. Ding M, Zhan H, Liao X, Li A, Zhong Y, Gao Q, Liu Y, Huang W, Cai Z. Enhancer RNA - P2RY2e induced by estrogen promotes Malignant behaviors of bladder cancer. Int J Biol Sci. 2018; 14:1268–76. https://doi.org/10.7150/ijbs.27151 [PubMed]
- 14. Falcone C, Daga A, Leanza G, Mallamaci A. Emx2 as a novel tool to suppress glioblastoma. Oncotarget. 2016; 7:41005–16. https://doi.org/10.18632/oncotarget.9322 [PubMed]
- 15. Li J, Mo M, Chen Z, Chen Z, Sheng Q, Mu H, Zhang F, Zhang Y, Zhi XY, Li H, He B, Zhou HM. Adenoviral delivery of the EMX2 gene suppresses growth in human gastric cancer. PLoS One. 2012; 7:e45970. https://doi.org/10.1371/journal.pone.0045970 [PubMed]
- 16. Okamoto J, Hirata T, Chen Z, Zhou HM, Mikami I, Li H, Yagui-Beltran A, Johansson M, Coussens LM, Clement G, Shi Y, Zhang F, Koizumi K, et al. EMX2 is epigenetically silenced and suppresses growth in human lung cancer. Oncogene. 2010; 29:5969–75. https://doi.org/10.1038/onc.2010.330 [PubMed]
- 17. Vučićević D, Corradin O, Ntini E, Scacheri PC, Ørom UA. Long ncRNA expression associates with tissue-specific enhancers. Cell Cycle. 2015; 14:253–60. https://doi.org/10.4161/15384101.2014.977641 [PubMed]
- 18. Mitchell TJ, Turajlic S, Rowan A, Nicol D, Farmery JH, O’Brien T, Martincorena I, Tarpey P, Angelopoulos N, Yates LR, Butler AP, Raine K, Stewart GD, et al, and TRACERx Renal Consortium. Timing the landmark events in the evolution of clear cell renal cell cancer: TRACERx renal. Cell. 2018; 173:611–23.e17. https://doi.org/10.1016/j.cell.2018.02.020 [PubMed]
- 19. Mao R, Wu Y, Ming Y, Xu Y, Wang S, Chen X, Wang X, Fan Y. Enhancer RNAs: a missing regulatory layer in gene transcription. Sci China Life Sci. 2019; 62:905–12. https://doi.org/10.1007/s11427-017-9370-9 [PubMed]
- 20. Lewis MW, Li S, Franco HL. Transcriptional control by enhancers and enhancer RNAs. Transcription. 2019; 10:171–86. https://doi.org/10.1080/21541264.2019.1695492 [PubMed]
- 21. Léveillé N, Melo CA, Agami R. Enhancer-associated RNAs as therapeutic targets. Expert Opin Biol Ther. 2015; 15:723–34. https://doi.org/10.1517/14712598.2015.1029452 [PubMed]
- 22. Hamdan FH, Johnsen SA. Perturbing enhancer activity in cancer therapy. Cancers (Basel). 2019; 11:634. https://doi.org/10.3390/cancers11050634 [PubMed]
- 23. Corradin O, Saiakhova A, Akhtar-Zaidi B, Myeroff L, Willis J, Cowper-Sal lari R, Lupien M, Markowitz S, Scacheri PC. Combinatorial effects of multiple enhancer variants in linkage disequilibrium dictate levels of gene expression to confer susceptibility to common traits. Genome Res. 2014; 24:1–13. https://doi.org/10.1101/gr.164079.113 [PubMed]
- 24. Noonan FC, Goodfellow PJ, Staloch LJ, Mutch DG, Simon TC. Antisense transcripts at the EMX2 locus in human and mouse. Genomics. 2003; 81:58–66. https://doi.org/10.1016/s0888-7543(02)00023-x [PubMed]
- 25. Zhao T, Kraemer N, Oldekamp J, Cankaya M, Szabó N, Conrad S, Skutella T, Alvarez-Bolado G. Emx2 in the developing hippocampal fissure region. Eur J Neurosci. 2006; 23:2895–907. https://doi.org/10.1111/j.1460-9568.2006.04819.x [PubMed]
- 26. Miyamoto N, Yoshida M, Kuratani S, Matsuo I, Aizawa S. Defects of urogenital development in mice lacking Emx2. Development. 1997; 124:1653–64. [PubMed]
- 27. Link W, Fernandez-Marcos PJ. FOXO transcription factors at the interface of metabolism and cancer. Int J Cancer. 2017; 141:2379–91. https://doi.org/10.1002/ijc.30840 [PubMed]
- 28. Lee S, Dong HH. FoxO integration of insulin signaling with glucose and lipid metabolism. J Endocrinol. 2017; 233:R67–79. https://doi.org/10.1530/JOE-17-0002 [PubMed]
- 29. Farhan M, Wang H, Gaur U, Little PJ, Xu J, Zheng W. FOXO signaling pathways as therapeutic targets in cancer. Int J Biol Sci. 2017; 13:815–27. https://doi.org/10.7150/ijbs.20052 [PubMed]
- 30. Hong F, Pan S, Guo Y, Xu P, Zhai Y. PPARs as nuclear receptors for nutrient and energy metabolism. Molecules. 2019; 24:2545. https://doi.org/10.3390/molecules24142545 [PubMed]
- 31. Hanahan D, Weinberg RA. Hallmarks of cancer: the next generation. Cell. 2011; 144:646–74. https://doi.org/10.1016/j.cell.2011.02.013 [PubMed]