Submit an Article
Navigate
Home
Editorial Board
Editorial Policies
Current Volume
Archive
Scientific Integrity
Publication Ethics Statements
Interviews with Outstanding Authors
Newsroom
Sponsored Conferences
Podcast
Contact
Special Collections
Submit an Article
Online ISSN: 1945-4589
Research Paper
|
Volume 12, Issue 24
|
pp. 25865–25877
Downregulation of enhancer RNA EMX2OS is associated with poor prognosis in kidney renal clear cell carcinoma
Back to article
Figure 5
(5 of 5)
−
100%
+
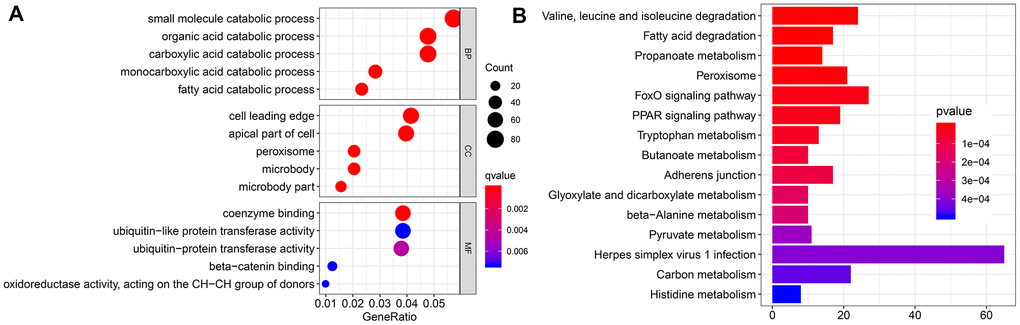
Figure 5.
Functional enrichment analysis.
(
A
) Bubble chart shows the result of Gene Ontology (GO) analysis. (
B
) Bar chart shows the top 15 pathways enriched by Kyoto Encyclopedia of Genes and Genomes (KEGG).