


Introduction
Obesity has become a worldwide health problem, with an incidence that has nearly tripled since 1975 [1]. It is defined as an imbalance between energy intake and expenditure that, when maintained in time, causes a systemic chronic inflammation that degenerates in obesity-associated insulin resistance and type 2 diabetes [2].
Previous studies have shown that one of the mechanisms by which chronic obesity leads to type 2 diabetes is the onset of senescence in certain tissues, such as white adipose or pancreatic β-cells [3–5]. Senescence was first described by Hayflick and Moorhead as an in vitro limited replicative capacity of normal human fibroblasts [6]. Since then, the definition of senescence has evolved significantly, and it is now generally accepted that senescence is a stable proliferative arrest caused by some stresses such as telomere dysfunction, oxidative stress, DNA damage, oncogene activation or cytotoxic drugs [7, 8]. The pathways induced by these stimuli finally converge in a set of senescence genes, the best known of which are the tumor suppressors Cdkn2a-p16, Cdkn2a-p19, Cdkn1b-p27, Cdkn2b-p15 or Cdkn1a-p21, resulting in proliferative arrest [9, 10]. The most frequently used biomarker to detect senescent cells is the lysosomal β-galactosidase enzyme activity at a suboptimal pH 6.0, known as senescence-associated β-galactosidase staining (SA-βGal) [11].
Senescent cells are metabolically active and induce a complex pro-inflammatory program known as senescence-associated secretory phenotype (SASP) composed by proinflammatory cytokines, chemokines and growth factors [12]. In a healthy scenario, SASP acts in both an autocrine and a paracrine manner to create an inflammatory environment that attracts immune cells to clear senescent cells and promote tissue regeneration [13]. However, when maintained chronically, SASP effects can induce several pathologies such as idiopathic pulmonary fibrosis, cystic fibrosis, lung fibrosis, sarcopenia, cataracts, obesity and type 2 diabetes [14]. In particular, during obesity, accumulation of large amounts of fat in adipocytes triggers an inflammatory response [2]. Also, SA-βGal activity and increased protein expression of the senescence markers p53 and p21 have been reported in adipose tissue from obese humans and mice [3].
Baker and collaborators demonstrated for the first time that removal of senescent cells is beneficial for age-related diseases, using a mouse model that specifically eliminates Cdkn2a-p16-positive cells, named INK-ATTAC [15]. In turn, new compounds were discovered that selectively induced apoptosis in senescence cells, that were termed senolytics [16]. The description of the first senolytic treatments by the combination of dasatinib with quercetin in vitro [17], or the inhibitor of the Bcl-2 family of anti-apoptotic proteins navitoclax [18], was followed by many other new, and still less studied senolytic compounds [19–21]. In general, senolytics have been used in mouse models to alleviate senescence-related diseases [16, 22–24]
The use of senolytic compounds has been previously reported for the treatment of type 2 diabetes in mouse models. In particular, the combination of dasatinib and quercetin was used to alleviate metabolic dysfunction in diet-induced obese mice, attaining a reduction in the senescence markers SA-βGal and Cdkn2a-p16, and improved glucose and insulin tolerance tests [25]. Also, treatment with the senolytic navitoclax improved the β-cell function and fasting blood glucose levels in mice rendered diabetic by the insulin receptor antagonist S961, although navitoclax efficacy by glucose and insulin tolerance tests in a diet-induced obesity mouse model was not tested [5].
In our study, we compare in parallel the efficacy of navitoclax and the combination of D/Q in a mouse model of diet-induced obesity. We measure both their senolytic efficacy in white adipose tissue and their beneficial effects in glucose homeostasis. Also, we follow the metabolic phenotyping of our models with time, thus finely determining the time point at which each senolytic treatment is most efficacious. Our results showed that treatment with both navitoclax and D/Q improved insulin sensitivity after three cycles and glucose tolerance after four cycles, but these beneficial effects disappeared after 16 weeks of treatment.
Results
Senolytic treatment strategy of obese and glucose intolerant mice
To generate the mouse model of diet-induced obesity (DIO), we fed a cohort of 32 male mice of the C57BL/6OlaHsd background on a high-fat diet (HFD, 45% fat) for 4 months until they reached obesity. Then, we checked their glucose intolerance using a glucose tolerance test (GTT), and divided these mice in four groups of 8 mice. As shown in Supplementary Figure 1A and 1B, when we controlled for body weight gain or glucose intolerance at this point between the mice belonging to each experimental group, we observed that mice from all groups had evolved similarly until this timepoint. We then began a series of cycles of treatments with two of the best characterized senolytics: navitoclax and D/Q. More precisely, we performed 5 cycles of treatments, each cycle beginning with 5 consecutive days of administration of senolytics and their vehicles by oral gavage, followed by one week of rest, and a final week when we performed one insulin tolerance test (ITT) and one GTT. In total, each cycle lasted 3 weeks. For a detailed scheme, see Figure 1A. During all these cycles, mice were still fed with HFD. After an initial small weight loss during the adaptation to the treatments, that showed no difference between treatment groups, all mice gained weight constantly (Figure 1B). Also, we measured food intake during the first two cycles and did not observe any difference between treatment groups (Figure 1C). These results indicate that the senolytic treatments were not affecting the mouse body weight gain or food intake, thus proving the safety of these treatments in this metabolic scenario.
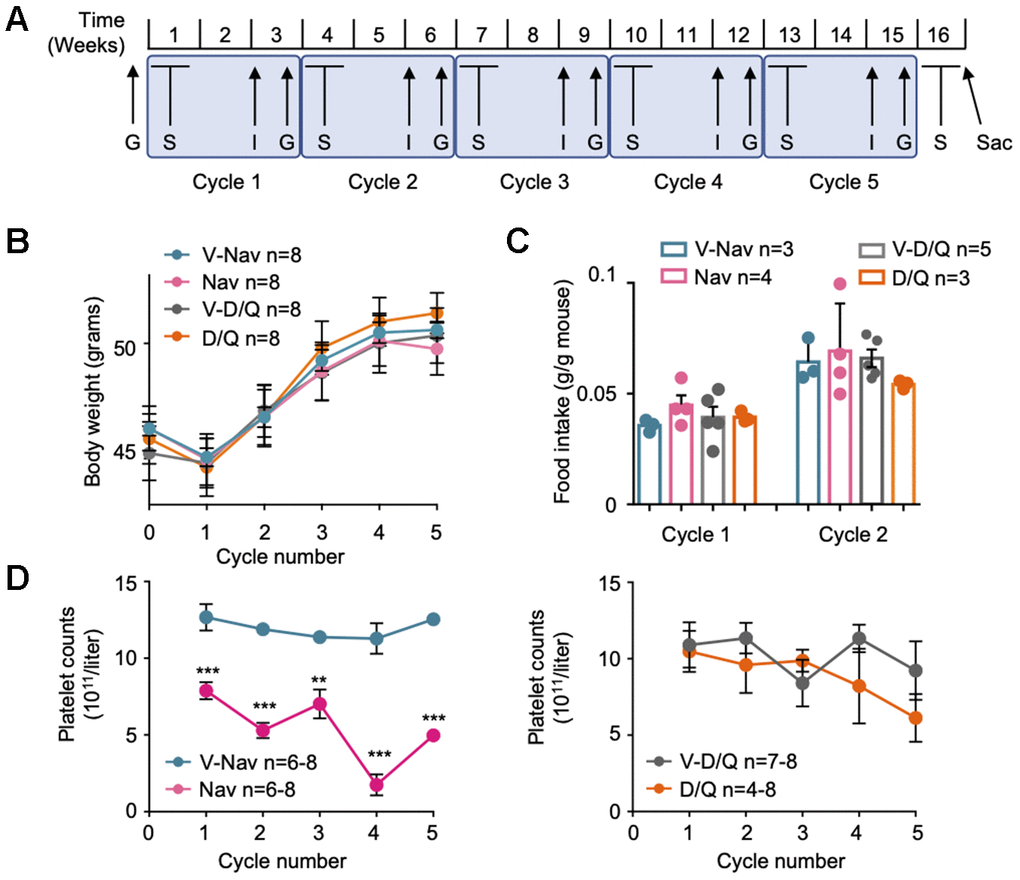
Figure 1. Senolytic treatment strategy. (A) Scheme of the senolytic treatments strategy: C57BL/6HsdOla male mice of 12 weeks of age were fed on 45% HFD for 4 months. Then, 5 cycles of senolytic treatment and glucose homeostasis assessment were undertaken: first, mice were treated daily by oral gavage with the senolytic or its vehicle for 5 consecutive days, and rested for 1 week. The third week of each cycle, an insulin tolerance test (I) and a glucose tolerance test (G) were performed. After the fifth cycle was finished, mice were treated again with senolytics for 5 consecutive days by oral gavage, and sacrificed at the fifth day of treatment (Sac). (B) Mouse body weight at the first day of every senolytic treatment, indicated for each of the 5 cycles. (C) Food intake recorded at cycles 1 and 2. (D) Blood samples were collected every fifth day of each cycle of senolytic treatments, right after the last oral administration, and platelet counts were determined. V-Nav: vehicle for navitoclax. Nav: navitoclax. V-D/Q: vehicle for dasatinib/quercetin. D/Q: dasatinib/quercetin. Bars and dots represent the average of the indicated number of mice. Error bars represent the standard error of the mean (s.e.m.). Statistical significance was assessed using the two-way ANOVA test with Sidak’s correction for multiple comparisons (B); the one-way ANOVA test with Tukey’s correction for multiple comparisons (C); or the unpaired two-tailed Student's t-test (D). **, p<0.01; ***, p<0.001.
Finally, we verified the effectiveness of navitoclax treatment by following the blood platelet counts during all the cycles. As reported before for mice [26] and humans [27], blood platelet counts measured at the fifth day of navitoclax treatment by oral gavage were significantly decreased, compared with their corresponding control group and with the D/Q mixture and its control (Figure 1D), thus proving that navitoclax was effective in our model system.
Efficacy of senolytic treatments in mouse models of obesity
After finishing the 5 cycles of treatment and metabolic phenotyping, we treated again with senolytics for 5 consecutive days by oral gavage and sacrificed right after the last treatment. We focused on perigonadal white adipose tissue (pWAT), because this tissue has been reported to present the most evident induction of senescence after obesity onset [3, 25]. We checked the efficacy of our senolytic treatments by measuring different senescence markers. First, we performed a whole-mount staining for SA-βGal, one of the best described senescence biomarkers [11]. As shown in Figures 2A–2C, after the last 5 days of treatment once all cycles had been finished, pWAT from vehicle-treated mice showed a strong staining for SA-βGal, while treatment with both navitoclax and D/Q significantly reduced the SA-βGal staining. We did not observe any significant changes in the weight of several tissues from these mice, indicating that the senolytic treatments did not induce apparent macroscopic tissue changes (Supplementary Figure 1C). We finally checked the mRNA expression of a number of senescence markers, including the tumor suppressors Cdkn2a-p16, Cdkn2a-p19 and Cdkn1a-p21; and the senescence-associated cytokines Il6, Tnf and Il1b. We observed significant reductions in the pWAT expression of the senescence markers Cdkn2a-p16 and Cdkn2a-p19 after treatment with D/Q, but navitoclax-treated pWAT did not reduce the levels of any of these tumor suppressors. Also, we observed a clear but not significant tendency to reduced expression in the inflammation genes Il6, Il1b and Tnf for both treatments (Figure 2D).
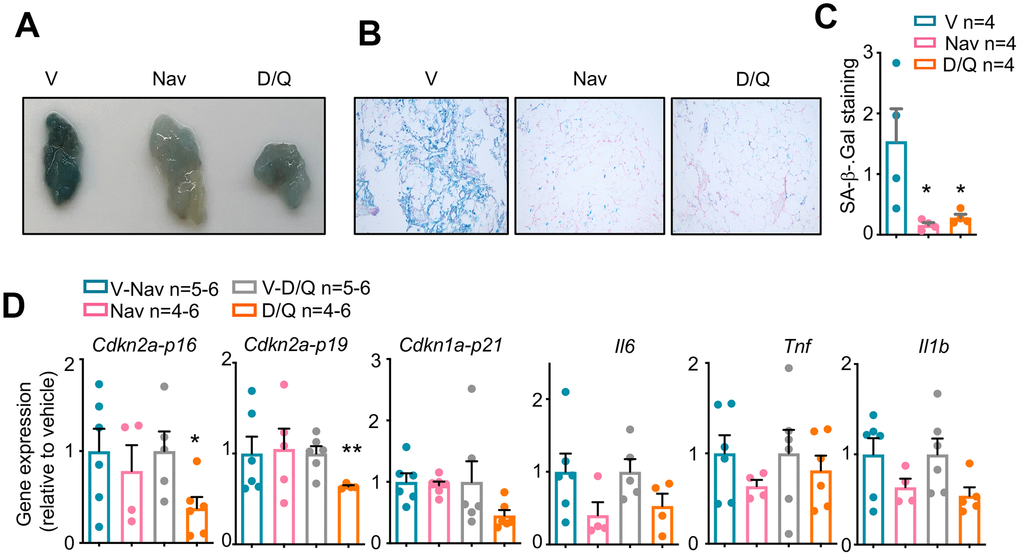
Figure 2. Senescence markers in DIO-mice after senolytic treatment. (A) Macroscopic view of perigonadal white adipose tissue (pWAT) from mice treated with the 5 cycles of senolytics and stained for senescence-associated β-Galactosidase (SA-β-Gal) activity. V: vehicle. Nav: navitoclax. D/Q:dasatinib/quercetin. (B) Microscopic images of the same pWATs shown in (A). (C) Quantification of the blue area, positive for SA-βGal, of 6 fields per condition from the pWATs shown in (A) and (B). (D) mRNA expression analysis of the indicated genes in pWAT obtained at the day of sacrifice. Statistical significance was assessed using the one-way ANOVA test with Tukey's correction for multiple comparisons (C) or the two-tailed unpaired Student's t-test between each treatment and its control (D) Asterisks refer to the comparison with the corresponding vehicle-treated mice. *, p<0.05; **, p<0.01.
Glucose metabolism in mice treated with senolytics
As shown in Figure 2, both senolytic treatments had been effective in reducing senescence markers in the pWAT. To determine the metabolic effects of these treatments, we performed an insulin tolerance test (ITT) followed by a glucose tolerance test (GTT) during the third week of each cycle, after more than one week of rest from the senolytic treatments. Interestingly, GTTs were improved in mice treated with either navitoclax (Figure 3A) or D/Q (Figure 3C) when compared with their respective control-treated mice during cycle 4, but showed no difference in previous or following cycles (Supplementary Figure 1D and 1F). In turn, ITTs in mice treated with either navitoclax (Figure 3B) or D/Q (Figure 3D) also were improved during the cycle 3, preceding the GTT improvement; and were not affected in previous or following cycles (Supplementary Figure 1E, 1G). These results indicate that both senolytic treatments induced a transient improvement in glucose homeostasis after 3-4 cycles of treatments, that disappeared even if senolytic treatments were continued.
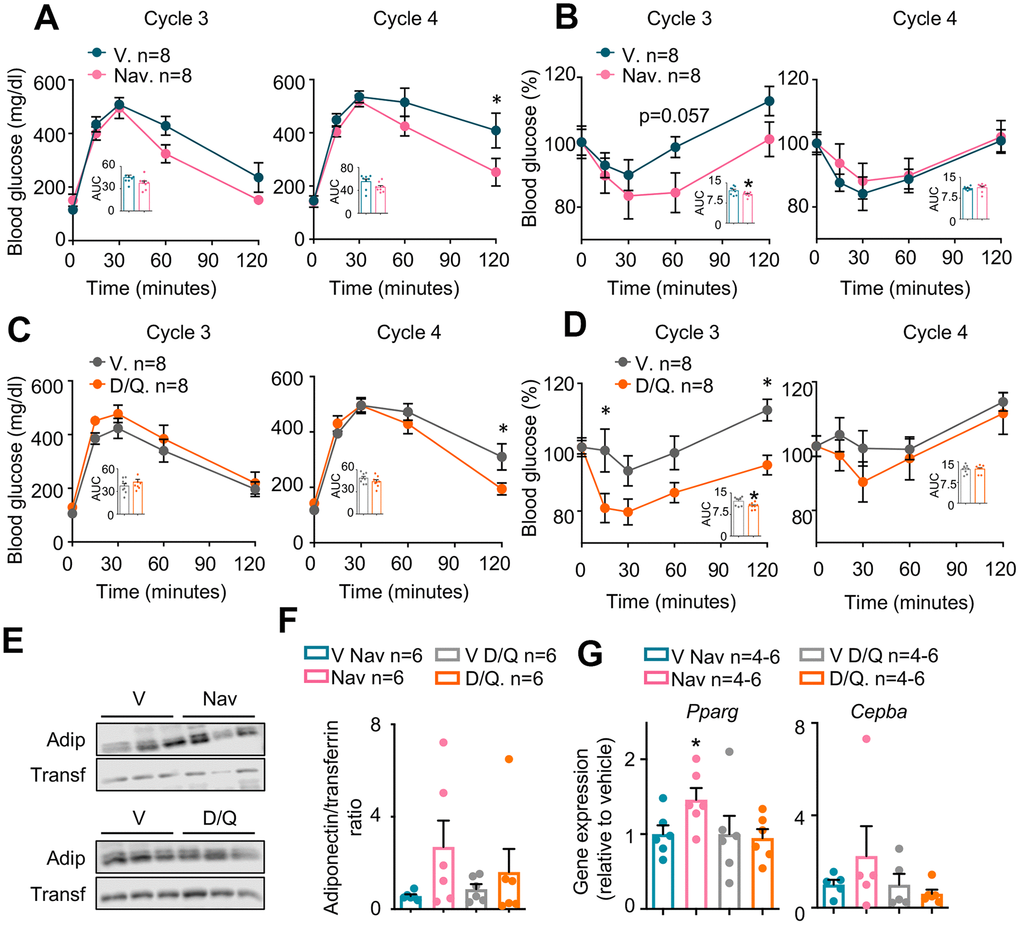
Figure 3. Metabolic phenotyping of mice treated with senolytics. Glucose (A and C) and insulin (B and D) tolerance tests performed at the indicated cycles. The area under the curve (AUC) was calculated for each experiment and represented in the insets. (E) Representative examples (n=3 from a total of n=6) of Western blots of the indicated proteins from plasma obtained at cycle 4 from the same mice shown in (A–D). (F) Quantification of Western blots for adiponectin, including those represented in (E), from all available plasma samples from mice shown in (A–D) (n=6). (G) mRNA expression analysis of the indicated genes in pWAT obtained at the day of sacrifice. Bars and dots represent the average of the indicated number of mice per group. Error bars represent the standard error of the mean. Statistical significance was assessed by the two-way ANOVA test with Sidak’s correction for multiple comparisons for the time course experiments (main graphs at A–D); and with the two-tailed unpaired Student's t-test for the AUC data (A–D) and for panels E and F. Asterisks refer to the comparison with the corresponding vehicle-treated mice. *, p<0.05.
To further characterize the metabolic effects of navitoclax and D/Q in obese mice, we measured the plasma levels of the adipokine adiponectin, that has been extensively reported to be decreased in diabetic individuals both in mice [28] and in humans [29]. In particular, we measured plasma adiponectin at the last day of senolytic administration at the cycle 4 (where GTTs were most clearly improved, see Figure 3A and 3C). As shown in Figure 3E, 3F, there was a clear tendency in both senolytic treatments to increase plasma adiponectin, especially with navitoclax treatment, although these differences were not significant. Expression of the adipogenic genes Pparg and Cebpa at pWAT has been shown to correlate with insulin sensitivity [30, 31]. We thus measured the gene expression of Pparg and Cebpa, and observed no change in the D/Q-treated tissues, but an increased expression of these two markers in pWAT of navitoclax-treated mice, that reached significance in the case of Pparg (Figure 3G).
Discussion
Previous studies have reported that senescence plays an important role in obesity [32], obesity-induced anxiety and impaired neurogenesis [33] and in type 2 diabetes [3, 4]. As a consequence, removal of senescent cells either genetically (in the INK-ATTAC mouse model) or by senolytic treatments, has been proposed as an efficient therapy against senescence-related diseases [15, 33–35]. In 2019, two publications demonstrated that senescent cells removal by treatment with D/Q [25] or navitoclax [5] improved the glucose homeostasis in mouse models of type 2 diabetes.
In our work, we have studied the metabolic effect of the long-term treatment with navitoclax or D/Q in a diet-induced obesity mouse model. Although our experiments included only a limited amount of mice, our data clearly show that both senolytic treatments did not affect body weight (Figure 1B), food intake (Figure 1C), or tissue weight (Supplementary Figure 1C). In contrast, we observed the same body weight gain in both treatments, parallel to their respective vehicle controls, indicating that none of them prevented body weight gain with high fat diet (Figure 1B). Previous reports showed that HFD induced senescence most evidently in pWAT [25, 32, 36]. Confirming these findings, we observed a reduction in whole mount SA-βGal staining in pWAT after 5 cycles of both senolytic treatments (Figure 2A–2C), as previously described for D/Q in pWAT [25]. In addition, we showed for the first time that navitoclax also efficiently reduced SA-βGal activity in pWAT. We also analyzed pWAT mRNA expression of the senescence markers Cdkn2a-p16, Cdkn2a-p19 and Cdkn1a-p21, and confirmed previous reports showing a reduced Cdkn2a-p16 expression after D/Q treatment [25]. In addition, we also observed for the first time a significant reduction of the expression of Cdkn2a-p19 in pWAT after D/Q treatment. In contrast and to our surprise, in the case of navitoclax we did not observe changes in these senescence markers. These results are in agreement with previous reports, where treatment with navitoclax in insulin insensitive mice did not elicit any change of Cdkn2a-p16 nor Cdkn1a-p21 in pWAT [5]. This indicates that these two senolytic treatments follow different molecular pathways. In addition, we observed that both senolytics induced a non-significant but evident reduction in the mRNA expression of the SASP factors Il6, Tnf and Il1b, proposed as mediators of insulin resistance [4, 37].
We then analyzed glucose and insulin sensitivity to measure the diabetic profile in our mice after every senolytic cycle. We observed a different behavior of between mice treated with each type of vehicle at the ITT experiments from cycle 3 (Figure 3B, 3D, Supplementary Figure 1E and 1G), probably due to the different composition of both vehicles (15% DMSO + 15% PEG 400 for navitoclax; and 10% PEG 400 for D/Q). In any case, the improved insulin sensitivity of the senolytic-treated mice observed in cycle 3 disappears in later cycles, independently of their vehicles. Therefore, according to our statistically significant results from GTT and ITTs, we conclude that there is a transient improvement in glucose homeostasis in senolytic-treated mice that peaks around cycles 3 and 4. In addition, our data coincide in intensity and time of appearance with previous reports with D/Q [5, 25] (Figure 3A–3D). Navitoclax treatment has already been shown to improve blood fasting glucose levels in a pharmacological type 2 diabetes model of treatment with the insulin receptor antagonist S961 [5]; but it had never been tested with a mouse model of DIO, as presented here. Also, at the fourth cycle we observed a tendency to increased blood adiponectin, an adipokine previously described as an enhancer of insulin sensitivity [38]. In addition, we observed in pWAT after the 5 treatment cycles an increased expression of the adipocyte markers Pparg and Cebpa, both crucial for a proper adipocyte differentiation and insulin sensitivity [30, 31, 39, 40]. These beneficial effects were more evident in the navitoclax-treated mice, although they only reached significance in the case of Pparg (Figure 3G).
In addition, our results also extend the glucose metabolism studies to 5 cycles of treatment, spanning 16 weeks, and demonstrate that GTT and ITT improvements are only apparent during a short period of time, and are lost in subsequent treatments (Supplementary Figure 1D–1G). These data suggest that senolytic chronic treatments exert a transient effect in glucose sensitivity, that peaks after several weeks of treatment but diminishes with time. From our data we can only speculate about the reasons of this transient effect. First, the doses of senolytics can be optimized to increase their beneficial effects on glucose intolerance, although the thrombocytopenia elicited by navitoclax (Figure 1D) strongly limits the maximum dose. Also, senolytics were administered daily for 5 days, and the ITT and GTT were only performed 10 days after the last oral gavage. This delay, intended to allow for recovery from the senolytic treatments, can also have obscured the physiological effects of these treatments. Finally, from a clinical perspective, the use of senolytics to treat insulin insensitivity should be accompanied by nutritional interventions reducing fat and carbohydrates intake. Instead, mice shown here were kept on high-fat diet throughout all the treatment with senolytics. We hypothesize that this nutrient overload, when kept in time, can reduce the efficacy of the treatments with senolytics. Future research should discern whether the combination of senolytics with nutritional interventions, which would mimic more closely the intended clinical scenario, is more effective against diabetes.
Altogether, our experiments comparing navitoclax and D/Q in obese, diabetic mice show that both treatments are effective in improving several metabolic markers, as glucose and insulin tolerance tests, adipogenic genes or blood adiponectin. However, these beneficial effects are only apparent during a short period of time and disappear later, at least for glucose and insulin tolerance. These results clearly show that senolytic administration is a promising strategy for the treatment of obesity and diabetes. In our case, we have established very restrictive treatment conditions, maintaining the high-fat diet throughout all the senolytic treatment, and treating only for 5 days every three weeks. Based on our work, we hypothesize that treatment with different drug doses and/or increased frequency of senolytic treatments, together with diet management, could constitute a potent and safe strategy for these conditions in mice and humans.
Materials and Methods
Animal experimentation
Animal experimentation at the CNIO, Madrid, was performed according to protocols approved by the CNIO-ISCIII Ethics Committee for Research and Animal Welfare (CEIyBA number CBAO6_2018).
Diet-induced obesity
A cohort of 32 male mice of C57BL/6HsdOla background of 12 weeks of age were induced to develop diet-induced obesity (DIO) by feeding them during 4 months on irradiated 45% high fat diet (HFD, Research Diets, D12451). During this time, body weight was recorded every two weeks. After these 4 months on HFD, a glucose tolerance test was performed to confirm glucose intolerance.
Treatment cycles: senolytic treatments and metabolic assays
Obese, glucose intolerant mice were divided in cohorts of 8 animals with the same body weight average between groups, and housed in cages of 1-3 mice per cage (4 cages for navitoclax animals; 3 cages for navitoclax vehicle; 3 cages for D/Q animals; and 5 cages for D/Q vehicle). At the beginning of each cycle, mice were weighed (this body weight record is shown at Figure 1B) and treated by oral gavage with either navitoclax (MedChemExpress, HY-10087; 50 mg/kg dissolved in 15% DMSO and 15% PEG 400); with a mixture of dasatinib (MedChemExpress, HY-10181; 5 mg/kg dissolved in 10% PEG 400), and quercetin (MedChemExpress, HY-18085; 50 mg/kg dissolved in 10% PEG 400); or with their corresponding vehicles (15% DMSO and 15% PEG 400 for navitoclax, or 10% PEG 400 for D/Q). A total of 5 cycles of treatment were performed. In each cycle, senolytic treatment was given for 5 consecutive days, followed by two weeks of no senolytic treatment, during which metabolic experiments were performed.
Food intake, recorded during the first two cycles of treatment, is expressed as the average of the food eaten by each mouse in a given treatment, calculated as the total food eaten in each cage, divided by the number of mice in that cage. all the cages of a given treatment
For glucose metabolism assays, on the first day of the third week of each cycle, an insulin tolerance test (ITT) was performed by intraperitoneal injection of 0.75 U/kg insulin dissolved in saline (Insulin Humulina 100 U/ml, Lilly). 2 days later a glucose tolerance test (GTT) was performed: mice were fasted from 17:00 hours until the next day at 10:00 hours (17 hours of fasting), and then injected intraperitoneally with 2 g/kg dextrose (Sigma, G7021) dissolved in water. For both ITT and GTT, blood glucose levels were measured from an incision in the tail 0, 15, 30, 60 and 120 minutes after insulin or glucose injection using a portable glucometer (Menarini Diagnostics).
For hemograms, blood samples were collected from each mouse at each cycle by submandibular bleeding in EDTA-coated tubes after the last senolytic oral gavage. Platelet numbers (PLT 1011/liter) were measured in a Laser Cell blood counter (CVM veterinary diagnostic).
Laboratory experimentation
Senescence-associated β-galactosidase staining
We modified a senescence-associated β-galactosidase (SA-βGal) staining protocol from Nature protocols [41]. Briefly, frozen pWAT was sectioned and then fixed at room temperature for 1 hour in 2% formaldehyde / 0.2% glutaraldehyde, washed twice with washing solution (PBS, 2 mM MgCl2 pH 6.0), and incubated for 6 hours at 37ºC with SA-βGal solution (20 mg/ml X-Gal in dimethylformamide; 100 mM K4[Fe(CN)6]; 100 mM K3[Fe(CN)6]; 150 mM NaCl in PBS; 2 mM MgCl2 pH 6.0). All these components were purchased from Sigma. After this incubation, macroscopic images were taken to determine differences between vehicle and treatment. Incubation in SA-βGal solution was then continued for 20 extra hours, and then tissues were washed twice with PBS and dehydrated with increasing EtOH concentrations (30% for 15 minutes, and then 70% for 30 minutes). Samples were then kept in 70% EtOH until embedded in paraffin, sectioned and counterstained with nuclear fast red for microscope image acquisition. Analysis of SA-βGal staining were performed from 6 fields per animal using the ImageJ software.
Quantitative real-time PCR
RNA from pWAT tissue was isolated using TRI Reagent (MRC, TR-118) according to manufacturer’s instructions. After nanodrop quantification, 1 μg of total RNA was retrotranscribed into cDNA using High Capacity cDNA reverse transcription kit (Applied biosystems, 4368814). Quantitative real-time PCR was performed using SYBR green PCR master mix (Promega, A6002). Relative RNA expression was normalized using the Actb and 36b4 housekeeping genes.
Primer sequences are: Mm-β-actin Fwd: GGACCACACCTTCTACAATG; Rvs: GTGGTGGTGAAGCTGTAGCC; Mm-36b4 Fwd: AGATTCGGGATATGCTGTTGG; Rvs: AAAGCCTGGAAGAAGGAGGTC; Mm-Cdkn2a-p16 Fwd: TACCCCGATTCAGGTGAT; Rvs: TTGAGCAGAAGAGCTGCTACGT; Mm- Cdkn2a-p19 Fwd: GCCGCACCGGAATCCT; Rvs: TTGAGCAGAAGAGCTGCTACGT; Mm-Cdkn1a-p21 Fwd: TCCACAGCGATATCCAGACA; Rvs: GGACATCACCAGGATTGGAC; Mm-Il6 Fwd: GTTCTCTGGGAAATCGTGGA; Rvs: GGTACTCCAGAAGACCAGAGGA; Mm-Tnf Fwd: GCCTCTTCTCATTCCTGCTT; Rvs: CTCCTCCACTTGGTGGTTTG; Mm-Il1b Fwd: AAAAGCCTCGTGCTGTCG; Rvs: AGGCCACAGGTATTTTGTCG; Mm-Cebpa Fwd: CCGGGAGAACTCTAACTC; Rvs: GATGTAGGCGCTGATGT; Mm-Pparg Fwd: AGGCCGAGAAGGAGAAGCTGTTG; Rvs: TGGCCACCTCTTTGCTCTGCTC.
Measurement of blood adiponectin and transferrin
Blood samples obtained from submandibular bleeding on the last day of senolytic administration at cycle 4 were collected in EDTA tubes. Plasma was obtained after centrifugation at 4000xg for 5 minutes. Protein extracts were prepared diluting the blood 1:10 in lysis buffer (50 mM Tris pH 7.4; 150 mM NaCl; 0.5% NP-40; 1mM phenyl-methyl-sulfonyl fluoride; protease inhibitors cocktail (Sigma-Aldrich P8340); 1mM NaF; and 10mM sodium orthovanadate).
We performed sodium dodecyl sulfate polyacrylamide gel electrophoresis (SDS-PAGE) of 10 μg of total protein extracts using 10% polyacrylamide mini-gels. The proteins were transferred to nitrocellulose membranes and incubated for one hour at RT in blocking buffer (5% skimmed milk in Tris-buffered saline (TBS); 0.1% Tween-20 (TBS-T)). The primary antibody was hybridized overnight at 4ºC in 5% BSA, TBS-T using antibodies against adiponectin (1:1000, Abcam, ab22554) or transferrin (1:1000, Santa Cruz, sc373785). Then, membranes were washed three times in TBS-T and incubated in 5% skimmed milk with a secondary fluorescence anti-mouse antibody (1:20.000, LICOR, goat anti-mouse c50113). Band quantification was performed in an Odyssey Fc detector. Band intensity was quantified using the ImageJ software, and the adiponectin/transferrin ratio was calculated.
Statistical analysis
Statistical analyses were performed using GraphPad Prism 6.01 for Windows. Precise statistical tests are specified at each figure legend. Data was collected for as many samples/mice as possible, although technical limitations reduced the number of replicates in some assays. Statistical outliers were identified using the ROUT method with Q=1% (GraphPad). Differences between two groups were analyzed using the two tailed Student’s t-test. Differences between three or more groups were analyzed using One-way ANOVA with Tukey’s correction for multiple comparisons. Differences between three or more groups defined in more than one variable were analyzed using Two-way ANOVA with Sidak´s correction for multiple comparisons. All analyses were performed as paired or unpaired tests, depending on the type of analyzed samples.
Supplementary Materials
Author Contributions
AS-R designed, performed and analyzed most experiments, and participated in the manuscript writing. JLL-A and LFCM participated in the performance of the mouse experiments. AP participated in the image analysis and the adiponectin quantification. MB participated in the design and analysis of mouse experiments. PJ-FM designed the project, designed and analyzed all the experiments, and wrote the manuscript.
Acknowledgments
We heartfully thank all the members of the Metabolic Syndrome Group, in particular Andrés Pastor, Cristina Pantoja and Ildefonso Rodríguez, for their constant help and support. We also thank Manuel Serrano for his always generous manuscript corrections and suggestions. From the CNIO, we thank Concepción Timón, Isabel Blanco and Gema Luque from the Animal Facility; Patricia González, Verónica Neva and Gabino Hernández from the Histopathology Unit; and Fernando Peláez, Susana Llanos, Rosa Serrano and Alejo Efeyan, for their kind help with experiments and logistics. We also thank Daniel Muñoz Espín and Jose Alberto López Dominguez for their valuable help in the SA-βGal staining and pWAT protocols.
Conflicts of Interest
The authors declare no conflicts of interest.
Funding
AR-S was supported by the Madrid County (PEJD-2017-PRE/BMD-4561) and by IMDEA Food. JLL-A was supported by the MICINN (PTA2017-14689-I). LFC-M was supported by the FCT Foundation (FCT-MCTES, SFRH/BD/124022/2016). AP was supported by the AECC (SIRTBIO). MB was supported by IMDEA Food. Work in the laboratory of PJFM was funded by the IMDEA Food Institute, the Ramón Areces Foundation (CIVP18A3891), the AECC (SIRTBIO), the MICINN (SAF2017-85766-R) and a Ramon y Cajal Fellowship (MICINN, RYC-2017-22335).
References
- 1. World Health Organization. WHO - Obesity and overweight. 2020. https://www.who.int/en/news-room/fact-sheets/detail/obesity-and-overweight.
- 2. Sun S, Ji Y, Kersten S, Qi L. Mechanisms of inflammatory responses in obese adipose tissue. Annu Rev Nutr. 2012; 32:261–86. https://doi.org/10.1146/annurev-nutr-071811-150623 [PubMed]
- 3. Minamino T, Orimo M, Shimizu I, Kunieda T, Yokoyama M, Ito T, Nojima A, Nabetani A, Oike Y, Matsubara H, Ishikawa F, Komuro I. A crucial role for adipose tissue p53 in the regulation of insulin resistance. Nat Med. 2009; 15:1082–87. https://doi.org/10.1038/nm.2014 [PubMed]
- 4. Palmer AK, Tchkonia T, LeBrasseur NK, Chini EN, Xu M, Kirkland JL. Cellular senescence in type 2 diabetes: a therapeutic opportunity. Diabetes. 2015; 64:2289–98. https://doi.org/10.2337/db14-1820 [PubMed]
- 5. Aguayo-Mazzucato C, Andle J, Lee TB
Jr , Midha A, Talemal L, Chipashvili V, Hollister-Lock J, van Deursen J, Weir G, Bonner-Weir S. Acceleration of β cell aging determines diabetes and senolysis improves disease outcomes. Cell Metab. 2019; 30:129–42.e4. https://doi.org/10.1016/j.cmet.2019.05.006 [PubMed] - 6. Hayflick L, Moorhead PS. The serial cultivation of human diploid cell strains. Exp Cell Res. 1961; 25:585–621. https://doi.org/10.1016/0014-4827(61)90192-6 [PubMed]
- 7. Collado M, Serrano M. The power and the promise of oncogene-induced senescence markers. Nat Rev Cancer. 2006; 6:472–76. https://doi.org/10.1038/nrc1884 [PubMed]
- 8. Hernandez-Segura A, Nehme J, Demaria M. Hallmarks of cellular senescence. Trends Cell Biol. 2018; 28:436–53. https://doi.org/10.1016/j.tcb.2018.02.001 [PubMed]
- 9. Rayess H, Wang MB, Srivatsan ES. Cellular senescence and tumor suppressor gene p16. Int J Cancer. 2012; 130:1715–25. https://doi.org/10.1002/ijc.27316 [PubMed]
- 10. Chicas A, Wang X, Zhang C, McCurrach M, Zhao Z, Mert O, Dickins RA, Narita M, Zhang M, Lowe SW. Dissecting the unique role of the retinoblastoma tumor suppressor during cellular senescence. Cancer Cell. 2010; 17:376–87. https://doi.org/10.1016/j.ccr.2010.01.023 [PubMed]
- 11. Dimri GP, Lee X, Basile G, Acosta M, Scott G, Roskelley C, Medrano EE, Linskens M, Rubelj I, Pereira-Smith O. A biomarker that identifies senescent human cells in culture and in aging skin in vivo. Proc Natl Acad Sci USA. 1995; 92:9363–67. https://doi.org/10.1073/pnas.92.20.9363 [PubMed]
- 12. Coppé JP, Desprez PY, Krtolica A, Campisi J. The senescence-associated secretory phenotype: the dark side of tumor suppression. Annu Rev Pathol. 2010; 5:99–118. https://doi.org/10.1146/annurev-pathol-121808-102144 [PubMed]
- 13. Tchkonia T, Zhu Y, van Deursen J, Campisi J, Kirkland JL. Cellular senescence and the senescent secretory phenotype: therapeutic opportunities. J Clin Invest. 2013; 123:966–72. https://doi.org/10.1172/JCI64098 [PubMed]
- 14. Muñoz-Espín D, Serrano M. Cellular senescence: from physiology to pathology. Nat Rev Mol Cell Biol. 2014; 15:482–96. https://doi.org/10.1038/nrm3823 [PubMed]
- 15. Baker DJ, Wijshake T, Tchkonia T, LeBrasseur NK, Childs BG, van de Sluis B, Kirkland JL, van Deursen JM. Clearance of p16Ink4a-positive senescent cells delays ageing-associated disorders. Nature. 2011; 479:232–36. https://doi.org/10.1038/nature10600 [PubMed]
- 16. Kirkland JL, Tchkonia T, Zhu Y, Niedernhofer LJ, Robbins PD. The clinical potential of senolytic drugs. J Am Geriatr Soc. 2017; 65:2297–301. https://doi.org/10.1111/jgs.14969 [PubMed]
- 17. Zhu Y, Tchkonia T, Pirtskhalava T, Gower AC, Ding H, Giorgadze N, Palmer AK, Ikeno Y, Hubbard GB, Lenburg M, O’Hara SP, LaRusso NF, Miller JD, et al. The achilles’ heel of senescent cells: from transcriptome to senolytic drugs. Aging Cell. 2015; 14:644–58. https://doi.org/10.1111/acel.12344 [PubMed]
- 18. Zhu Y, Tchkonia T, Fuhrmann-Stroissnigg H, Dai HM, Ling YY, Stout MB, Pirtskhalava T, Giorgadze N, Johnson KO, Giles CB, Wren JD, Niedernhofer LJ, Robbins PD, Kirkland JL. Identification of a novel senolytic agent, navitoclax, targeting the bcl-2 family of anti-apoptotic factors. Aging Cell. 2016; 15:428–35. https://doi.org/10.1111/acel.12445 [PubMed]
- 19. Liu X, Wang Y, Zhang X, Gao Z, Zhang S, Shi P, Zhang X, Song L, Hendrickson H, Zhou D, Zheng G. Senolytic activity of piperlongumine analogues: synthesis and biological evaluation. Bioorg Med Chem. 2018; 26:3925–38. https://doi.org/10.1016/j.bmc.2018.06.013 [PubMed]
- 20. Li W, Qin L, Feng R, Hu G, Sun H, He Y, Zhang R. Emerging senolytic agents derived from natural products. Mech Ageing Dev. 2019; 181:1–6. https://doi.org/10.1016/j.mad.2019.05.001 [PubMed]
- 21. Triana-Martínez F, Picallos-Rabina P, Da Silva-Álvarez S, Pietrocola F, Llanos S, Rodilla V, Soprano E, Pedrosa P, Ferreirós A, Barradas M, Hernández-González F, Lalinde M, Prats N, et al. Identification and characterization of cardiac glycosides as senolytic compounds. Nat Commun. 2019; 10:4731. https://doi.org/10.1038/s41467-019-12888-x [PubMed]
- 22. Paez-Ribes M, González-Gualda E, Doherty GJ, Muñoz-Espín D. Targeting senescent cells in translational medicine. EMBO Mol Med. 2019; 11:e10234. https://doi.org/10.15252/emmm.201810234 [PubMed]
- 23. Muñoz-Espín D, Rovira M, Galiana I, Giménez C, Lozano-Torres B, Paez-Ribes M, Llanos S, Chaib S, Muñoz-Martín M, Ucero AC, Garaulet G, Mulero F, Dann SG, et al. A versatile drug delivery system targeting senescent cells. EMBO Mol Med. 2018; 10:e9355. https://doi.org/10.15252/emmm.201809355 [PubMed]
- 24. González-Gualda E, Pàez-Ribes M, Lozano-Torres B, Macias D, Wilson JR
3rd , González-López C, Ou HL, Mirón-Barroso S, Zhang Z, Lérida-Viso A, Blandez JF, Bernardos A, Sancenón F, et al. Galacto-conjugation of Navitoclax as an efficient strategy to increase senolytic specificity and reduce platelet toxicity. Aging Cell. 2020; 19:e13142. https://doi.org/10.1111/acel.13142 [PubMed] - 25. Palmer AK, Xu M, Zhu Y, Pirtskhalava T, Weivoda MM, Hachfeld CM, Prata LG, van Dijk TH, Verkade E, Casaclang-Verzosa G, Johnson KO, Cubro H, Doornebal EJ, et al. Targeting senescent cells alleviates obesity-induced metabolic dysfunction. Aging Cell. 2019; 18:e12950. https://doi.org/10.1111/acel.12950 [PubMed]
- 26. Shoemaker AR, Mitten MJ, Adickes J, Oleksijew A, Zhang H, Bauch J, Marsh K, Frost DJ, Madar D, Tse C, Fesik SW, Rosenberg SH, Elmore SW. The Bcl-2 Family Inhibitor ABT-263 Shows Significant but Reversible Thrombocytopenia in Mice. Blood. 2006; 108:1107–1107. https://doi.org/10.1182/blood.V108.11.825.825
- 27. Kaefer A, Yang J, Noertersheuser P, Mensing S, Humerickhouse R, Awni W, Xiong H. Mechanism-based pharmacokinetic/pharmacodynamic meta-analysis of navitoclax (ABT-263) induced thrombocytopenia. Cancer Chemother Pharmacol. 2014; 74:593–602. https://doi.org/10.1007/s00280-014-2530-9 [PubMed]
- 28. Kobayashi M, Ohno T, Kawada T, Ikegami H, Nishimura M, Horio F. Serum adiponectin concentration: its correlation with diabetes-related traits and quantitative trait loci analysis in mouse SMXA recombinant inbred strains. Biosci Biotechnol Biochem. 2006; 70:677–83. https://doi.org/10.1271/bbb.70.677 [PubMed]
- 29. Aleidi S, Issa A, Bustanji H, Khalil M, Bustanji Y. Adiponectin serum levels correlate with insulin resistance in type 2 diabetic patients. Saudi Pharm J. 2015; 23:250–56. https://doi.org/10.1016/j.jsps.2014.11.011 [PubMed]
- 30. Hamm JK, el Jack AK, Pilch PF, Farmer SR. Role of PPAR gamma in regulating adipocyte differentiation and insulin-responsive glucose uptake. Ann N Y Acad Sci. 1999; 892:134–45. https://doi.org/10.1111/j.1749-6632.1999.tb07792.x [PubMed]
- 31. Guo W, Pirtskhalava T, Tchkonia T, Xie W, Thomou T, Han J, Wang T, Wong S, Cartwright A, Hegardt FG, Corkey BE, Kirkland JL. Aging results in paradoxical susceptibility of fat cell progenitors to lipotoxicity. Am J Physiol Endocrinol Metab. 2007; 292:E1041–51. https://doi.org/10.1152/ajpendo.00557.2006 [PubMed]
- 32. Tchkonia T, Morbeck DE, Von Zglinicki T, Van Deursen J, Lustgarten J, Scrable H, Khosla S, Jensen MD, Kirkland JL. Fat tissue, aging, and cellular senescence. Aging Cell. 2010; 9:667–84. https://doi.org/10.1111/j.1474-9726.2010.00608.x [PubMed]
- 33. Ogrodnik M, Zhu Y, Langhi LG, Tchkonia T, Krüger P, Fielder E, Victorelli S, Ruswhandi RA, Giorgadze N, Pirtskhalava T, Podgorni O, Enikolopov G, Johnson KO, et al. Obesity-induced cellular senescence drives anxiety and impairs neurogenesis. Cell Metab. 2019; 29:1061–77.e8. https://doi.org/10.1016/j.cmet.2018.12.008 [PubMed]
- 34. Xu M, Pirtskhalava T, Farr JN, Weigand BM, Palmer AK, Weivoda MM, Inman CL, Ogrodnik MB, Hachfeld CM, Fraser DG, Onken JL, Johnson KO, Verzosa GC, et al. Senolytics improve physical function and increase lifespan in old age. Nat Med. 2018; 24:1246–56. https://doi.org/10.1038/s41591-018-0092-9 [PubMed]
- 35. Zhang P, Kishimoto Y, Grammatikakis I, Gottimukkala K, Cutler RG, Zhang S, Abdelmohsen K, Bohr VA, Misra Sen J, Gorospe M, Mattson MP. Senolytic therapy alleviates Aβ-associated oligodendrocyte progenitor cell senescence and cognitive deficits in an alzheimer’s disease model. Nat Neurosci. 2019; 22:719–28. https://doi.org/10.1038/s41593-019-0372-9 [PubMed]
- 36. Schafer MJ, White TA, Evans G, Tonne JM, Verzosa GC, Stout MB, Mazula DL, Palmer AK, Baker DJ, Jensen MD, Torbenson MS, Miller JD, Ikeda Y, et al. Exercise prevents diet-induced cellular senescence in adipose tissue. Diabetes. 2016; 65:1606–15. https://doi.org/10.2337/db15-0291 [PubMed]
- 37. Burton DG, Faragher RG. Obesity and type-2 diabetes as inducers of premature cellular senescence and ageing. Biogerontology. 2018; 19:447–59. https://doi.org/10.1007/s10522-018-9763-7 [PubMed]
- 38. Awazawa M, Ueki K, Inabe K, Yamauchi T, Kubota N, Kaneko K, Kobayashi M, Iwane A, Sasako T, Okazaki Y, Ohsugi M, Takamoto I, Yamashita S, et al. Adiponectin enhances insulin sensitivity by increasing hepatic IRS-2 expression via a macrophage-derived IL-6-dependent pathway. Cell Metab. 2011; 13:401–12. https://doi.org/10.1016/j.cmet.2011.02.010 [PubMed]
- 39. El-Jack AK, Hamm JK, Pilch PF, Farmer SR. Reconstitution of insulin-sensitive glucose transport in fibroblasts requires expression of both PPARgamma and C/EBPalpha. J Biol Chem. 1999; 274:7946–51. https://doi.org/10.1074/jbc.274.12.7946 [PubMed]
- 40. Wu Z, Rosen ED, Brun R, Hauser S, Adelmant G, Troy AE, McKeon C, Darlington GJ, Spiegelman BM. Cross-regulation of C/EBP alpha and PPAR gamma controls the transcriptional pathway of adipogenesis and insulin sensitivity. Mol Cell. 1999; 3:151–58. https://doi.org/10.1016/s1097-2765(00)80306-8 [PubMed]
- 41. Debacq-Chainiaux F, Erusalimsky JD, Campisi J, Toussaint O. Protocols to detect senescence-associated beta-galactosidase (SA-betagal) activity, a biomarker of senescent cells in culture and in vivo. Nat Protoc. 2009; 4:1798–806. https://doi.org/10.1038/nprot.2009.191 [PubMed]