


Introduction
Osteoarthritis (OA), a leading cause of joint damage and disability, is associated with impaired quality of life, shortened working duration, and increased all-cause mortality [1–3]. The prevalence of OA continues to grow in recent years, which will further deteriorate with aging population and obesity epidemic [4–6]. A study based on the National Health Interview Survey indicates that approximately 14 million persons have symptomatic knee OA and more than half of them are younger than 65 years old, with high possibility for joint disability over the next 30 years [7]. Several pharmacological agents are helpful in improving the symptoms of early-stage OA, but they can hardly inhibit or block the pathological progression of OA [8]. Eventually, most of advanced-stage victims may undergo total joint replacement owing to serious afflicted joint pain and disability [9]. Mountains of studies suggest that aberrant expression of genes are associated with the initiation and progression of OA [10], but the exact pathogenesis remains to be further clarified.
Non-coding RNAs (ncRNAs) are a group of RNA molecules accounting for a large proportion of the RNA and there are several types of ncRNAs, such as microRNAs (miRNAs), long non-coding RNAs (lncRNAs), and circular RNAs (circRNAs) [11, 12]. miRNA, one of the most widely-studied ncRNAs, suppresses the expression of target genes through binding to the 3’UTR of their corresponding mRNAs [13]. LncRNAs are a group of ncRNAs with lengths exceeding 200 nucleotides and can regulate gene expression at transcription and post-transcription level [14]. CircRNAs are a special type of ncRNAs with covalently closed ring structure originating from back-splicing of pre-mRNAs at the downstream 5' splice site and the 3' splice site [15]. The rapid development of RNA-sequencing and bioinformatics analysis reveal that numerous miRNAs, lncRNAs and circRNAs are identified in various human diseases, including OA [16–18]. Accumulating evidence indicated that complicated communication networks across mRNA, miRNAs, lncRNAs and circRNAs participated in the onset and progression of OA and acted as potential therapeutic targets for OA. Wang and coworkers found that miR-483-5p was upregulated in OA and inhibition of miR-483-5p attenuated the progression of OA via Matn3 and Timp2 in vivo [19]. LncRNA-TM1P3 was significantly over-expressed in OA and promoted extracellular matrix degradation by regulating miR-22/TGF-β signaling/MMP13 pathway [20]. CircSERPINE2 participated in regulating chondrocytes metabolism and apoptosis through miR-1271/ERG axis and overexpression of CircSERPINE2 repressed the progression of OA in the rabbit model [17]. Actually, the crosstalk across coding and noncoding RNAs has been attributed increasing importance since Salmena et al. firstly proposed the ceRNA (competing endogenous RNA) hypothesis in 2011 [21]. Of the ceRNA networks, miRNAs play a central role to connect coding and noncoding RNAs via microRNA response elements (MREs), which act as the critical communicate bridges [21]. Furthermore, increasing studies suggested that miRNAs participated in the development and progression of diseases through triggering alterations of the whole transcriptome. For instance, overexpression of circRNA-Filip1l induced by decrease of miRNA-1224 facilitated chronic inflammatory pain via upregulation of Ubr5 in an Ago2-dependent manner [22]. Ye and colleagues also revealed that overexpression of miR-145 suppressed breast cancer progression and induced alterations of mRNAs, miRNAs, lncRNAs and circRNAs [23]. Therefore, it is essential to further explore the network regulatory interactions across coding and noncoding RNAs induced by miRNAs, which may provide novel diagnostic biomarkers and potential drug targets for OA. miR-10a-5p is a member of miR-10 family and could regulate cell proliferation, apoptosis, and inflammatory factors in many inflammation-associated diseases, including atopic dermatitis and rheumatoid arthritis [24–26]. Previous studies also indicated that miR-10a-5p was over-expressed in OA [16, 27]. However, the potential roles and molecule mechanisms of miR-10a-5p in OA were not fully elucidated.
In the current study, we verified that miR-10a-5p was significantly upregulated in OA and acted as a potential promising biomarker. Furthermore, we found that miR-10a-5p inhibited chondrocyte proliferation and promoted chondrocyte apoptosis. To in-depth explore the mechanisms of miR-10a-5p in OA, we performed RNA sequence for the whole transcriptome. Subsequently, integrated bioinformatics analyses were employed to illuminate the alterations of the whole transcriptome induced by miR-10a-5p. The workflow of study design is shown in Figure 1. Our findings may open up a new sight into regulatory mechanism of miRNAs, which may provide novel therapeutic targets for OA.
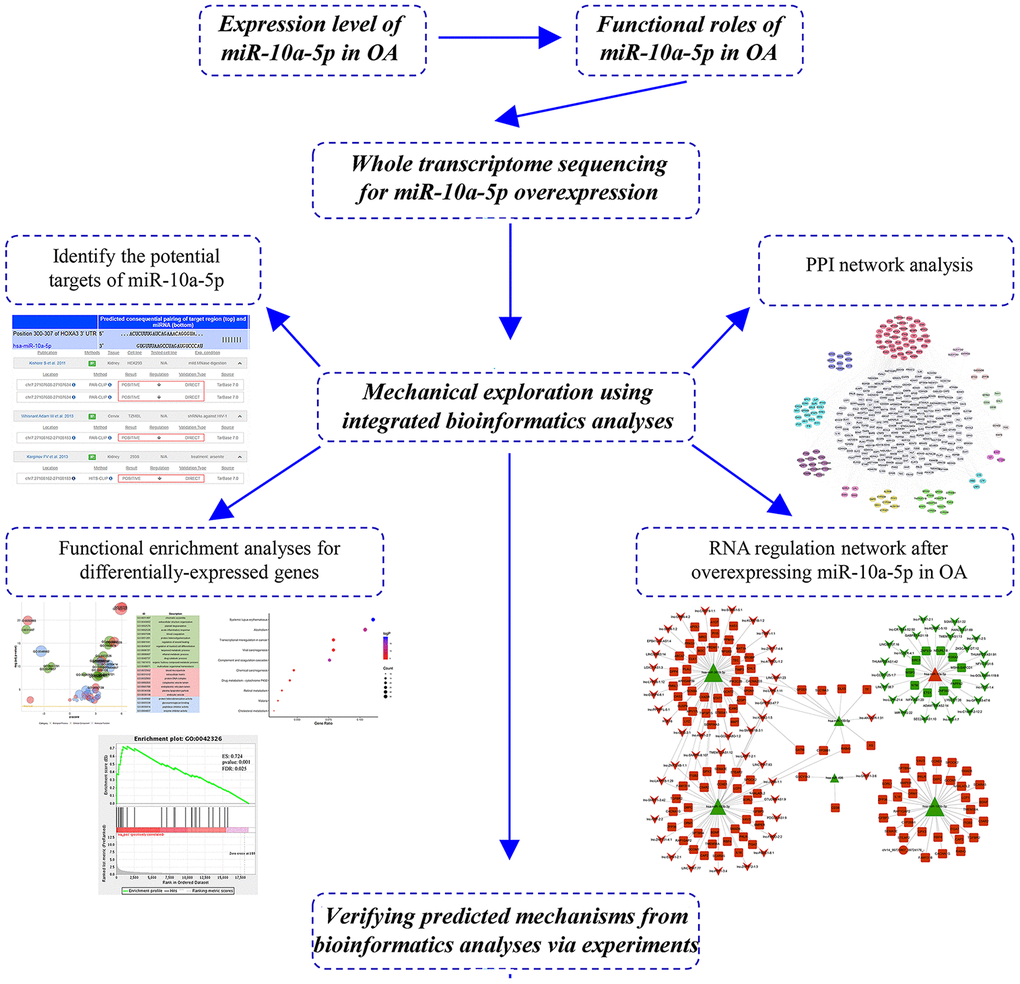
Figure 1. The workflow of study design.
Results
miR-10a-5p is upregulated in OA and acts as a potential promising biomarker
To explore the potential roles of miR-10a-5p in OA, we firstly detected the relative expression level of miR-10a-5p in OA and normal articular cartilage using RT-qPCR (Figure 2A). The results indicated that miR-10a-5p was upregulated in OA articular cartilage. Previous studies indicated that miRNAs in PBMC acted as promising biomarkers [28, 29]. In the current study, we also explore whether miR-10a-5p can act as a potential biomarker in OA. The results showed that miR-10a-5p was upregulated in PBMC of OA patients and might act as a promising predictor for OA with an area under the curve of 0.84 (95% confidence interval 0.65–1.04, P=0.02; Figure 2B–2C). Consistently, we also verified that miR-10a-5p was significantly over-expressed in mouse OA model (Figure 2D–2E) and IL-1β induced chondrocytes (Figure 3A).
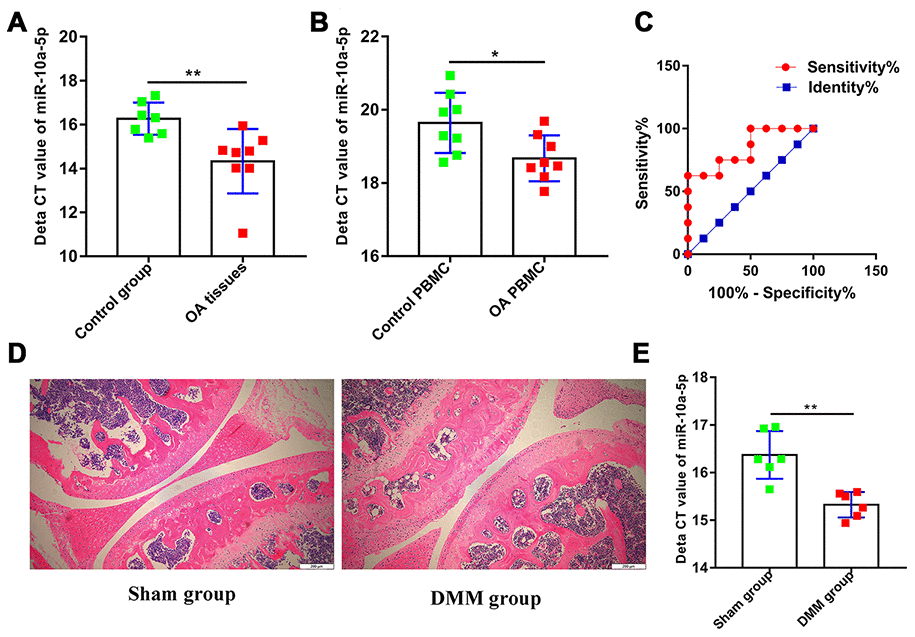
Figure 2. miR-10a-5p is upregulated in OA and acts as a potential promising biomarker. (A) The relative expression of miR-10a-5p in OA and control cartilage tissues analyzed by RT-qPCR (8 OA cartilage vs. 7 control cartilage, **P < 0.01); (B) The relative expression of miR-10a-5p in OA and control PBMC analyzed by RT-qPCR (8 OA cartilage vs. 8 control cartilage, *P < 0.05); (C) ROC analysis of miR-10a-5p in PBMC for the diagnosis of OA (AUC,0.84; P=0.02); Representative pictures of articular cartilage in sham group (D left) and DMM group (D right) stained by H&E. Scale bar, 200 um. (E) The relative expression of miR-10a-5p in sham group and DMM group analyzed by RT-qPCR (6 sham vs. 6 DMM cartilage, **P < 0.01).
Overexpression of miR-10a-5p inhibits chondrocyte proliferation and promotes chondrocyte apoptosis and cartilage matrix degradation
Subsequently, we evaluated the effect of miR-10a-5p on chondrocyte proliferation, apoptosis and metabolism after overexpressing miR-10a-5p in HC-a (Figure 3B). CCK-8 assay, EDU assay, and flow cytometry assay indicated that overexpression of miR-10a-5p inhibited chondrocyte proliferation (Figure 3C–3E) and promoted chondrocyte apoptosis (Figure 3F–3G). Also, we performed western blot to explore the effect of miR-10a-5p on extracellular matrix metabolism. Western blot results indicated that overexpression of miR-10a-5p inhibited the expression of COL2A1 and promoted the expression of MMP13 (Figure 3H). Taken together, these results demonstrated that miR-10a-5p may act as a significant contributing factor for OA.
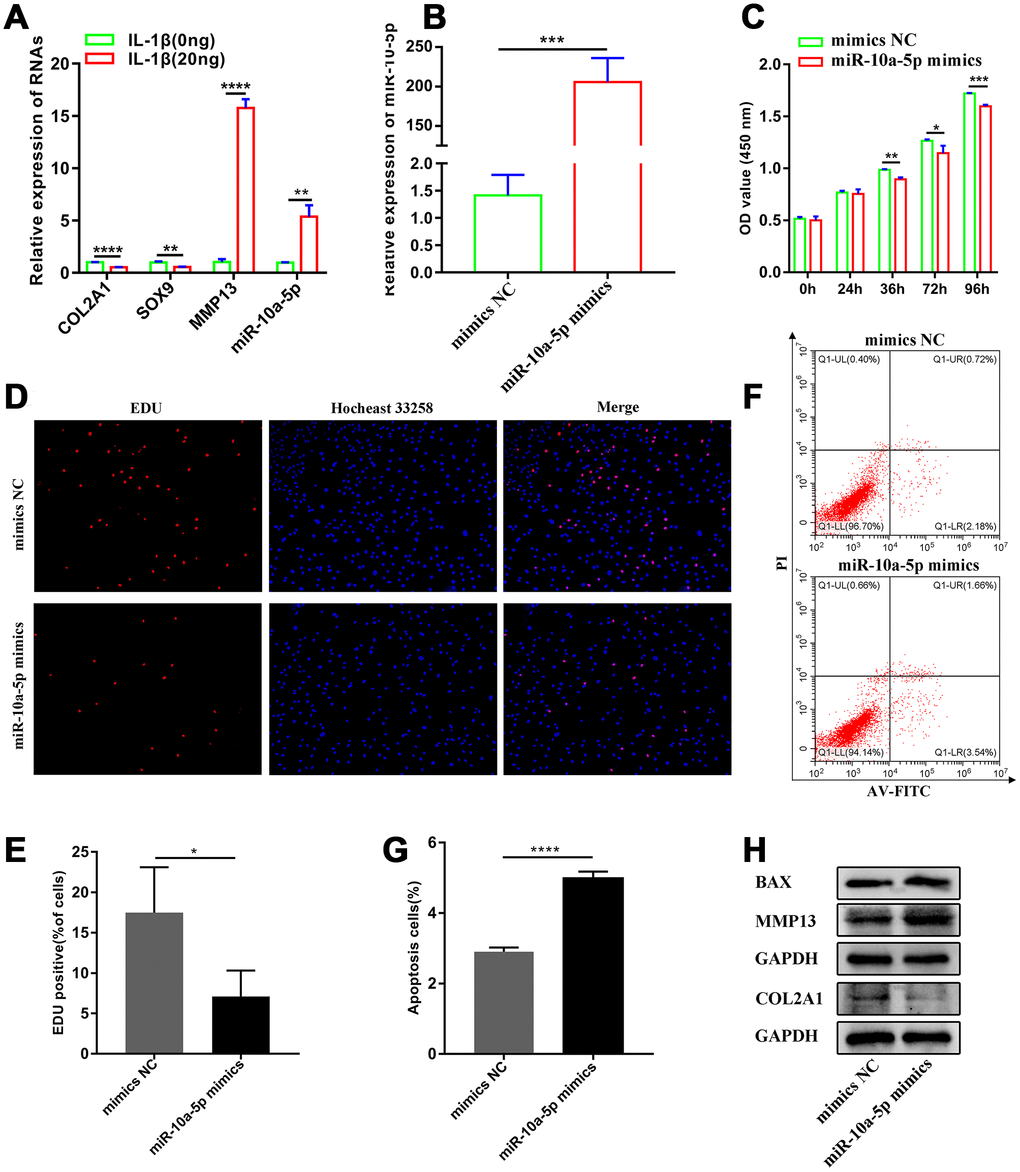
Figure 3. miR-10a-5p acts as a significant contributing factor for OA. (A) The relative expression of COL2A1, MMP13, SOX9, and miR-10a-5p in control and IL-1β induced Hc-a analyzed by RT-qPCR (n=3; **P < 0.01, ****P < 0.0001). (B) The relative expression of miR-10a-5p after transfecting miR-10a-5p mimics, ***P < 0.001. (C) The effect of miR-10a-5p overexpression on cell proliferation detected by CCK8 assay (n=3; *P < 0.05, **P < 0.01, ***P < 0.001). (D, E) The effect of miR-10a-5p overexpression on cell proliferation detected by EDU assay (n=3; *P < 0.05). (F, G) The effect of miR-10a-5p overexpression on cell apoptosis detected by flow cytometry assay (n=3; ****P < 0.0001). (H) Effects of miR-10a-5p overexpression on Col2a1, MMP13, BAX, and GAPDH protein levels detected by western blot.
Overexpression of miR-10a-5p induces alteration of the whole transcriptome in human primary chondrocyte
To explore the potential mechanism of miR-10a-5p in OA, we performed the whole transcriptome sequencing to identify differentially-expressed genes on HC-a via miR-10a-5p overexpressing. These results indicated that overexpression of miR-10a-5p induced the alteration of the whole transcriptome, which involved 395 up-regulated and 278 down-regulated mRNAs (Figure 4A), 202 up-regulated and 223 down-regulated lncRNAs (Figure 4B), 1 up-regulated and 4 down-regulated miRNAs (Figure 5A), and 8 up-regulated and 2 down-regulated circRNAs (Figure 5B). The detailed differentially-expressed mRNAs, lncRNAs, miRNAs, and circRNAs were showed in Supplementary Tables 2–5. Moreover, RT-qPCR showed that the expression level of 12 selected differentially-expressed genes were basically consistent with the results of RNA-seq (Figure 6).
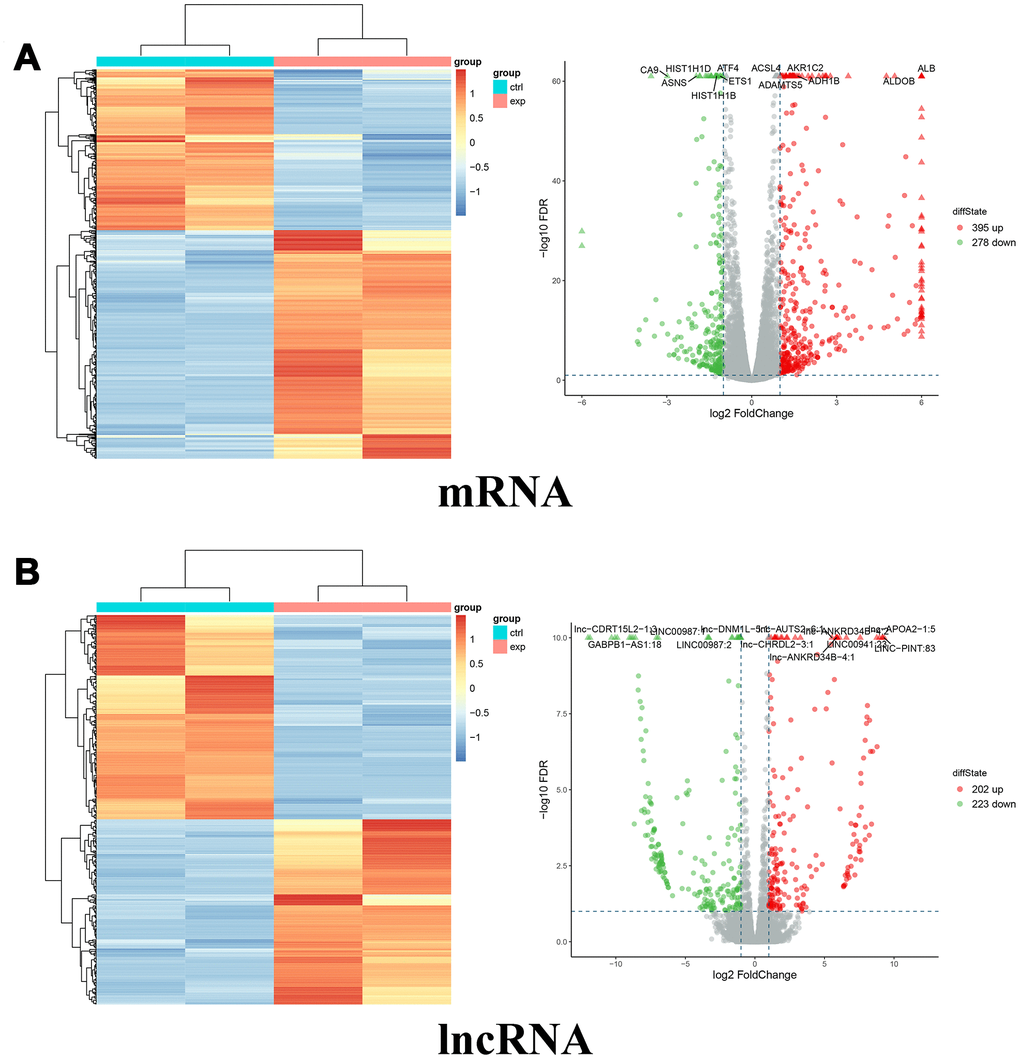
Figure 4. Differentially expressed mRNAs and lncRNAs between miR-10a-5p overexpression group (exp) and control group (ctrl). (A) Heat map (left) and volcano plot (right) of differentially expressed mRNAs (red color denotes upregulated mRNAs and green color denotes downregulated mRNAs). (B) Heat map (left) and volcano plot (right) of differentially expressed lncRNAs (red color denotes upregulated lncRNAs and green color denotes downregulated lncRNAs).
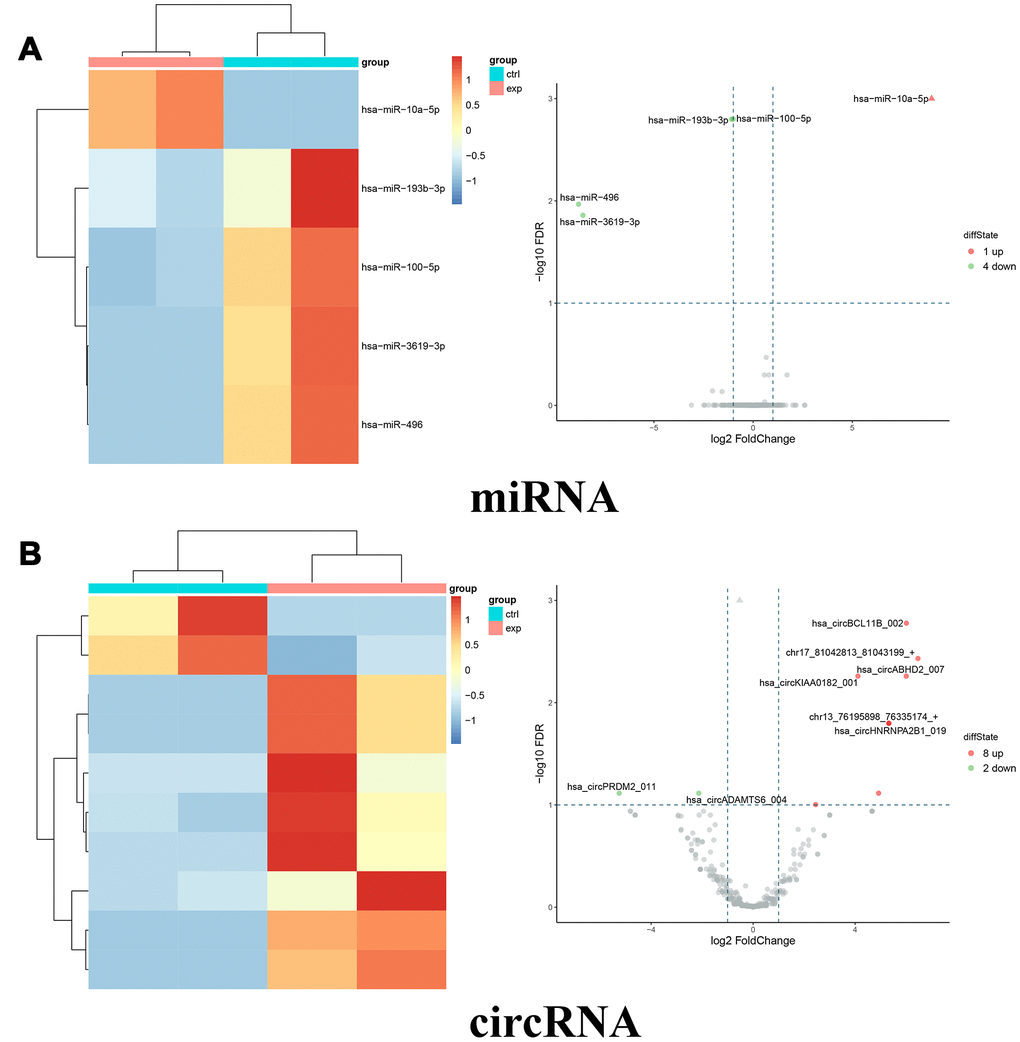
Figure 5. Differentially expressed miRNAs and circRNAs between miR-10a-5p overexpression group (exp) and control group (ctrl). (A) Heat map (left) and volcano plot (right) of differentially expressed miRNAs (red color denotes upregulated miRNAs and green color denotes downregulated miRNAs). (B) Heat map (left) and volcano plot (right) of differentially expressed circRNAs (red color denotes upregulated circRNAs and green color denotes downregulated circRNAs).
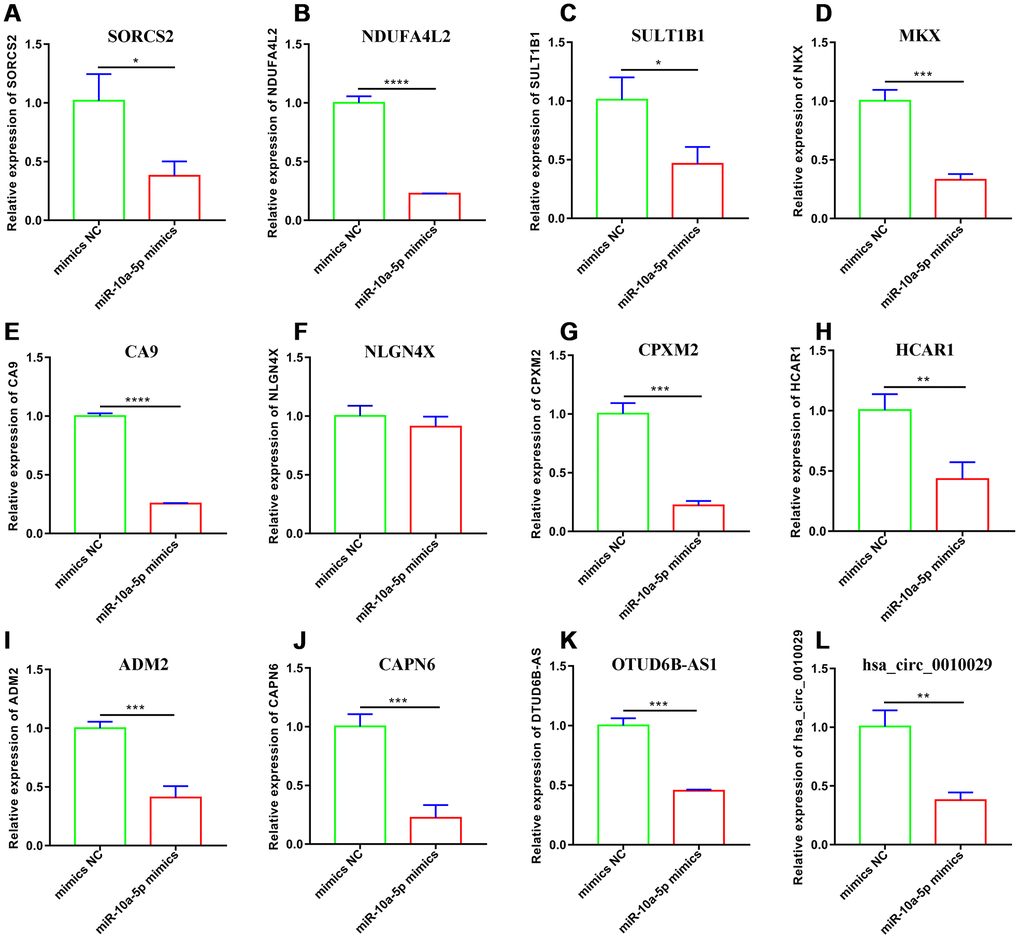
Figure 6. Validation of 12 selected downregulated genes after miR-10a-5p overexpression through RT-qPCR. (A) SORCS2; (B) NDUFA4L2; (C) SULT1B1; (D) MKX; (E) CA9; (F) NLGN4X; (G) CPXM2; (H) HCAR1; (I) ADM2; (J) CAPN6; (K) OTUD6B-AS1; (L) hsa_circ_0010029.(n=3; *P < 0.05, **P < 0.01, ***P < 0.001, ****P < 0.0001).
Functional enrichment analyses for differentially-expressed mRNAs, circRNAs, and lncRNAs
Furthermore, we undertook functional enrichment analyses for these dysregulated genes. GO enrichment analysis for dysfunctional mRNAs indicated that they were mainly enriched in chromatin assembly (GO:0031497), extracellular structure organization (GO:0043062), protein-DNA Complex (GO:0032993), extracellular matrix (GO:0031012), and glycosaminoglycan binding (GO:0005539) (Figure 7A, Supplementary Tables 6–8). KEGG enrichment analysis for dysfunctional mRNAs revealed that they mainly enriched in systemic lupus erythematosus (HSA05322), alcoholism (HSA05034), complement and coagulation cascades (HSA04610), and cholesterol metabolism (HSA04979) (Figure 7B, Supplementary Table 9). Functional enrichment analyses for cis-genes of differentially expressed lncRNAs showed that they were enriched in positive regulation of mesenchymal cell proliferation (GO:0002053), peptidyl-proline modification (GO:0018208), Alcoholism (HSA05034), Arachidonic acid metabolism (HSA00590) (Figure 7C, 7D, Supplementary Tables 10–13). Functional enrichment analyses for parental genes of differentially expressed circRNAs showed that they mainly participated in somatic diversification of T cell receptor genes (GO:0002568), positive regulation of brown fat cell differentiation (GO:0090336), Adherens junction (HSA04520) (Figure 7E, 7F, Supplementary Tables 14–17). Also, GSEA for differentially expressed mRNAs verified that they were mainly associated with organ regeneration (GO:0031100), nucleosome assembly (GO:0006334), negative regulation of phosphorylation (GO:0042326), complement and coagulation cascades (HSA04610), tyrosine metabolism (HSA00350), PPAR signaling pathway (HSA03320), PI3K-Akt signaling pathway (HSA04151), p53 signaling pathway (HSA04115), FoxO signaling pathway (HSA04068) (Figure 8A–8F, Supplementary Tables 18–19).
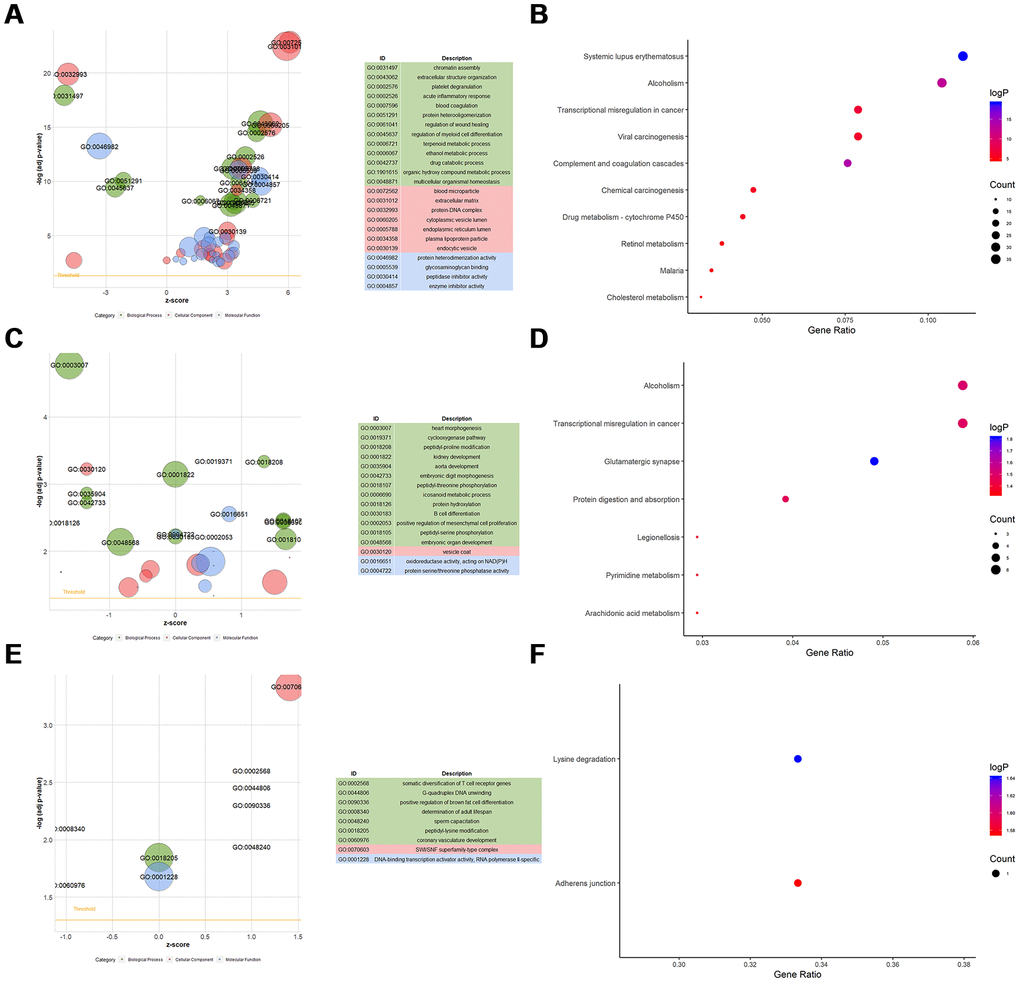
Figure 7. Functional enrichment analyses for differentially-expressed mRNAs, lncRNAs, and circRNAs. (A) GOBubble plot shows GO terms enriched in differentially-expressed mRNAs. (B) KEGG terms enriched in differentially-expressed mRNAs. (C) GOBubble plot shows GO terms enriched in ci-genes of differentially-expressed lncRNAs. (D) KEGG terms enriched in ci-genes of differentially-expressed lncRNAs. (E) GOBubble plot shows GO terms enriched in parent genes of differentially-expressed circRNAs. (F) KEGG terms enriched in parent genes of differentially-expressed circRNAs.
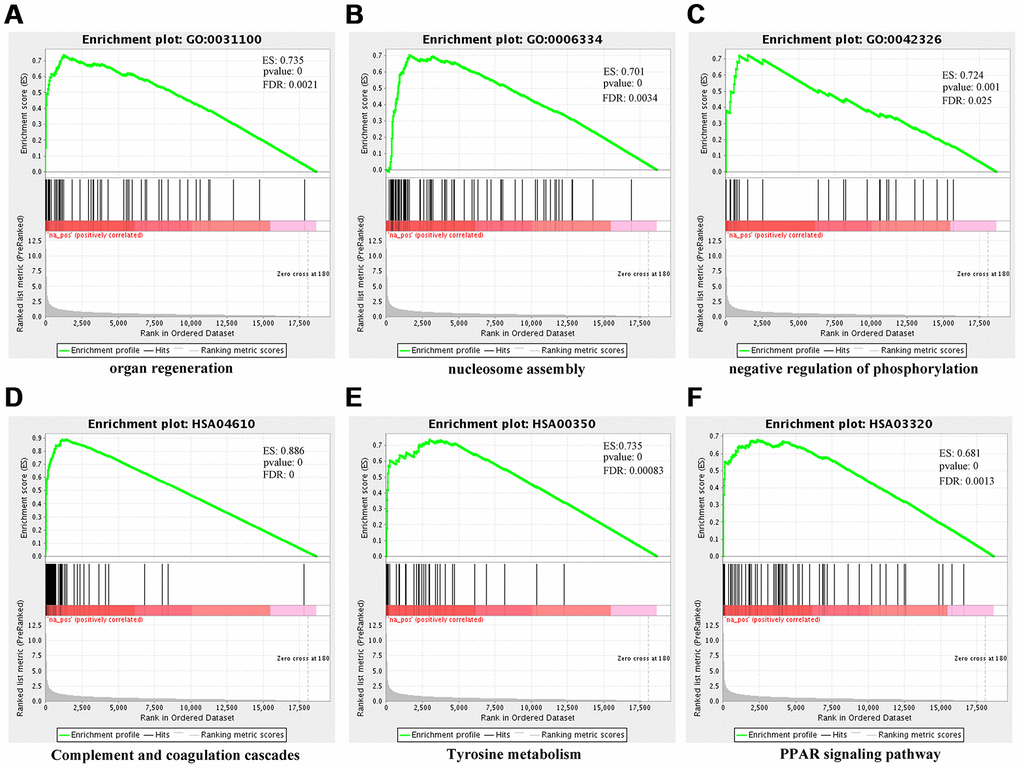
Figure 8. Gene set enrichment analysis (GSEA) for differentially-expressed mRNAs using NGSEA. Representative three significantly GO enrichment plot in GSEA: (A) organ regeneration (GO:0031100); (B) nucleosome assembly (GO:0006334); (C) negative regulation of phosphorylation. Representative three significantly KEGG enrichment plot in GSEA: (D) complement and coagulation cascades (HSA04610); (E) tyrosine metabolism (HSA00350); (F) PPAR signaling pathway (HSA03320).
PPI network analysis
The protein-protein regulatory network contained 365 nodes and 2210 edges (Figure 9A). MCODE analysis indicated that thirteen modules were extract from the PPI network, but the 42 genes from module 1 had the highest node degree according to CytoHubba (Supplementary Table 20). Therefore, these genes from module 1 were identified as hub genes. Subsequently, we conducted functional enrichment analyses for these hub genes using Metascape [30]. The results revealed that they were mainly enriched in blood microparticle (GO:0072562), endoplasmic reticulum lumen (GO:0005788), complement and coagulation cascades (HSA04610) (Figure 9B).
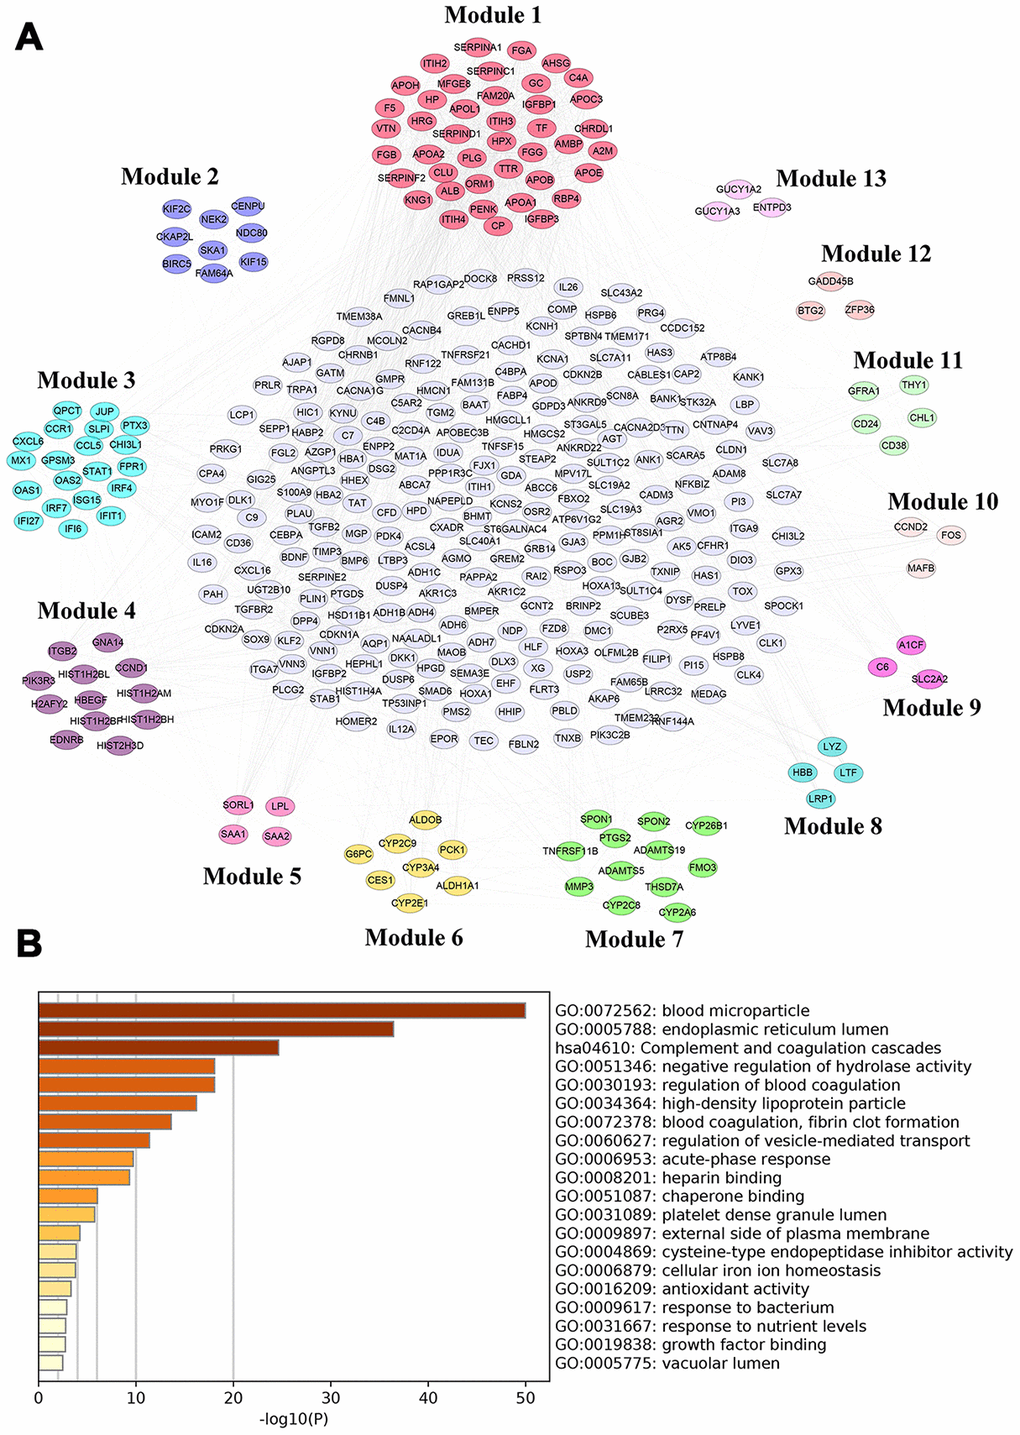
Figure 9. PPI network analysis for differentially-expressed mRNAs. (A) PPI network of differentially-expressed mRNAs analyzed by STRING database and Module (1-13) were selected from PPI network using MCODE analysis. (B) Functional enrichment analysis of hub genes (Module 1) were performed using Metascape.
Construction of ceRNA regulatory networks
We also constructed the network regulatory interactions across coding and noncoding RNAs triggered by miR-10a-5p. Considering that miRNAs play critical pivotal roles in ceRNA interactions, we constructed ceRNA regulatory networks centralized on significant upregulated and downregulated miRNAs. Downregulated miRNAs-associated ceRNA networks contained 1 circRNA, 42 lncRNA, 5 miRNA and 112 mRNA (Figure 10). Especially, miR-10a-5p was the only upregulated miRNA after miR-10a-5p overexpression. The ceRNA network centered on miR-10a-5p consisted of 27 lncRNA, 1 miRNA, and 10 mRNA (Figure 10). The complicated regulatory networks across coding and noncoding RNAs revealed the powerful regulating effects of miR-10a-5p.
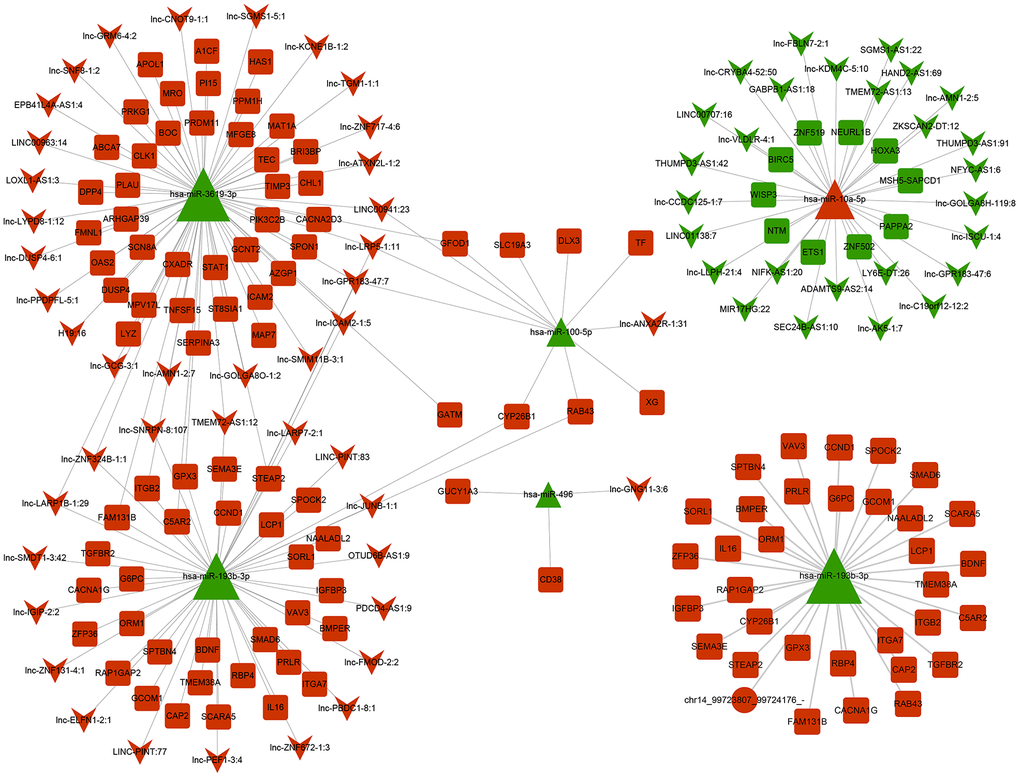
Figure 10. ceRNA regulation network centered on downregulated and upregulated miRNAs after overexpressing miR-10a-5p in Hc-a. The circle represents circRNA, square represents mRNA and triangle represents miRNA, and inverted triangle represents lncRNA.
HOXA3 acts as a targeted gene of miR-10a-5p
To seek for the potential target of miR-10a-5p, we firstly identify the downregulated mRNAs in OA. A total of 767 downregulated mRNAs were identified in IL-1β induced primary chondrocytes after processing the data of GSE74220 using BioJupies [31] (Figure 10A). Furthermore, we investigated that HOXA3 was the only overlapping mRNA across the downregulated mRNAs in GSE74220, the predicted targets of miR-10a-5p via Targetscan, and the downregulated mRNAs in our RNA-seq results (Figure 11B). Subsequently, we found that HOXA3 was downregulated in OA cartilage after analyzing the results of GSE114007 (Figure 11C). The results of Targetscan showed that the seed region of miR-10a-5p was well-paired with 3’UTR of HOXA3, which was conservative among vertebrates (Figure 11D). According to TarBase v.8 [32], high-throughput experiments including PAR-CLIP and HITS-CLIP indicated that miR-10a-5p was the direct inhibition to HOXA3 in HEK293, TZMBL, and 293S (Figure 11E). Furthermore, dual luciferase reporter assay confirmed that luciferase activity of HOXA3-wt was obviously inhibited by miR-10a-5p mimics as compared with that in HOXA3-mut group (Figure 11F–11G). RT-qPCR and western blot results showed that HOXA3 was significantly inhibited in IL-1β induced HC-a (Figure 11H–11I) and miR-10a-5p overexpression (Figure 11J–11K). Taken together, these results indicated that HOXA3 was downregulated in OA and acted as the targeted genes of miR-10a-5p.
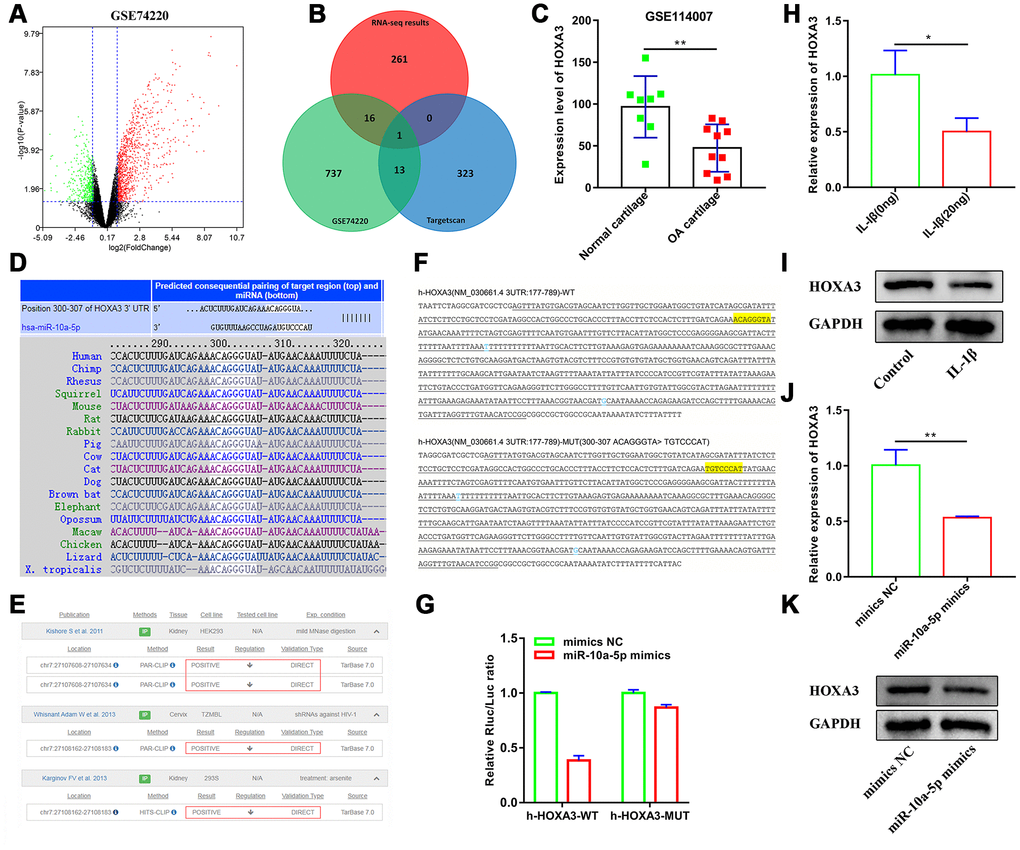
Figure 11. HOXA3 acts as a targeted gene of miR-10a-5p. (A) Volcano plot of differentially expressed mRNAs between control group and IL-1β induced primary chondrocyte group from GSE74220. (B) Venn plot of the overlapping mRNA across the downregulated mRNAs in GSE74220, the predicted targets of miR-10a-5p in Targetscan, and the downregulated mRNAs in our RNA-seq. (C) The expression level of HOXA3 in OA cartilage from GSE114007, **P < 0.01. (D) Targetscan shows that the seed region of miR-10a-5p is well-paired with 3’UTR of HOXA3, which was conservative among vertebrates. (E) High-throughput experiments verified that HOXA3 was the direct target of miR-10a-5p in HEK293, TZMBL, and 293S from TarBase v.8. (F) The sequencing results of cloned fragments in luciferase reporter vectors and the yellow highlighted sequence is the target test site. (G) Interaction between miR-10a-5p and HOXA3 was verified by luciferase report assay in 293T cells. (H, I) The relative expression of HOXA3 in control and IL-1β induced Hc-a analyzed by RT-qPCR and western blot (n=3, *P < 0.05). (J, K) The relative expression of HOXA3 after transfecting miR-10a-5p mimics analyzed by RT-qPCR and western blot (n=3, **P < 0.01).
miR-10a-5p exerts biological functions in OA cell model by targeting HOXA3
Based on the above results, we found that miR-10a-5p was a significant contributor to the pathogenesis of OA. RNA-sequencing together with integrated bioinformatics analyses identified that miR-10a-5p promoted the progression of OA through triggering the alterations of the whole transcriptome. Subsequently, one of the most representative downstream genes, HOXA3 (the targeted gene of miR-10a-5p) was chosen to verify the predicted mechanisms from bioinformatics analyses. Three siRNAs were designed to knockdown the expression of HOXA3. RT-qPCR results showed that si-HOXA3-1 had the highest silence efficiency, which was further confirmed by western blot (Figure 12A, 12B). Therefore, si-HOXA3-1 was chosen to perform subsequent experiments. CCK-8 assay, EDU assay, flow cytometry assay, and western blot verified that silence of HOXA3 significantly inhibited chondrocyte proliferation (Figure 12C, 12D, 12F), promoted chondrocyte apoptosis (Figure 12E, 12G) and cartilage matrix degradation (Figure 12H). Next, we further investigated whether miR-10a-5p functioned in IL-1β induced HC-a through targeting HOXA3. We treated HC-a with IL-1β and then co-transfected miR-10a-5p inhibitor and si-HOXA3. Western blot also indicated that si-HOXA3 partly reversed the protective effect of miR-10a-5p inhibitor on IL-1β treated HC-a (Figure 13A). CCK-8 and EDU assay indicated that miR-10a-5p inhibitor partly restored IL-1β-induced inhibition of HC-a proliferation, while si-HOXA3 attenuated the effect of miR-10a-5p inhibitor on IL-1β treated HC-a (Figure 13B, 13D, 13F). Flow cytometry assay showed that miR-10a-5p inhibitor partly reversed IL-1β-induced chondrocyte apoptosis, while si-HOXA3 antagonized the effect of miR-10a-5p inhibitor on IL-1β treated chondrocyte (Figure 13C, 13E). Collectively, these finding indicated that miR-10a-5p exerts biological functions in OA cell model by targeting HOXA3.
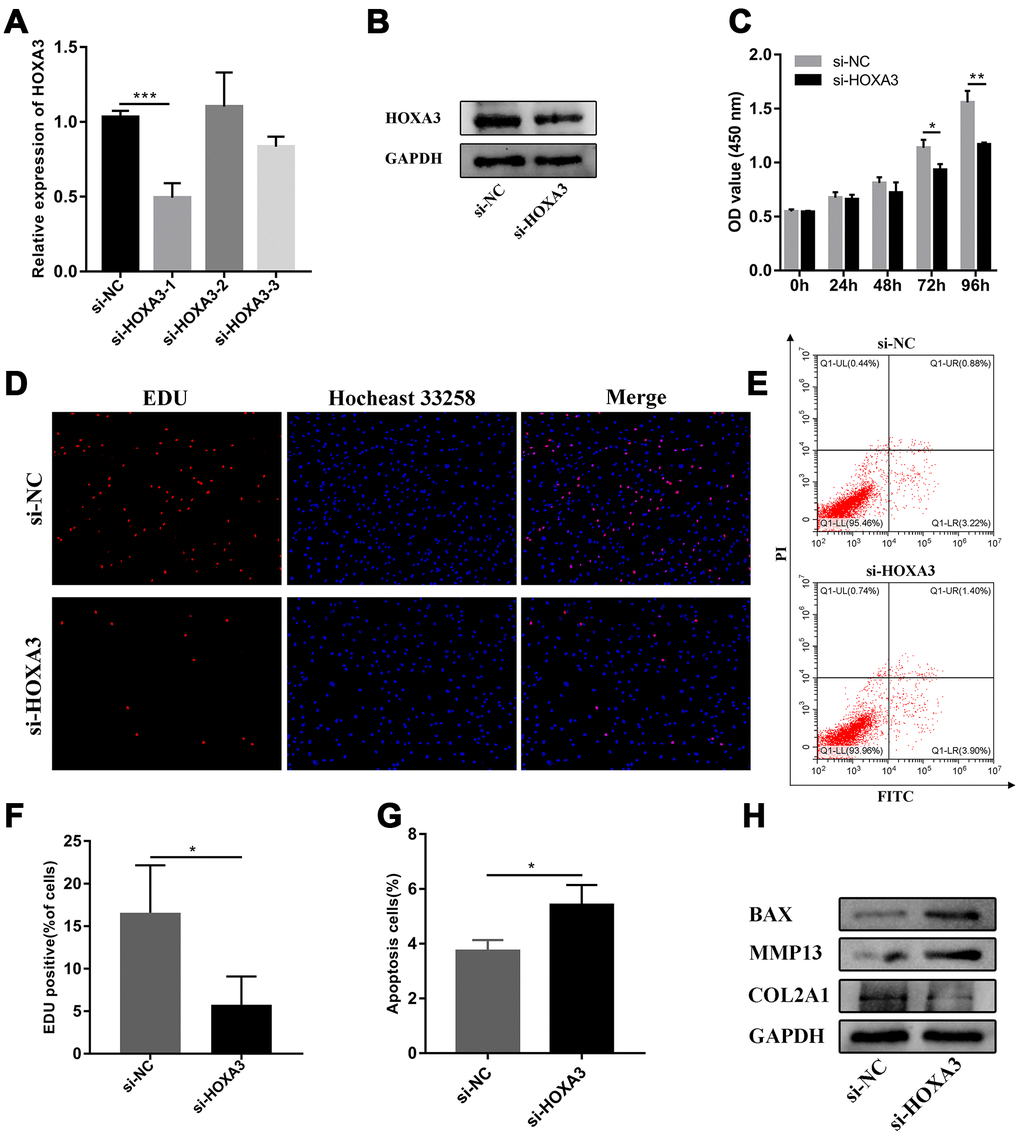
Figure 12. Silence of HOXA3 inhibited chondrocyte proliferation and promoted chondrocyte apoptosis. (A) The relative expression of HOXA3 after transfecting si-HOXA3 analyzed by RT-qPCR (n=3; ***P < 0.001). (B) The relative expression of HOXA3 after transfecting si-HOXA3 analyzed by western blot. (C) The effect of HOXA3 knockdown on cell proliferation detected by CCK8 assay (n=3; *P < 0.05, **P < 0.01). (D, F) The effect of HOXA3 knockdown on cell proliferation detected by EDU assay (n=3; *P < 0.05). (E, G) The effect of HOXA3 knockdown on cell apoptosis detected by flow cytometry assay (n=3; *P < 0.05). (H) Effects of HOXA3 knockdown on Col2a1, MMP13, BAX, and GAPDH protein levels detected by western blot.
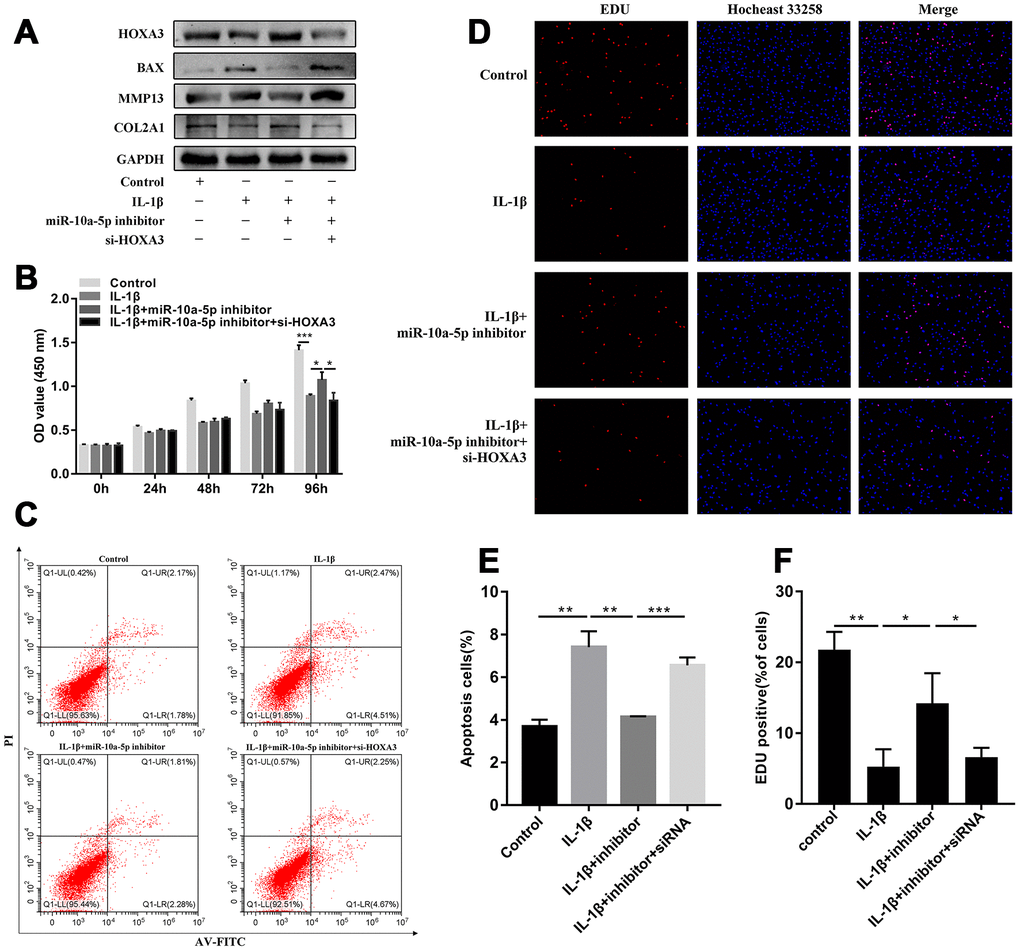
Figure 13. miR-10a-5p functioned in IL-1β induced Hc-a through targeting HOXA3. Hc-a was treated with IL-1β and then co-transfected miR-10a-5p inhibitor and si-HOXA3. (A) HOXA3, Col2a1, MMP13, BAX, and GAPDH protein levels were detected by western blot. (B, D, F) cell proliferation detected by CCK8 (B; n=3; *P < 0.05, ***P < 0.001) and EDU assay (D, F; n=3, *P < 0.05, **P < 0.01, ***P < 0.001). (C, E) cell apoptosis detected by flow cytometry assay (n=3, **P < 0.01, ***P < 0.001).
Discussion
In the study, our findings indicated that miR-10a-5p was upregulated in OA and acted as a potential biomarker. Moreover, we found that miR-10a-5p overexpression inhibited chondrocyte proliferation and facilitated chondrocyte apoptosis and cartilage matrix degradation. Subsequently, RNA-seq together with integrated bioinformatics analyses was performed to comprehensively explore the potential mechanisms of miR-10a-5p in OA. Further experiments based on bioinformatics analyses demonstrated that miR-10a-5p exerted biological functions in OA cell model by targeting HOXA3.
The results of RNA-seq revealed that overexpression of miR-10a-5p triggered the alteration of mRNAs, miRNAs, lncRNAs, and circRNAs. Accordingly, functional enrichment analyses including GO, KEGG, and GSEA were performed for these differentially-expressed genes induced by miR-10a-5p. GO analyses indicated that they were enriched in many significant terms, such as extracellular structure organization, extracellular matrix, and glycosaminoglycan binding. It was well-known that extracellular matrix was the main component of articular cartilage and extracellular matrix degradation was regarded as the key pathological hallmark of OA. Numerous studies revealed that many promising therapeutic targets aimed at promoting extracellular matrix generation significantly repressed the progression of OA [33, 34]. Also, glycosaminoglycans (GAGs) were the important building foundation of articular cartilage and GAGs bindings may play important roles in pathogenesis of OA. Flannery and coworkers identified that ADAMTS-4 existed multiple GAG-binding sites and may contribute to extracellular matrix degradation through recognizing these bindings in the aggrecan core protein [35]. Another study indicated that PRELP, a GAG binding protein, inhibited osteoclastogenesis through repressing NF-κB transcriptional activity [36]. Considering that PRELP was highly-expressed in cartilage and activation of NF-κB signaling pathway was a significant contributor in OA [36, 37], the potential roles of PRELP in OA deserved further exploration. KEGG analyses indicated that these differentially-expressed genes induced by miR-10a-5p were enriched in PPAR signaling pathway, PI3K-Akt signaling pathway, and P53 signaling pathway. PPARs used to be regarded as a group of ligand-inducible transcription factors participating in lipid and glucose homeostasis, but increasing evidence showed that they remained fundamental to normal cartilage development [38]. Further studies indicated that PPARγ deficiency facilitated the formation of accelerated spontaneous OA, whereas PPARγ preservation alleviated the development and progression of OA [39, 40]. Furthermore, increasing evidence indicated that PI3K-Akt signaling pathway participated in the pathogenesis of OA and inhibiting PI3K/AKT/NF-κB signal pathway repressed the progression of osteoarthritis [41, 42]. P53 was identified as an ultimate tumor-suppressor gene, but recent studies showed that it also involved in OA chondrocytes apoptosis. Islam and colleagues demonstrated that hydrostatic pressure induced OA chondrocytes apoptosis though upregulating the expression of p53 [43]. Hashimoto and coworkers found that p53 was overexpressed in OA chondrocytes and silencing of p53 can alleviate chondrocytes apoptosis induced by shear strain [44]. These studies implied that downregulation of p53 may act as a potential therapeutic approach in OA treatment. Taken together, these important biological processes and pathways induced by miR-10a-5p played important roles in OA, which enlarged our understanding for the underlying mechanism of miR-10a-5p in OA and may provide novel therapeutic targets for OA.
We also performed PPI network analysis for differentially-expressed mRNAs induced by miR-10a-5p. A total of 42 hub genes were identified in the PPI network including SERPINA1, TTR, APOA1, and A2M. Previous studies found that SERPINA1, a chondrogenic differentiation gene, was significantly up-regulated in OA [45, 46]. Furthermore, Yoshida et al. identified that alpha1-antitrypsin, a protein encoded by SERPINA1, could interact with ADAMTS-4 in vivo, although the potential significance of their interaction was largely unknown [47]. Therefore, the possible roles and mechanism of SERPINA1 in OA should be further elucidated. TTR, a common amyloidogenic protein, was found to be highly deposited in OA cartilage and promoted OA progression [48, 49]. Moreover, TTR deposition inducing extracellular matrix degeneration can be alleviated in part by TLR4 and p38 MAPK [48]. APOA1, a protein related to lipid metabolism, was also deposited in OA cartilage [50]. Further studies showed that the expression levels of IL-6, MMP-1 and MMP-3 were significantly upregulated after stimulating chondrocytes and fibroblast-like synoviocytes with ApoA1. Interestingly, Tsezou et al. revealed that cholesterol efflux genes including ApoA1 were significantly downregulated in OA cartilage and activation of cholesterol efflux through LXR agonist increased the expression of ApoA1 [51]. Regardless of those inconsistences, the dysfunction of ApoA1 may act as a critical player in OA and further studies should be warranted to clarify its roles in OA. A2M was identified as an endogenous inhibitor to the ADAMTS family including ADAMTS-4, ADAMTS-5, ADAMTS-7, and ADAMTS-12, which were critical aggrecanase responsible for aggrecan degradation in OA [52, 53]. In addition, intra-articular injection of A2M significantly suppressed the progression of OA in vivo, which suggested that A2M may be a promising target for OA treatment [54]. Considering the potential roles of these hub genes in OA, we postulated that miR-10a-5p may promote the development of OA through regulating the important hub genes.
Apart from downregulation of mRNAs, miR-10a-5p overexpression also induced downregulation or upregulation of numerous ncRNAs including miRNAs, lncRNAs, and circRNAs. Many studies revealed that TFs regulated the expression of RNAs. Therefore, downregulation of TFs induced by miR-10a-5p overexpression may be responsible for inhibitory expression of ncRNAs. Conventionally, miRNAs were thought to function in RNA silencing, but recent studies demonstrated that miRNAs located in the nucleus, or NamiRNA could activate gene transcription by targeting enhancers [55]. Accordingly, miR-10a-5p in the nucleus might bind to some key enhancers, thus promoting the upregulation of ncRNAs and mRNAs. We also constructed the ceRNA regulatory networks centralized on significant upregulated and downregulated miRNAs triggered by miR-10a-5p. The regulatory networks reflected the complicated molecular mechanisms of miR-10a-5p involving in OA, which might provide potential scientific foundation for future studies.
Mountains of studies demonstrated that miRNAs regulated the expression of genes through binding to the 3' untranslated regions (UTRs) of target mRNAs, so we also identified the potential direct targets of miR-10a-5p in OA. We found that HOXA3 acted as a downstream target of miR-10a-5p. HOXA3 was a member of homeobox (HOX) genes and previous studies revealed that dysfunction of HOX genes may be associated with initiation and development of OA, although the exact mechanism remained to be further explored [56]. To further verify the results from bioinformatics analyses, we merely chose one of the most representative downstream genes, HOXA3(the targeted gene of miR-10a-5p) to verify the predicted mechanisms. We found that HOXA3 was down-regulated in OA and silencing of HOXA3 inhibited chondrocyte proliferation, promoted chondrocyte apoptosis and cartilage matrix degradation. Furthermore, we also demonstrated that miR-10a-5p exerted biological functions in OA cell model by targeting HOXA3. Collectively, our findings demonstrated that miR-10a-5p accelerated the progression of OA by targeting HOXA3.
To sum up, the current study revealed that overexpression of miR-10a-5p inhibited chondrocyte proliferation and facilitated chondrocyte apoptosis and cartilage matrix degradation. Furthermore, bioinformatics analyses followed by experimental verification indicated that miR-10a-5p facilitated the progression of OA through triggering the alterations of the whole transcriptome. Our findings shed insight on regulatory mechanism of miR-10a-5p involving in the pathogenesis of OA, which might provide novel therapeutic targets for OA.
Materials and Methods
Clinical sample collection and animal experiments
Degenerative articular cartilage tissues were obtained from eight OA patients undergoing total hip arthroplasty, while control tissues from seven patients with femoral neck fracture undergoing total hip arthroplasty. Peripheral blood(6ml) from elbow venous blood of another OA patients(n=8) and matched non-OA patients(n=8) were collected for further peripheral blood mononuclear cell (PBMC) isolation. PBMCs were separated using density centrifugation(400×g for 30 min) at room temperature after 6ml of blood was layered onto the same volume of Histopaque-1077 (Sigma-Aldrich). Adult male C57BL/6 mice (n=6; 8 weeks old) from Guangdong Medical Laboratory Animal Center were used to induce DMM OA models as previously described [57]. DMM operations and sham operations were performed in the right knee joints of the mice in DMM group and control group respectively. The left ones of all the mice remained intact. Furthermore, the right knee joints were harvested for subsequent histological analysis. Briefly, knee joints were fixed in 4% paraformaldehyde for 24 h, decalcified in 10% EDTA for 10 days and embedded in paraffin. The medial compartment of the joints was cut into 5 micrometer thick sections and the sections were stained with H&E. All subjects were provided written informed consents before the study. This study was approved by the Human and Animal Experiments Ethics Committee of the Fifth Affiliated Hospital of Sun Yat-Sen University.
Cell culture and cell transfection
Human primary chondrocytes (HC-a; Catalog #4650) was purchased from ScienCell Research Laboratories. The cells were seeded into 35mm dishes (Corning Incorporated) and maintained in Chondrocyte Medium (ScienCell, Catalog #4651) in a humidified incubator at 37 °C with 5% CO2. Only cells within the fifth passage were used for the current experiments. miR-10a-5p mimics and NC were purchased from Guangzhou RiboBio (Guangzhou, China). Si-HOXA3 and their negative controls were purchased from GenePharma (Shanghai, China). The sequences for si-HOXA3 are shown in Supplementary Table 1. Cell transfection was undertaken using Lipofectamine 3000(Invitrogen) according to the protocol of the manufacturer. Cells were harvested for further experiments at 48 hours after transfection.
Cell viability assay and edu staining
Cell viability was detected using the Cell Counting Kit-8(CCK-8) assay (Dojindo). Cells were seeded into 96-well plates (5000 cells per well) and transfected with miR-10a-5p mimics and mimic-NC or si-NC and si-HOXA3 for 24h, 48h, 72h, and 96h. The OD absorbance at 450 nm was measured with Synergy™ HTX Multi-Mode Microplate Reader (BioTek). Edu staining was performed following the previous protocol [58].
Flow cytometry assay
Flow cytometry was used to detect the apoptosis rate of HC-a using FITC Annexin V Apoptosis Detection Kit I (BD Pharmingen™) following the protocol of the manufacturer. At 48 hours after transfection, cells were washed and collected using pre-chilled phosphate-buffered saline. And then, cells were resuspended in 100 μL of annexin binding buffer(1x) followed by incubating with 5 μL of FITC annexin V and 5 μL of PI working solution at room temperature for 15 min. Subsequently, 400 μL of annexin binding buffer(1x) was added to the mixture. Finally, the apoptosis rate of cells was analyzed by CytoFLEX LX Flow Cytometer (Beckman Coulter).
RNA isolation, reverse transcription (RT), and real-time quantitative PCR (RT-qPCR)
Total RNA from tissues (articular cartilage) and cells (PBMCs and HC-a) was isolated using HP Total RNA Kit and EZNA Total RNA kit I (Omega Bio-tek, USA) respectively, following the protocols of the manufacturer. The concentration of RNA was measured using NanoDrop 2000 (Thermo Scientific). RNA was synthesized into cDNA using RevertAid First Strand cDNA Synthesis Kit (Thermo Scientific) following the protocols of the manufacturer. PCR reaction was performed with Forget-Me-Not™ EvaGreen® qPCR Master Mix (Biotium) using CFX96TM Real-Time PCR Detection Systems (BIO-RAD) as following: 95°C for 2 min and then 40 cycles of 95°C for 5s, 60°C for 10s, and 72°C for 10s. The relative expression were calculated using the 2-ΔΔCt method. The bulge-loop™ miRNA qRT-PCR Primer Set (one RT primer and a pair of qPCR primers) specific for has-miR-10a-5p is designed and synthetized by RiboBio(Guangzhou, China). The expression of miRNA was normalized to U6, while mRNA, lncRNA, and circRNA normalized to GAPDH. The primer sequences are shown in Supplementary Table 1.
Western blot
The total protein of cells was extracted using RIPA buffer (Solarbio Biotech, Beijing, China). Protein concentrations were examined using BCATM protein assay kit (Beyotime Biotechnology, Shanghai, China). A total of 30ug protein was loaded onto the PAGE (EpiZyme, Shanghai, China), separated by electrophoresis and then transferred onto PVDF membranes (Immunoblot, Bio-Rad). The membranes were blocked with 5% non-fat milk (Difco™ Skim Milk, BD) for 1 h at room temperature and incubated with primary antibodies against COL2A1 (Proteintech, Wuhan, China), MMP13(Santa Cruz, UK), BAX(CST, USA), HOXA3(Santa Cruz, USA), GAPDH(CST, USA) at 4 °C overnight. Next, the membranes were incubated with secondary antibodies(Santa Cruz, USA) for 1 h at room temperature. The protein signaling were visualized with ECL chemiluminescence kit(Santa Cruz Biotechnology, Dallas, TX, USA) using Molecular Imager ChemiDoc XRS System(Bio-Rad).
High throughput sequencing and bioinformatics analysis
The total RNA from HC-a transfected with miR-10a-5p mimics or NC were extracted using the aforementioned methods. The concentration and integrity of total RNA was examined using Qubit 3.0 Fluorometer (Invitrogen, Carlsbad, California) and Agilent 2100 Bioanalyzer (Applied Biosystems, Carlsbad, CA), respectively. High throughput sequencing for the whole transcriptome were performed at Guangzhou Geneseed Biotech Co.,Ltd (Guangzhou, China). Briefly, mRNA, lncRNA and circRNA libraries were established using Total RNA-seq(H/M/R) Library Prep Kit (Illumina) after ribosomal RNA depletion. High throughput sequencing was performed to obtain raw reads on Illumina HiSeq X10 PE150(Illumina, San Diego, CA) after finishing RNA library construction and quality control using Agilent 2100 Bioanalyzer. And then, clean reads were selected after filtering out low-quality data, reads containing jointed-sequence, and reads containing many N sequences from raw reads. Furthermore, effective reads were obtained following removing ribosomal RNA sequences. For mRNAs expression analysis, the reads were mapped to the latest UCSC transcript set using Bowtie 2 version 2.1.0 and the transcripts set from Lncipedia was used for lncRNAs expression analysis [59, 60]. For circRNA expression analysis, the reads were mapped to genome using the STAR and DCC was used to identify the cirRNA and estimate the circRNA expression [61, 62]. For miRNA sequencing, small RNA library was prepared using VAHTSTM Small RNA Library Prep Kit for Illumina®(Vazyme Biotech). ExceRpt was used to estimate the miRNA expression in miRBase and novel miRNAs were identified with miRDeep2 [63]. TMM (trimmed mean of M-values) was used to normalize the expression of lncRNA, mRNA, circRNA, and miRNA. Differentially expressed genes were identified using the edgeR program and differentially-expressed genes with adjusted p-value < 0.1 and more than two fold changes were considered to be significant. GO enrichment analyses were visualized using GO plot package, while KEGG enrichment analyses using clusterProfiler package. Protein-protein interaction(PPI) network analysis for differentially expressed mRNAs was performed using String 11.0 and CytoHubba was employed to identify hub genes in the PPI network [64]. Molecular complex detection (MCODE) was used to identify key modules from PPI networks with default algorithms. Network-based gene set enrichment analysis for differentially expressed mRNAs was undertaken using NGSEA [65]. miRanda was used to predict the potential binding relationship between differentially expressed miRNAs and mRNAs, lncRNAs and circRNAs. The circRNA–miRNA–mRNA and lncRNA–miRNA–mRNA regulatory networks were visualized using the Cystoscope software V3.6.0.
Luciferase reporter assay
To verify the interaction between miR-10a-5p and HOXA3, 293T cells were co-transfected with either the WT or mutated HOXA3 reporter plasmids and miR-10a-5p mimics or miR-NC. After 48 h of incubation, the luciferase signals were measured with a Dual Luciferase Reporter Assay System (Promega).
Statistical analysis
All the statistical analyses were performed using GraphPad Prism 7.0(GraphPad Software Inc., San Diego, CA). Student T-test was employed to compare the difference across two groups. Results are reported as the mean ± standard deviation (SD). A p value less than 0.05 was considered to be statistically significant.
Supplementary Materials
Author Contributions
Conceptualization, Hui-Zi Li, Xiang-He Xu, Zhong-Zhen Su and Hua-Ding Lu; Data curation, Hui-Zi Li and Da-Wei Wang; Formal analysis, Hui-Zi Li, Xiang-He Xu, Yi-Ming Lin, Zhong-Zhen Su and Hua-Ding Lu; Investigation, Hui-Zi Li; Methodology, Hui-Zi Li, Xiang-He Xu, Da-Wei Wang, Nan Lin, Zhong-Zhen Su and Hua-Ding Lu; Project administration, Xiang-He Xu and Hua-Ding Lu; Software, Da-Wei Wang, Yi-Ming Lin and Nan Lin; Visualization, Xiang-He Xu and Hua-Ding Lu; Writing – original draft, Hui-Zi Li, Xiang-He Xu, Zhong-Zhen Su and Hua-Ding Lu; Writing – review and editing, Hui-Zi Li, Xiang-He Xu, Zhong-Zhen Su and Hua-Ding Lu.
Acknowledgments
We thank MS. Lei Xiao and Xiao-Yi Li for their help in manuscript preparation and spiritual assistance.
Conflicts of Interest
The authors declare no conflicts of interest.
Funding
This study was supported by grants from the National Natural Science Foundation of China (nos. 81772384, 81572174, and 81902242). The funders had no role in the study design, data collection and analysis, decision to publish, or preparation of the manuscript.
References
- 1. Wilson R, Blakely T, Abbott JH. Radiographic knee osteoarthritis impacts multiple dimensions of health-related quality of life: data from the Osteoarthritis Initiative. Rheumatology (Oxford). 2018; 57:891–99. https://doi.org/10.1093/rheumatology/key008 [PubMed]
- 2. Kontio T, Viikari-Juntura E, Solovieva S. Effect of Osteoarthritis on Work Participation and Loss of Working Life-years. J Rheumatol. 2020; 47:597–604. https://doi.org/10.3899/jrheum.181284 [PubMed]
- 3. Nüesch E, Dieppe P, Reichenbach S, Williams S, Iff S, Jüni P. All cause and disease specific mortality in patients with knee or hip osteoarthritis: population based cohort study. BMJ. 2011; 342:d1165. https://doi.org/10.1136/bmj.d1165 [PubMed]
- 4. Misra D, Fielding RA, Felson DT, Niu J, Brown C, Nevitt M, Lewis CE, Torner J, Neogi T, and MOST study. Risk of Knee Osteoarthritis With Obesity, Sarcopenic Obesity, and Sarcopenia. Arthritis Rheumatol. 2019; 71:232–37. https://doi.org/10.1002/art.40692 [PubMed]
- 5. Loeser RF, Collins JA, Diekman BO. Ageing and the pathogenesis of osteoarthritis. Nat Rev Rheumatol. 2016; 12:412–20. https://doi.org/10.1038/nrrheum.2016.65 [PubMed]
- 6. Wallace IJ, Worthington S, Felson DT, Jurmain RD, Wren KT, Maijanen H, Woods RJ, Lieberman DE. Knee osteoarthritis has doubled in prevalence since the mid-20th century. Proc Natl Acad Sci USA. 2017; 114:9332–36. https://doi.org/10.1073/pnas.1703856114 [PubMed]
- 7. Deshpande BR, Katz JN, Solomon DH, Yelin EH, Hunter DJ, Messier SP, Suter LG, Losina E. Number of Persons With Symptomatic Knee Osteoarthritis in the US: Impact of Race and Ethnicity, Age, Sex, and Obesity. Arthritis Care Res (Hoboken). 2016; 68:1743–50. https://doi.org/10.1002/acr.22897 [PubMed]
- 8. Gregori D, Giacovelli G, Minto C, Barbetta B, Gualtieri F, Azzolina D, Vaghi P, Rovati LC. Association of Pharmacological Treatments With Long-term Pain Control in Patients With Knee Osteoarthritis: A Systematic Review and Meta-analysis. JAMA. 2018; 320:2564–79. https://doi.org/10.1001/jama.2018.19319 [PubMed]
- 9. Hunter DJ, Bierma-Zeinstra S. Osteoarthritis. Lancet. 2019; 393:1745–59. https://doi.org/10.1016/S0140-6736(19)30417-9 [PubMed]
- 10. Valdes AM, Spector TD. Genetic epidemiology of hip and knee osteoarthritis. Nat Rev Rheumatol. 2011; 7:23–32. https://doi.org/10.1038/nrrheum.2010.191 [PubMed]
- 11. Beermann J, Piccoli MT, Viereck J, Thum T. Non-coding RNAs in Development and Disease: Background, Mechanisms, and Therapeutic Approaches. Physiol Rev. 2016; 96:1297–325. https://doi.org/10.1152/physrev.00041.2015 [PubMed]
- 12. Brandenburger T, Salgado Somoza A, Devaux Y, Lorenzen JM. Noncoding RNAs in acute kidney injury. Kidney Int. 2018; 94:870–81. https://doi.org/10.1016/j.kint.2018.06.033 [PubMed]
- 13. Eulalio A, Huntzinger E, Izaurralde E. Getting to the root of miRNA-mediated gene silencing. Cell. 2008; 132:9–14. https://doi.org/10.1016/j.cell.2007.12.024 [PubMed]
- 14. Fatemi RP, Velmeshev D, Faghihi MA. De-repressing LncRNA-Targeted Genes to Upregulate Gene Expression: Focus on Small Molecule Therapeutics. Mol Ther Nucleic Acids. 2014; 3:e196. https://doi.org/10.1038/mtna.2014.45 [PubMed]
- 15. Han B, Chao J, Yao H. Circular RNA and its mechanisms in disease: from the bench to the clinic. Pharmacol Ther. 2018; 187:31–44. https://doi.org/10.1016/j.pharmthera.2018.01.010 [PubMed]
- 16. Coutinho de Almeida R, Ramos YF, Mahfouz A, den Hollander W, Lakenberg N, Houtman E, van Hoolwerff M, Suchiman HE, Rodríguez Ruiz A, Slagboom PE, Mei H, Kiełbasa SM, Nelissen RG, et al. RNA sequencing data integration reveals an miRNA interactome of osteoarthritis cartilage. Ann Rheum Dis. 2019; 78:270–77. https://doi.org/10.1136/annrheumdis-2018-213882 [PubMed]
- 17. Shen S, Wu Y, Chen J, Xie Z, Huang K, Wang G, Yang Y, Ni W, Chen Z, Shi P, Ma Y, Fan S. CircSERPINE2 protects against osteoarthritis by targeting miR-1271 and ETS-related gene. Ann Rheum Dis. 2019; 78:826–36. https://doi.org/10.1136/annrheumdis-2018-214786 [PubMed]
- 18. Xiao K, Yang Y, Bian Y, Feng B, Li Z, Wu Z, Qiu G, Weng X. Identification of differentially expressed long noncoding RNAs in human knee osteoarthritis. J Cell Biochem. 2019; 120:4620–33. https://doi.org/10.1002/jcb.27750 [PubMed]
- 19. Wang H, Zhang H, Sun Q, Wang Y, Yang J, Yang J, Zhang T, Luo S, Wang L, Jiang Y, Zeng C, Cai D, Bai X. Intra-articular Delivery of Antago-miR-483-5p Inhibits Osteoarthritis by Modulating Matrilin 3 and Tissue Inhibitor of Metalloproteinase 2. Mol Ther. 2017; 25:715–27. https://doi.org/10.1016/j.ymthe.2016.12.020 [PubMed]
- 20. Li Y, Li Z, Li C, Zeng Y, Liu Y. Long noncoding RNA TM1P3 is involved in osteoarthritis by mediating chondrocyte extracellular matrix degradation. J Cell Biochem. 2019; 120:12702–12. https://doi.org/10.1002/jcb.28539 [PubMed]
- 21. Salmena L, Poliseno L, Tay Y, Kats L, Pandolfi PP. A ceRNA hypothesis: the Rosetta Stone of a hidden RNA language? Cell. 2011; 146:353–58. https://doi.org/10.1016/j.cell.2011.07.014 [PubMed]
- 22. Pan Z, Li GF, Sun ML, Xie L, Liu D, Zhang Q, Yang XX, Xia S, Liu X, Zhou H, Xue ZY, Zhang M, Hao LY, et al. MicroRNA-1224 Splicing CircularRNA-Filip1l in an Ago2-Dependent Manner Regulates Chronic Inflammatory Pain via Targeting Ubr5. J Neurosci. 2019; 39:2125–43. https://doi.org/10.1523/JNEUROSCI.1631-18.2018 [PubMed]
- 23. Ye P, Shi Y, An N, Zhou Q, Guo J, Long X. miR-145 overexpression triggers alteration of the whole transcriptome and inhibits breast cancer development. Biomed Pharmacother. 2018; 100:72–82. https://doi.org/10.1016/j.biopha.2018.01.167 [PubMed]
- 24. Hussain N, Zhu W, Jiang C, Xu J, Wu X, Geng M, Hussain S, Cai Y, Xu K, Xu P, Han Y, Sun J, Meng L, Lu S. Down-regulation of miR-10a-5p in synoviocytes contributes to TBX5-controlled joint inflammation. J Cell Mol Med. 2018; 22:241–50. https://doi.org/10.1111/jcmm.13312 [PubMed]
- 25. Hussain N, Zhu W, Jiang C, Xu J, Geng M, Wu X, Hussain S, Wang B, Rajoka MS, Li Y, Tian J, Meng L, Lu S. Down-regulation of miR-10a-5p promotes proliferation and restricts apoptosis via targeting T-box transcription factor 5 in inflamed synoviocytes. Biosci Rep. 2018; 38:38. https://doi.org/10.1042/BSR20180003 [PubMed]
- 26. Vaher H, Runnel T, Urgard E, Aab A, Carreras Badosa G, Maslovskaja J, Abram K, Raam L, Kaldvee B, Annilo T, Tkaczyk ER, Maimets T, Akdis CA, et al. miR-10a-5p is increased in atopic dermatitis and has capacity to inhibit keratinocyte proliferation. Allergy. 2019; 74:2146–56. https://doi.org/10.1111/all.13849 [PubMed]
- 27. Ma Y, Wu Y, Chen J, Huang K, Ji B, Chen Z, Wang Q, Ma J, Shen S, Zhang J. miR-10a-5p Promotes Chondrocyte Apoptosis in Osteoarthritis by Targeting HOXA1. Mol Ther Nucleic Acids. 2019; 14:398–409. https://doi.org/10.1016/j.omtn.2018.12.012 [PubMed]
- 28. Hu Q, Gong W, Gu J, Geng G, Li T, Tian R, Yang Z, Zhang H, Shao L, Liu T, Wan L, Jia J, Yang C, et al. Plasma microRNA Profiles as a Potential Biomarker in Differentiating Adult-Onset Still’s Disease From Sepsis. Front Immunol. 2019; 9:3099. https://doi.org/10.3389/fimmu.2018.03099 [PubMed]
- 29. Guo G, Wang H, Shi X, Ye L, Wu K, Lin K, Ye S, Li B, Zhang H, Lin Q, Ye S, Xue X, Chen C. NovelmiRNA-25 inhibits AMPD2 in peripheral blood mononuclear cells of patients with systemic lupus erythematosus and represents a promising novel biomarker. J Transl Med. 2018; 16:370. https://doi.org/10.1186/s12967-018-1739-5 [PubMed]
- 30. Zhou Y, Zhou B, Pache L, Chang M, Khodabakhshi AH, Tanaseichuk O, Benner C, Chanda SK. Metascape provides a biologist-oriented resource for the analysis of systems-level datasets. Nat Commun. 2019; 10:1523. https://doi.org/10.1038/s41467-019-09234-6 [PubMed]
- 31. Torre D, Lachmann A, Ma’ayan A. BioJupies: Automated Generation of Interactive Notebooks for RNA-Seq Data Analysis in the Cloud. Cell Syst. 2018; 7:556–561.e3. https://doi.org/10.1016/j.cels.2018.10.007 [PubMed]
- 32. Karagkouni D, Paraskevopoulou MD, Chatzopoulos S, Vlachos IS, Tastsoglou S, Kanellos I, Papadimitriou D, Kavakiotis I, Maniou S, Skoufos G, Vergoulis T, Dalamagas T, Hatzigeorgiou AG. DIANA-TarBase v8: a decade-long collection of experimentally supported miRNA-gene interactions. Nucleic Acids Res. 2018; 46:D239–45. https://doi.org/10.1093/nar/gkx1141 [PubMed]
- 33. Shi Y, Hu X, Cheng J, Zhang X, Zhao F, Shi W, Ren B, Yu H, Yang P, Li Z, Liu Q, Liu Z, Duan X, et al. A small molecule promotes cartilage extracellular matrix generation and inhibits osteoarthritis development. Nat Commun. 2019; 10:1914. https://doi.org/10.1038/s41467-019-09839-x [PubMed]
- 34. Wang XB, Zhao FC, Yi LH, Tang JL, Zhu ZY, Pang Y, Chen YS, Li DY, Guo KJ, Zheng X. MicroRNA-21-5p as a novel therapeutic target for osteoarthritis. Rheumatology (Oxford). 2019. [Epub ahead of print]. https://doi.org/10.1093/rheumatology/kez102 [PubMed]
- 35. Flannery CR, Zeng W, Corcoran C, Collins-Racie LA, Chockalingam PS, Hebert T, Mackie SA, McDonagh T, Crawford TK, Tomkinson KN, LaVallie ER, Morris EA. Autocatalytic cleavage of ADAMTS-4 (Aggrecanase-1) reveals multiple glycosaminoglycan-binding sites. J Biol Chem. 2002; 277:42775–80. https://doi.org/10.1074/jbc.M205309200 [PubMed]
- 36. Rucci N, Rufo A, Alamanou M, Capulli M, Del Fattore A, Ahrman E, Capece D, Iansante V, Zazzeroni F, Alesse E, Heinegård D, Teti A. The glycosaminoglycan-binding domain of PRELP acts as a cell type-specific NF-kappaB inhibitor that impairs osteoclastogenesis. J Cell Biol. 2009; 187:669–83. https://doi.org/10.1083/jcb.200906014 [PubMed]
- 37. Choi MC, Jo J, Park J, Kang HK, Park Y. NF-κB Signaling Pathways in Osteoarthritic Cartilage Destruction. Cells. 2019; 8:8. https://doi.org/10.3390/cells8070734 [PubMed]
- 38. Monemdjou R, Vasheghani F, Fahmi H, Perez G, Blati M, Taniguchi N, Lotz M, St-Arnaud R, Pelletier JP, Martel-Pelletier J, Beier F, Kapoor M. Association of cartilage-specific deletion of peroxisome proliferator-activated receptor γ with abnormal endochondral ossification and impaired cartilage growth and development in a murine model. Arthritis Rheum. 2012; 64:1551–61. https://doi.org/10.1002/art.33490 [PubMed]
- 39. Vasheghani F, Zhang Y, Li YH, Blati M, Fahmi H, Lussier B, Roughley P, Lagares D, Endisha H, Saffar B, Lajeunesse D, Marshall WK, Rampersaud YR, et al. PPARγ deficiency results in severe, accelerated osteoarthritis associated with aberrant mTOR signalling in the articular cartilage. Ann Rheum Dis. 2015; 74:569–78. https://doi.org/10.1136/annrheumdis-2014-205743 [PubMed]
- 40. Zhu X, Chen F, Lu K, Wei A, Jiang Q, Cao W. PPARγ preservation via promoter demethylation alleviates osteoarthritis in mice. Ann Rheum Dis. 2019; 78:1420–29. https://doi.org/10.1136/annrheumdis-2018-214940 [PubMed]
- 41. Lin C, Shao Y, Zeng C, Zhao C, Fang H, Wang L, Pan J, Liu L, Qi W, Feng X, Qiu H, Zhang H, Chen Y, et al. Blocking PI3K/AKT signaling inhibits bone sclerosis in subchondral bone and attenuates post-traumatic osteoarthritis. J Cell Physiol. 2018; 233:6135–47. https://doi.org/10.1002/jcp.26460 [PubMed]
- 42. Xie L, Xie H, Chen C, Tao Z, Zhang C, Cai L. Inhibiting the PI3K/AKT/NF-κB signal pathway with nobiletin for attenuating the development of osteoarthritis: in vitro and in vivo studies. Food Funct. 2019; 10:2161–75. https://doi.org/10.1039/C8FO01786G [PubMed]
- 43. Islam N, Haqqi TM, Jepsen KJ, Kraay M, Welter JF, Goldberg VM, Malemud CJ. Hydrostatic pressure induces apoptosis in human chondrocytes from osteoarthritic cartilage through up-regulation of tumor necrosis factor-alpha, inducible nitric oxide synthase, p53, c-myc, and bax-alpha, and suppression of bcl-2. J Cell Biochem. 2002; 87:266–78. https://doi.org/10.1002/jcb.10317 [PubMed]
- 44. Hashimoto S, Nishiyama T, Hayashi S, Fujishiro T, Takebe K, Kanzaki N, Kuroda R, Kurosaka M. Role of p53 in human chondrocyte apoptosis in response to shear strain. Arthritis Rheum. 2009; 60:2340–49. https://doi.org/10.1002/art.24706 [PubMed]
- 45. Boeuf S, Steck E, Pelttari K, Hennig T, Buneb A, Benz K, Witte D, Sültmann H, Poustka A, Richter W. Subtractive gene expression profiling of articular cartilage and mesenchymal stem cells: serpins as cartilage-relevant differentiation markers. Osteoarthritis Cartilage. 2008; 16:48–60. https://doi.org/10.1016/j.joca.2007.05.008 [PubMed]
- 46. Wei T, Kulkarni NH, Zeng QQ, Helvering LM, Lin X, Lawrence F, Hale L, Chambers MG, Lin C, Harvey A, Ma YL, Cain RL, Oskins J, et al. Analysis of early changes in the articular cartilage transcriptisome in the rat meniscal tear model of osteoarthritis: pathway comparisons with the rat anterior cruciate transection model and with human osteoarthritic cartilage. Osteoarthritis Cartilage. 2010; 18:992–1000. https://doi.org/10.1016/j.joca.2010.04.012 [PubMed]
- 47. Yoshida K, Suzuki Y, Saito A, Fukuda K, Hamanishi C, Munakata H. Aggrecanase-1 (ADAMTS-4) interacts with alpha1-antitrypsin. Biochim Biophys Acta. 2005; 1725:152–59. https://doi.org/10.1016/j.bbagen.2005.06.009 [PubMed]
- 48. Akasaki Y, Reixach N, Matsuzaki T, Alvarez-Garcia O, Olmer M, Iwamoto Y, Buxbaum JN, Lotz MK. Transthyretin deposition in articular cartilage: a novel mechanism in the pathogenesis of osteoarthritis. Arthritis Rheumatol. 2015; 67:2097–107. https://doi.org/10.1002/art.39178 [PubMed]
- 49. Matsuzaki T, Akasaki Y, Olmer M, Alvarez-Garcia O, Reixach N, Buxbaum JN, Lotz MK. Transthyretin deposition promotes progression of osteoarthritis. Aging Cell. 2017; 16:1313–22. https://doi.org/10.1111/acel.12665 [PubMed]
- 50. Yanagisawa A, Ueda M, Sueyoshi T, Nakamura E, Tasaki M, Suenaga G, Motokawa H, Toyoshima R, Kinoshita Y, Misumi Y, Yamashita T, Sakaguchi M, Westermark P, et al. Knee osteoarthritis associated with different kinds of amyloid deposits and the impact of aging on type of amyloid. Amyloid. 2016; 23:26–32. https://doi.org/10.3109/13506129.2015.1115758 [PubMed]
- 51. Tsezou A, Iliopoulos D, Malizos KN, Simopoulou T. Impaired expression of genes regulating cholesterol efflux in human osteoarthritic chondrocytes. J Orthop Res. 2010; 28:1033–39. https://doi.org/10.1002/jor.21084 [PubMed]
- 52. Tortorella MD, Arner EC, Hills R, Easton A, Korte-Sarfaty J, Fok K, Wittwer AJ, Liu RQ, Malfait AM. Alpha2-macroglobulin is a novel substrate for ADAMTS-4 and ADAMTS-5 and represents an endogenous inhibitor of these enzymes. J Biol Chem. 2004; 279:17554–61. https://doi.org/10.1074/jbc.M313041200 [PubMed]
- 53. Luan Y, Kong L, Howell DR, Ilalov K, Fajardo M, Bai XH, Di Cesare PE, Goldring MB, Abramson SB, Liu CJ. Inhibition of ADAMTS-7 and ADAMTS-12 degradation of cartilage oligomeric matrix protein by alpha-2-macroglobulin. Osteoarthritis Cartilage. 2008; 16:1413–20. https://doi.org/10.1016/j.joca.2008.03.017 [PubMed]
- 54. Wang S, Wei X, Zhou J, Zhang J, Li K, Chen Q, Terek R, Fleming BC, Goldring MB, Ehrlich MG, Zhang G, Wei L. Identification of α2-macroglobulin as a master inhibitor of cartilage-degrading factors that attenuates the progression of posttraumatic osteoarthritis. Arthritis Rheumatol. 2014; 66:1843–53. https://doi.org/10.1002/art.38576 [PubMed]
- 55. Xiao M, Li J, Li W, Wang Y, Wu F, Xi Y, Zhang L, Ding C, Luo H, Li Y, Peng L, Zhao L, Peng S, et al. MicroRNAs activate gene transcription epigenetically as an enhancer trigger. RNA Biol. 2017; 14:1326–34. https://doi.org/10.1080/15476286.2015.1112487 [PubMed]
- 56. Pelttari K, Barbero A, Martin I. A potential role of homeobox transcription factors in osteoarthritis. Ann Transl Med. 2015; 3:254. https://doi.org/10.3978/j.issn.2305-5839.2015.09.44 [PubMed]
- 57. Sophocleous A, Huesa C. Osteoarthritis Mouse Model of Destabilization of the Medial Meniscus. Methods Mol Biol. 2019; 1914:281–93. https://doi.org/10.1007/978-1-4939-8997-3_15 [PubMed]
- 58. Zhou ZB, Huang GX, Fu Q, Han B, Lu JJ, Chen AM, Zhu L. circRNA.33186 Contributes to the Pathogenesis of Osteoarthritis by Sponging miR-127-5p. Mol Ther. 2019; 27:531–41. https://doi.org/10.1016/j.ymthe.2019.01.006 [PubMed]
- 59. Langmead B, Salzberg SL. Fast gapped-read alignment with Bowtie 2. Nat Methods. 2012; 9:357–59. https://doi.org/10.1038/nmeth.1923 [PubMed]
- 60. Volders PJ, Anckaert J, Verheggen K, Nuytens J, Martens L, Mestdagh P, Vandesompele J. LNCipedia 5: towards a reference set of human long non-coding RNAs. Nucleic Acids Res. 2019; 47:D135–39. https://doi.org/10.1093/nar/gky1031 [PubMed]
- 61. Dobin A, Davis CA, Schlesinger F, Drenkow J, Zaleski C, Jha S, Batut P, Chaisson M, Gingeras TR. STAR: ultrafast universal RNA-seq aligner. Bioinformatics. 2013; 29:15–21. https://doi.org/10.1093/bioinformatics/bts635 [PubMed]
- 62. Cheng J, Metge F, Dieterich C. Specific identification and quantification of circular RNAs from sequencing data. Bioinformatics. 2016; 32:1094–96. https://doi.org/10.1093/bioinformatics/btv656 [PubMed]
- 63. Friedländer MR, Mackowiak SD, Li N, Chen W, Rajewsky N. miRDeep2 accurately identifies known and hundreds of novel microRNA genes in seven animal clades. Nucleic Acids Res. 2012; 40:37–52. https://doi.org/10.1093/nar/gkr688 [PubMed]
- 64. Chin CH, Chen SH, Wu HH, Ho CW, Ko MT, Lin CY. cytoHubba: identifying hub objects and sub-networks from complex interactome. BMC Syst Biol. 2014 (Suppl 4); 8:S11. https://doi.org/10.1186/1752-0509-8-S4-S11 [PubMed]
- 65. Han H, Lee S, Lee I. NGSEA: Network-Based Gene Set Enrichment Analysis for Interpreting Gene Expression Phenotypes with Functional Gene Sets. Mol Cells. 2019; 42:579–88. https://doi.org/10.14348/molcells.2019.0065 [PubMed]