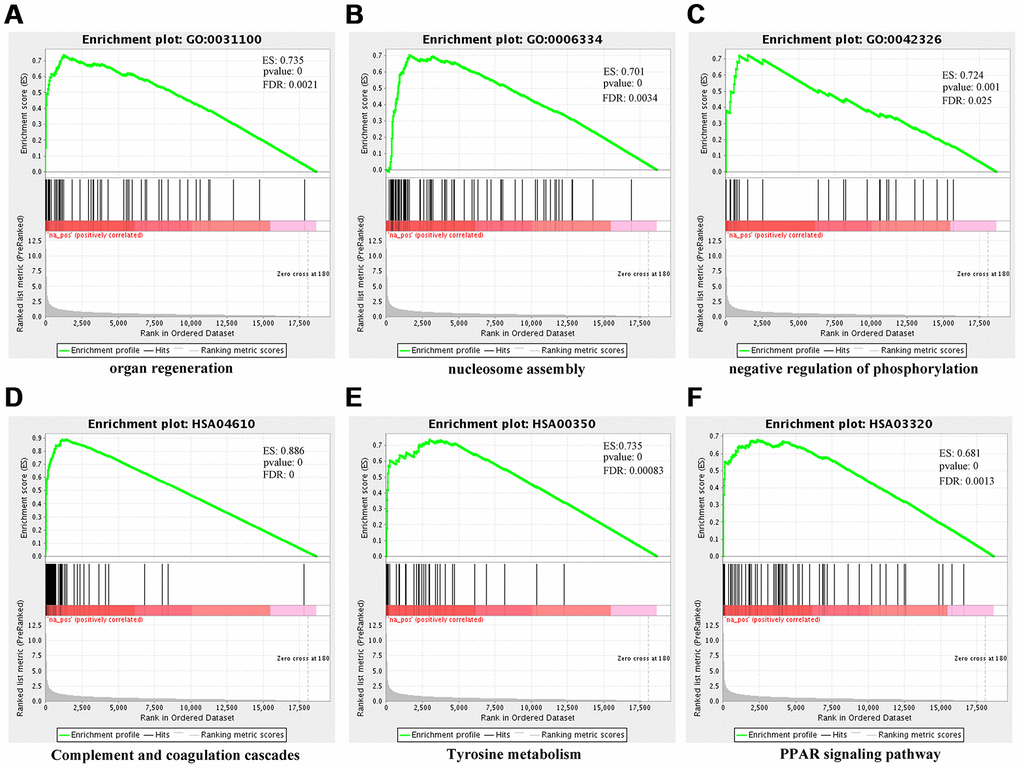
Figure 8.Gene set enrichment analysis (GSEA) for differentially-expressed mRNAs using NGSEA. Representative three significantly GO enrichment plot in GSEA: (A) organ regeneration (GO:0031100); (B) nucleosome assembly (GO:0006334); (C) negative regulation of phosphorylation. Representative three significantly KEGG enrichment plot in GSEA: (D) complement and coagulation cascades (HSA04610); (E) tyrosine metabolism (HSA00350); (F) PPAR signaling pathway (HSA03320).