


Introduction
As a global epidemic, chronic kidney disease (CKD) has severe personal and societal consequences [1]. Obstructive nephropathy (ON) is the renal disease caused by impaired flow of urine or tubular fluid, which refers to the presence of structural or functional changes in the urinary tract that impede the normal flow of urine [2]. Obstructive uropathy, which can lead to ON without timely intervention, is the main cause of CKD. Common obstructive factors include stones, blood clots, tumours and lymphadenopathy [3]. However, a considerable number of patients with ON have clinical characteristics that are difficult to detect; these patients are often symptomless in the early stages and have delitescent pathogenetic conditions.
Fibrosis is a hallmark of CKD and affects both the glomeruli and the tubules as well as causes renal vasculature alterations [4]. Considering the role of renal fibrosis in CKD with ON, we believe that understanding the formation, reversal and underlying mechanism of renal fibrosis could provide valuable insights and opportunities for improving monitoring techniques and therapeutic interventions for CKD caused by ON or even for other diseases.
Renal fibrosis is characterized by epithelial-mesenchymal transition (EMT), excess extracellular matrix (ECM) deposition and fibroblast and inflammatory cell accumulation in the interstitium [5–7]. Through EMT, tubular epithelial cells become myofibroblasts, which possess enhanced capacities for cell proliferation, motility, contraction and excess ECM deposition, thus leading to fibrosis [8, 9]. Increasing evidence suggests that numerous genes, including cytokines, growth factors, metabolic toxins, and stress molecules, are involved in the progression of renal fibrosis [10].
Transforming growth factor-β1 (TGF-β1), a well-studied profibrogenic cytokine, is synthesized by various cell types, such as epithelial cells, lymphocytes, platelets, fibroblasts, astrocytes, macrophages and kidney cells [11]. Previous studies have documented that TGF-β1 plays an important role in the progression of CKD because it promotes EMT and ECM deposition [12, 13]. Furthermore, as a multifunctional growth factor, TGF-β1 plays important roles in a variety of cellular processes, including growth, proliferation, cell cycle progression, development, differentiation, migration, invasion and inflammation [14, 15]. TGF-β1 exerts its function by modulating the TGF-β/Smad pathway, and it could be the master regulator of fibrosis [14, 16].
In recent years, a growing number of long non-coding RNAs (lncRNAs) have attracted increasing attention from researchers. LncRNAs are evolutionarily conserved non-protein-coding transcripts longer than 200 nucleotides [17, 18]. Emerging evidence has shown that lncRNAs play important roles in the physiological and pathological progression of human diseases [19–26]. Several lncRNAs, such as H19, MEG3, TUG1 and PVT1, are reportedly involved in CKD [27–30]. Thus, better understanding the roles and mechanisms of lncRNAs in the physiological and pathological progression of CKD will help elucidate possible opportunities for therapeutic CKD interventions. Metastasis associated lung adenocarcinoma transcript 1 (MALAT1) is involved in frequent tumours including renal cell carcinoma, bladder cancer, prostate cancer, breast cancer and so on [31]. Furthermore, MALAT1 can be involved in several other pathophysiological conditions such as myogenesis and synaptogenesis [32].
Focal adhesion kinase (FAK) is a protein tyrosine kinase that contributes to cancer progression and can play roles in EMT, radio-resistance, DNA damage repair and tumor immune evasion as well [33].
N6-methyladenosine (m6A) modification is the most abundant internal modification in eukaryotes [34]. The successive discoveries of m6A-binding proteins (“readers”), adenosine methyltransferases (“writers”) and m6A demethylating enzymes (“erasers”) demonstrated that the m6A modification is a reversible process [35–37]. While m6A modifications are known to modulate RNAs, including mRNAs and lncRNAs [34], the mechanisms of m6A modification in lncRNAs still need to be investigated. As the core methyltransferase subunit, methyltransferase-like 3 (METTL3) is the catalytic subunit which selectively methylates the GAC and AAC sequences in synthetic single-stranded RNA in vitro [38].
Recently, although major advances in understanding the physiological and pathological processes of renal fibrosis have occurred, efforts to curb the progression of CKD have also been made [39]. Many compounds exert either a direct or indirect antifibrotic effect [39]. For example, pirfenidone (PFD) has been demonstrated to play an important role in delaying the progression of fibrosis [39–41]. Dihydroartemisinin (DHA), an effective antimalarial drug derived from the natural small-molecule compound artemisinin, has attracted substantial attention in recent years for its pharmacological activities, such as its antibacterial and antifibrotic properties [42]. However, few reports about the role of lncRNAs and the antifibrotic effects of these drugs have been published.
In this study, we investigated the mechanism of MALAT1 in ON-induced renal fibrosis. Even if this is not the first study for MALAT1 in renal fibrosis, our study indeed further revealed the role of MALAT1 in ON-induced renal fibrosis and the mechanism by which METTL3 positively regulates MALAT1. Furthermore, we explored whether DHA, an effective antimalarial drug, attenuates renal fibrosis through MALAT1 [42].
Results
MALAT1 expression was upregulated in renal fibrotic tissues in patients with ON
MALAT1 has been shown to play significant roles in many human diseases. To dissect whether MALAT1 is involved in the progression of renal fibrosis in patients with ON, we measured MALAT1 expression in renal fibrotic tissues in patients with ON. Haematoxylin and eosin (HE) staining analyses showed kidney tissue with severe hydronephrosis from obstructive stones and normal tissue (Figure 1A).
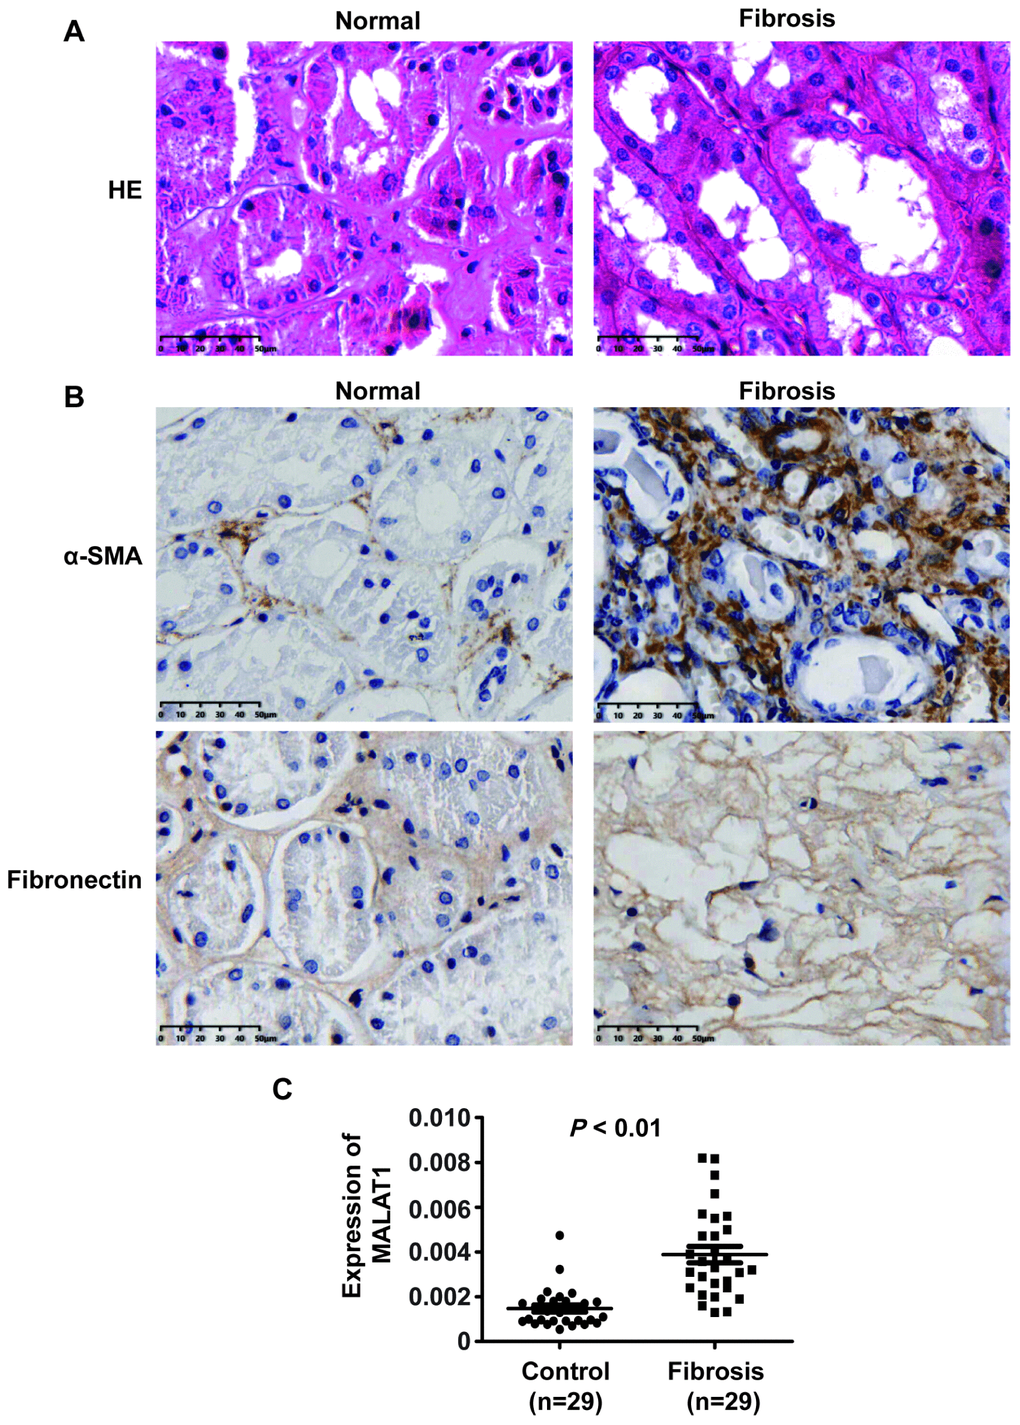
Figure 1. MALAT1 expression was upregulated in renal fibrotic tissues in patients with ON. (A) HE analyses of kidney tissue with severe hydronephrosis from obstructive stones and normal tissue. (B) IHC analyses of α-SMA and ECM deposition in samples from patients with renal fibrosis. (C) qPCR analysis of MALAT1 expression in samples from patients with renal fibrosis].
Furthermore, immunohistochemistry (IHC) staining analyses revealed that α-SMA and ECM deposition were increased in samples from patients with fibrosis compared with those in normal tissue samples (Figure 1B). qPCR analyses illustrated that MALAT1 expression was increased in renal fibrosis tissues compared to that in normal tissues (Figure 1C). Collectively, these observations indicated that MALAT1 was involved in fibrosis.
TGF-β1 induced fibrosis via upregulating MALAT1 expression in HK2 cells
Of mention above, we displayed an increased expression of MALAT1 in clinicopathological specimen of renal fibrosis. We wonder whether MALAT1 exerted an important role in fibrosis and further, what is the underlying molecular mechanism of the role.
To determine the role of TGF-β1 in fibrosis, we treated HK2 cells with different concentrations of TGF-β1 for 48 h and then performed qPCR, western blot, CCK-8, EdU and cell migration assays. qPCR and western analyses showed that TGF-β1 downregulated the expression of E-cadherin and ZO1 and upregulated the expression of N-cadherin and α-SMA in HK2 cells (Figure 2A and 2B). These results demonstrated that TGF-β1 induced EMT in HK2 cells. Then, CCK-8 assays showed that TGF-β1 enhanced the viability of HK2 cells (Figure 2C). Furthermore, EdU assays demonstrated that TGF-β1 promoted the proliferation of HK2 cells (Figure 2D). Cell migration assays illustrated that TGF-β1 strengthened the cell migration potential of HK2 cells (Figure 2E). In summary, these data revealed that TGF-β1 promoted EMT and enhanced the viability, proliferation and migration potential of HK2 cells.
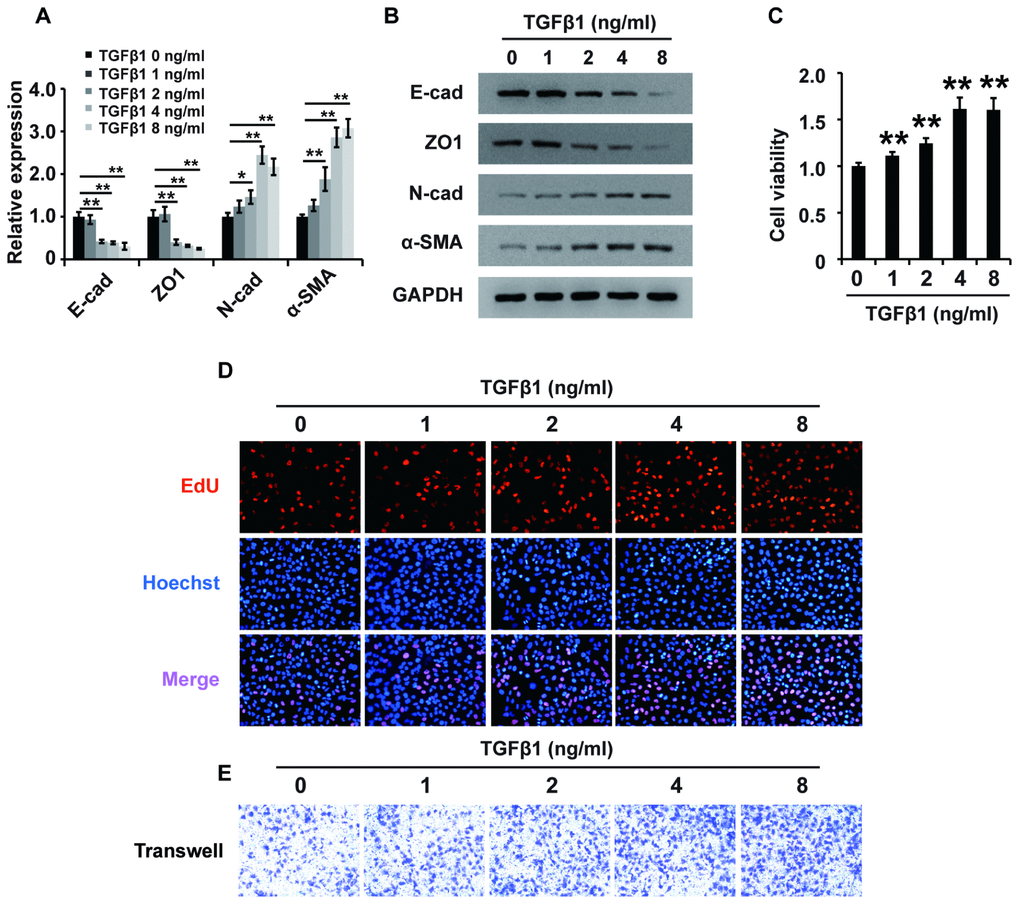
Figure 2. TGF-β1 induces fibrosis in HK2 cells. (A) qPCR analyses of E-cadherin (E-cad), ZO1, N-cadherin (N-cad) and α-SMA expression in HK2 cells treated with TGF-β1 at different concentrations for approximately 48 h. (B) Western blot analyses of E-cad, ZO1, N-cadherin and α-SMA expression in HK2 cells treated with TGF-β1 at different concentrations for approximately 48 h. GAPDH was used as a control. (C–E) CCK-8, EdU and cell migration analyses (transwell) of the viability, proliferation and migration of HK2 cells treated with TGF-β1 at different concentrations for approximately 48 h. *P < 0.05 and **P < 0.01.
Research has demonstrated that MALAT1 plays extensive roles in a variety of cellular processes [36]. We proposed that MALAT1 might play an important role in mediating the effects of TGF-β1 in HK2 cells. To elucidate the possible role of MALAT1, we first employed qPCR to detect its expression in HK2 cells treated with TGF-β1, revealing that TGF-β1 increased MALAT1 expression in HK2 cells (Figure 3A). Then, we used three siRNAs specific to MALAT1 to knockdown its expression, and qPCR analyses illustrated that all three siRNAs could effectively inhibit MALAT1 expression (Figure 3B). siMALAT1-2 was subsequently chosen for further functional research. Excitingly, western blot analysis showed that inhibiting MALAT1 reversed TGF-β1-induced EMT (Figure 3C). Furthermore, CCK-8, EdU and cell migration analyses demonstrated that knocking down MALAT1 inhibited the viability, proliferation and migration potential of HK2 cells treated with TGF-β1 (Figure 3D–3F). In addition, overexpression of MALAT1 can induce the EMT, enhance the cell viability, promote the cell proliferation and migration potential of HK2 cells (Supplementary Figure 1).
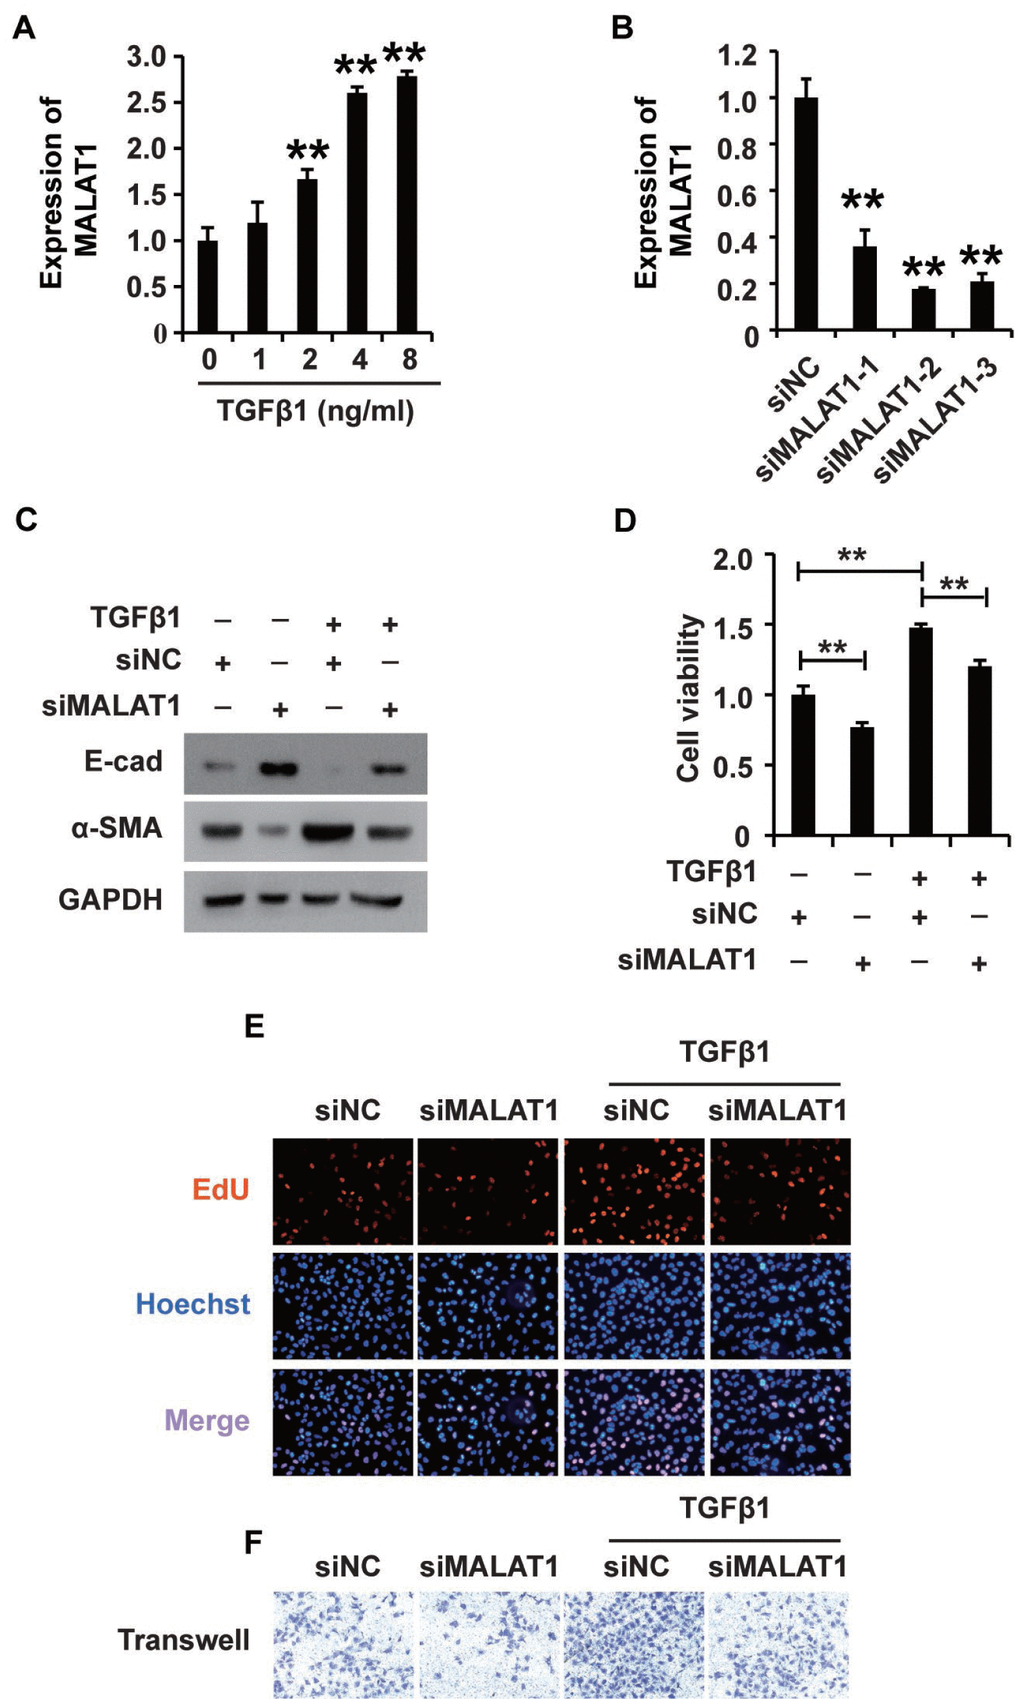
Figure 3. TGF-β1 induces fibrosis via upregulating MALAT1 expression in HK2 cells. (A) qRT-PCR analysis of MALAT1 expression in HK2 cells treated with TGF-β1. (B) qRT-PCR analysis of MALAT1 expression in HK2 cells transfected with siMALAT1 or siNC for approximately 48 h. (C) Western blot analyses of E-cad, α-SMA and GAPDH expression in HK2 cells receiving different treatments. (D–F) CCK8, EdU and cell migration analyses of the viability, proliferation and migration of HK2 cells receiving different treatments. After pretransfection with siMALAT1 or siNC for 24 h, HK2 cells were treated with 4 ng/mL TGF-β1 for another 48 h. GAPDH was used as a control. *P < 0.05 and **P < 0.01.
Together, these results suggest that TGF-β1 plays a role in fibrosis by activating MALAT1 expression in HK2 cells.
MALAT1 functions by acting as a miR-145 sponge in HK2 cells treated with TGF-β1
Recently, studies have demonstrated the broad applicability of the ceRNA hypothesis to the lncRNA mechanism of action [44]. To examine the mechanism of MALAT1, we systematically analysed its potential miRNA binding sites using online software, which revealed potential miR-145 binding sites. To confirm the binding abilities of the sites identified, we used dual-luciferase reporter. The luciferase activity was decreased in cells cotransfected with wild-type MALAT1 and miR-145 mimics but was restored in cells cotransfected with mutant MALAT1 and miR-145 mimics (Figure 4A), demonstrating that MALAT1 could bind miR-145. Furthermore, the results of RIP showed that MALAT1 and miR-145 were more abundant in the Ago2 pellet than in the control IgG pellet (Supplementary Figure 2).
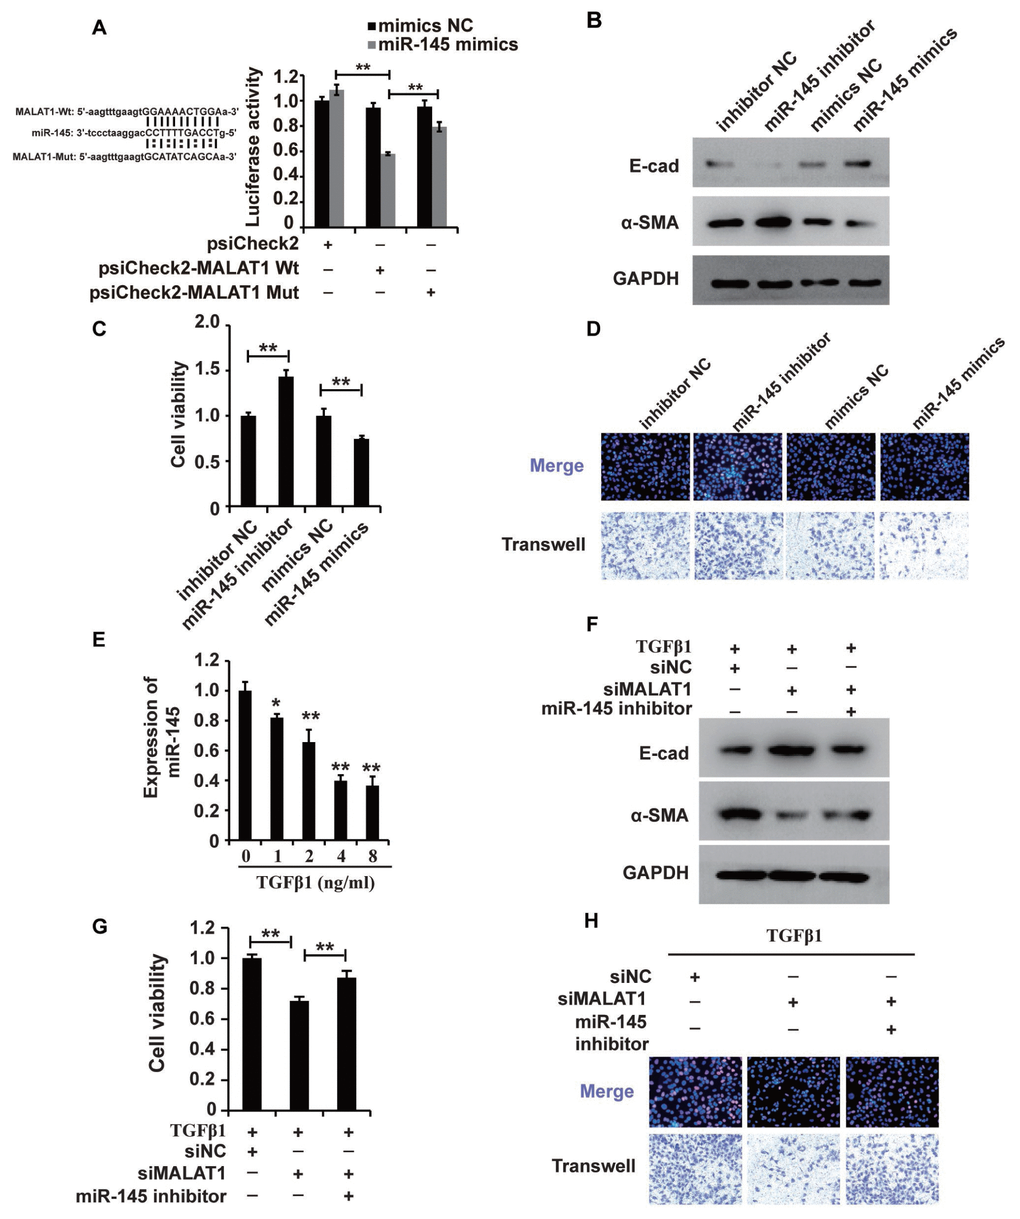
Figure 4. MALAT1 acts as a miR-145 sponge in HK2 cells treated with TGF-β1. (A) Luciferase reporter analysis of the binding between miR-145 and predicted MALAT1 binding sites. (B) Western blot analyses of E-cad, α-SMA and GAPDH expression in HK2 cells transfected with miR-145 mimics, miR-145 inhibitors and their control RNAs. (C and D) CCK8, EdU and cell migration analyses of the viability, proliferation and migration of HK2 cells transfected with miR-145 mimics, miR-145 inhibitors and their control RNAs. (E) qPCR analysis of miR-145 expression in HK2 cells treated with different concentrations of TGF-β1 for 48 h. (F) Western blot analyses of E-cadherin, α-SMA and GAPDH expression in HK2 cells receiving different treatments. (G and H) CCK8, EdU and cell migration analyses of the viability, proliferation and migration of HK2 cells receiving different treatments. GAPDH and U6 were used as controls. *P < 0.05 and **P < 0.01.
Then, we used western blotting to examine the role of miR-145 in HK2 cells. In HK2 cells, miR-145 mimics inhibited EMT, and a miR-145 inhibitor promoted EMT (Figure 4B). Furthermore, CCK-8, EdU and cell migration analyses illustrated that the miR-145 mimics inhibited the cell viability, proliferation and migration, while the miR-145 inhibitor promoted the migration of HK2 cells (Figure 4C and 4D).
Given that MALAT1 could bind miR-145 and that miR-145 plays important roles in HK2 cells, we proposed that miR-145 was associated with the functions of MALAT1 in HK2 cells treated with TGF-β1. qPCR and western blot analyses showed that repressing miR-145 restored the siMALAT1-induced inhibition of EMT in HK2 cells treated with TGF-β1 (Figure 4E and 4F). Furthermore, CCK-8, EdU and cell migration analyses illustrated that the miR-145 inhibitor restored the siMALAT1-induced inhibition of cell viability, proliferation and migration, while the miR-145 inhibitor promoted those processes in HK2 cells (Figure 4G and 4H). In summary, these observations revealed that MALAT1 functions by acting as a miR-145 sponge in HK2 cells treated with TGF-β1.
miR-145 plays a role in regulating FAK expression in HK2 cells treated with TGF-β1
Given the mode of miRNA action, we systematically sought the potential targets of miR-145 using online software and identified FAK as a potential target. Thus, we wondered whether miR-145 exerted its function via inhibiting FAK expression in HK2 cells treated with TGF-β1. qRT-PCR and western blot analyses showed that miR-145 mimics downregulated FAK expression, while the miR-145 inhibitor upregulated FAK expression (Figure 5A and 5B). To further confirm that FAK was a functional target of miR-145, we employed the dual-luciferase reporter assay to investigate the binding between FAK and miR-145. The luciferase activity was decreased in cells co-transfected with wild-type FAK and miR-145 mimics, but restored in cells co-transfected with mutant FAK and miR-145 mimics (Figure 5C). Taken together, these observations suggest that activating miR-145 downregulates FAK in HK2 cells.
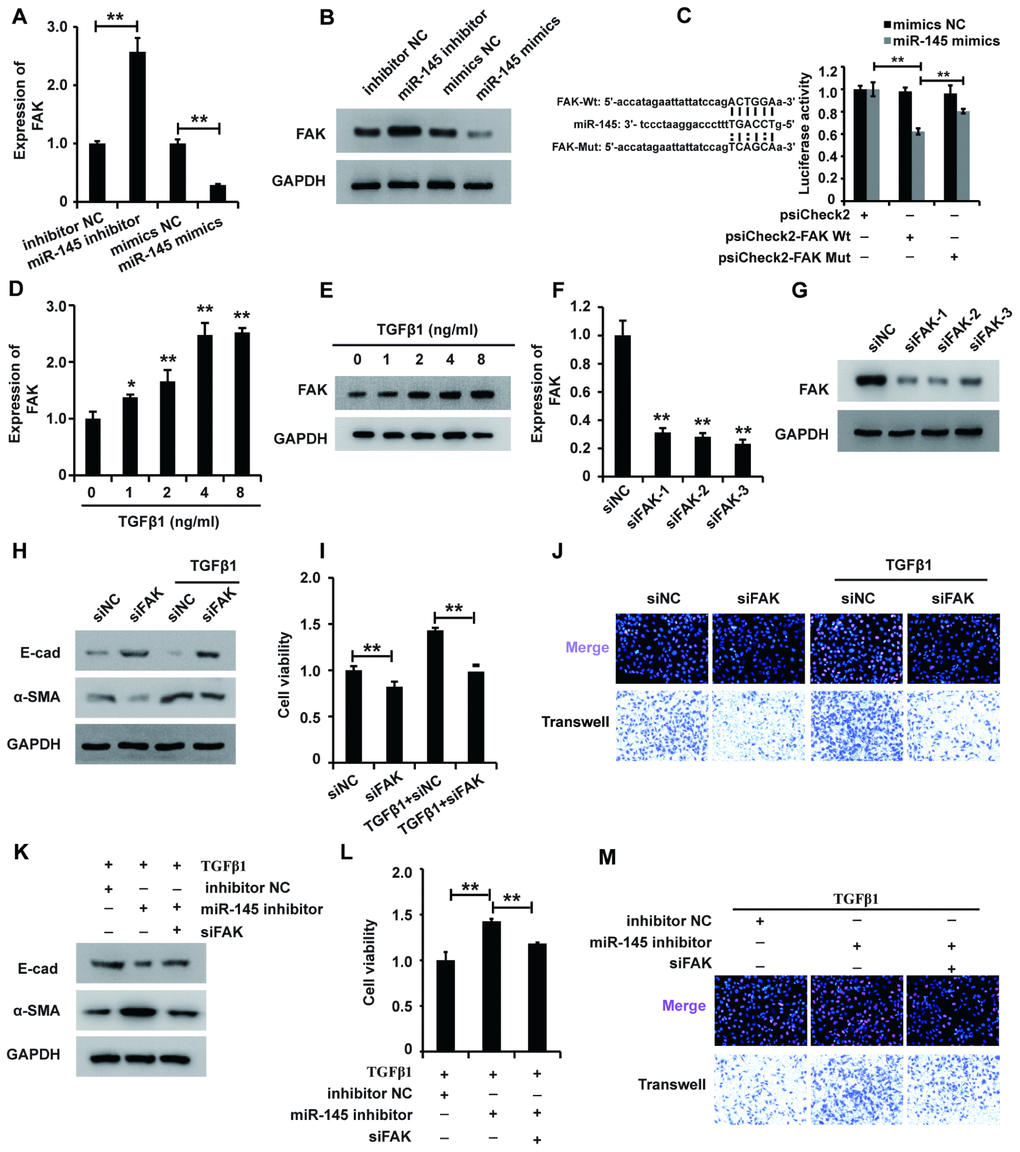
Figure 5. miR-145 plays a role in regulating FAK expression in HK2 cells treated with TGF-β1. (A and B) qRT-PCR and western blot analyses of FAK expression in HK2 cells transfected with miR-145 mimics, miR-145 inhibitors and their control RNAs. (C) Luciferase reporter analysis of the binding between miR-145 and predicted binding sites in FAK. (D and E) qRT-PCR and western blot analyses of FAK expression in HK2 cells treated with TGF-β1 (F and G). qRT-PCR and western blot analyses of FAK expression in HK2 cells transfected with siFAK or siNC for approximately 48 h. (H) Western blot analyses of E-cad, α-SMA and GAPDH expression in HK2 cells receiving different treatments. (I and J) CCK8, EdU and cell migration analyses of the viability, proliferation and migration of HK2 cells receiving different treatments. (K) Western blot analyses of E-cad, α-SMA and GAPDH expression in HK2 cells receiving different treatments. (L and M) CCK8, EdU and cell migration analyses of the viability, proliferation and migration of HK2 cells receiving different treatments. GAPDH was used as a control. *P < 0.05 and **P < 0.01.
Then, we sought to dissect the role of FAK in HK2 cells. qPCR and western blot analyses demonstrated that TGF-β1 promoted FAK expression in HK2 cells (Figure 5D and 5E), suggesting that FAK was associated with the function of TGF-β1 in HK2 cells. To elucidate the possible role of FAK in HK2 cells, we first designed siRNAs specific to FAK and transfected them into HK2 cells. qPCR and western blot analyses showed that all three FAK siRNAs could effectively inhibit FAK expression, and siFAK-1 was chosen for further research (Figure 5F and 5G). Western blot analysis showed that inhibition of FAK reversed the TGF-β1-induced EMT (Figure 5H). Furthermore, CCK-8, EdU and cell migration analyses demonstrated that FAK knockdown inhibited the viability, proliferation and migration potential of HK2 cells treated with TGF-β1 (Figure 5I and 5J). In summary, these results suggested that FAK could be associated with the function of TGF-β1 in HK2 cells.
Given that activating miR-145 downregulated FAK expression and that FAK affected the function of TGF-β1 in HK2 cells, we proposed that miR-145 exerted its function via inhibiting FAK expression in HK2 cells treated with TGF-β1. Western blot analysis showed that repression of FAK restored miR-145-induced EMT in HK2 cells treated with TGF-β1 (Figure 5K). Furthermore, the CCK-8, EdU and cell migration analyses illustrated that repressing FAK restored the miR-145-induced promotion of the viability, proliferation and migration of HK2 cells treated with TGF-β1 (Figure 5L and 5M). In summary, these results show that miR-145 plays a role in regulating FAK expression in HK2 cells treated with TGF-β1.
MALAT1 regulates the MALAT1/miR-145/FAK axis in HK2 cells treated with TGF-β1
Notably, we found that activating MALAT1 downregulated miR-145 expression and that activating miR-145 downregulated FAK expression in HK2 cells treated with TGF-β1. Thus, we proposed that MALAT1 might function via the MALAT1/miR-145/FAK axis. To test this hypothesis, we first measured whether activating MALAT1 could increase FAK expression via sponging miR-145. qRT-PCR and western blot analyses demonstrated that inhibiting MALAT1 downregulated FAK expression, and this effect was restored by a miR-145 inhibitor (Figure 6A and 6B). These results demonstrated that activating MALAT1 could increase FAK expression by sponging miR-145 in HK2 cells treated with TGF-β1.
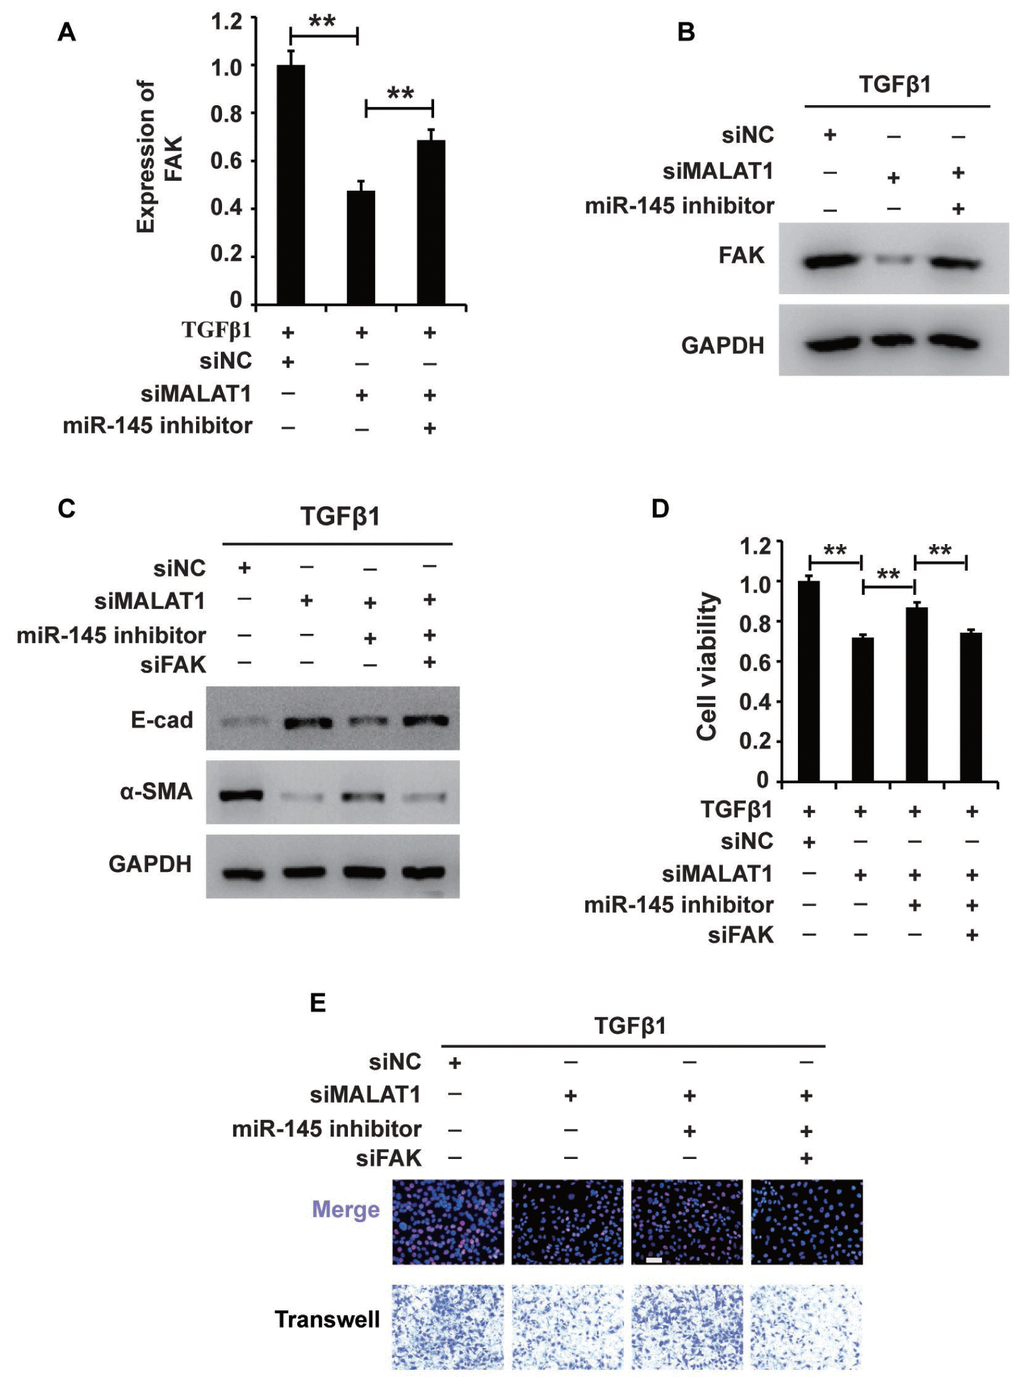
Figure 6. MALAT1 regulates the MALAT1/miR-145/FAK axis in HK2 cells treated with TGF-β1. (A and B) qRT-PCR and western blot analyses of FAK expression in HK2 cells treated with TGF-β1 alone or together with siMALAT1, a miR-145 inhibitor or a NC. (C) Western blot analyses of E-cadherin, vimentin, α-SMA and collagen I expression in HK2 cells receiving different treatments. (D and E) CCK8, EdU and cell migration analyses of the viability, proliferation and migration of HK2 cells receiving different treatments. GAPDH was used as a control. *P < 0.05 and **P < 0.01.
Then, we aimed to examine the role of the MALAT1/miR-145/FAK axis in HK2 cells treated with TGF-β1. Western blot analysis revealed that increasing MALAT1 and FAK and decreasing miR-145 activated EMT in HK2 cells treated with TGF-β1 (Figure 6C). In addition, CCK-8, EdU and cell migration analyses illustrated that upregulation of the MALAT1 and FAK and downregulation of miR-145 activated the viability, proliferation and migration potential of HK2 cells treated with TGF-β1 (Figure 6D and 6E). In summary, these results showed that MALAT1 sponges miR-145 and thereby increases FAK expression in HK2 cells treated with TGF-β1.
The MALAT1/miR-145/FAK axis is involved in the antifibrotic effect of DHA on TGF-β1-induced renal fibrosis
To examine the role and underlying mechanism of DHA in TGF-β1-induced fibrosis, we added DHA to HK2 cells treated with TGF-β1. Western blot analysis revealed that DHA reversed the TGF-β1-induced EMT in HK2 cells (Figure 7A). Then, CCK-8, EdU and migration analyses demonstrated that DHA inhibited the TGF-β1-induced promotion of the viability, proliferation and migration potential of HK2 cells (Figure 7B and 7C). Taken together, these observations demonstrated that DHA alleviated TGF-β1-induced fibrosis.
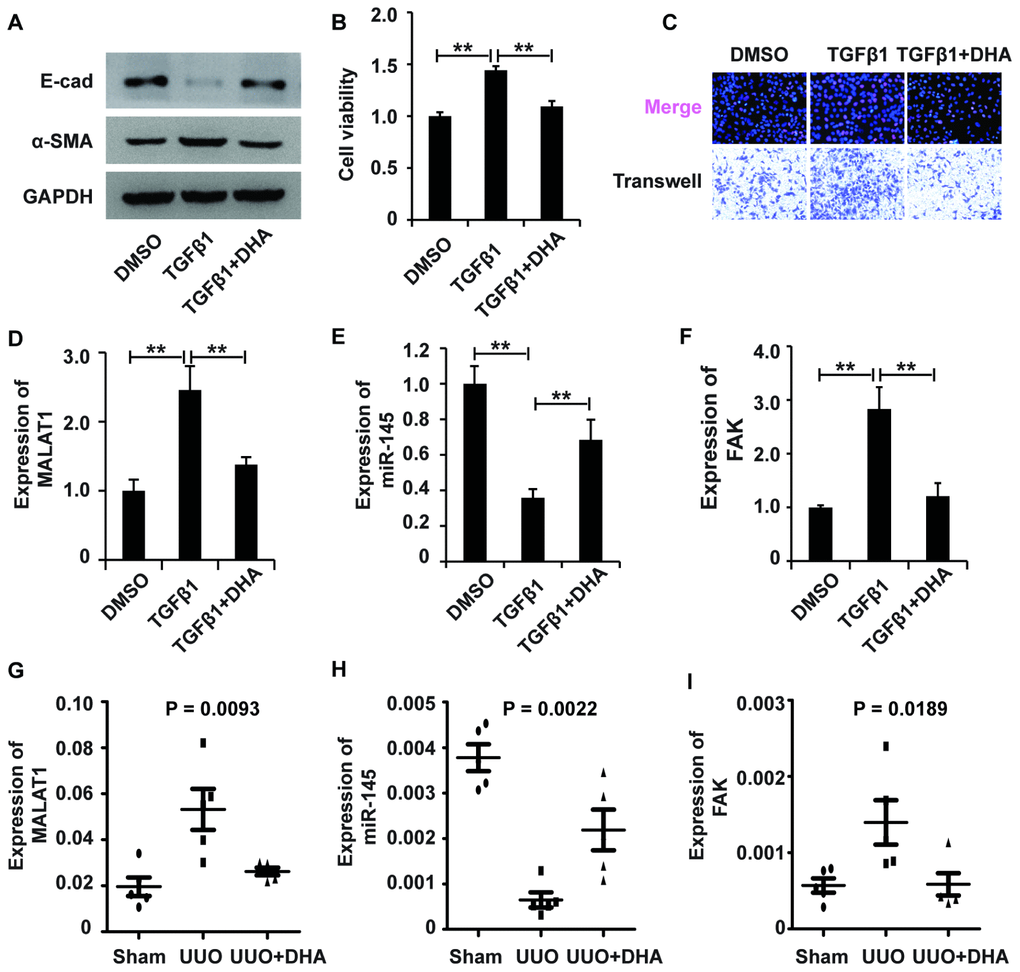
Figure 7. The MALAT1/miR-145/FAK axis is involved in the mechanism of fibrosis treatment drugs. (A) Western blot analyses of E-cad, α-SMA and GAPDH expression in HK2 cells receiving different treatments. (B and C) CCK8, EdU and cell migration analyses of the viability, proliferation and migration of HK2 cells receiving different treatments. (D–F) qRT-PCR analyses of the expression profile of the MALAT1/miR-145/FAK axis in HK2 cells receiving different treatments. GAPDH was used as a control. *P < 0.05 and **P < 0.01. (G–I) qPCR analysis of MALAT1, miR-145 and FAK expressions in sham group, UUO models and UUO models receiving DHA treatment.
We next wondered whether the MALAT1/miR-145/FAK axis was involved in the antifibrotic effect of DHA. qPCR analysis demonstrated that DHA inhibited the TGF-β1-induced upregulation of MALAT1 and FAK and restored the TGF-β1-induced suppression of miR-145 expression (Figure 7D–7F). In summary, these results demonstrated that the MALAT1/miR-145/FAK axis was involved in the antifibrotic effect of DHA in vitro.
The MALAT1/miR-145/FAK axis is involved in renal fibrosis in UUO mouse models
To further confirm the involvement of the MALAT1/miR-145/FAK pathway in the antifibrotic effect of DHA, we first generated UUO mouse models. HE staining analysis revealed that DHA exerted antifibrotic effects in the UUO (Supplementary Figure 3). Furthermore, IHC staining analysis showed that DHA inhibited α-SMA and ECM deposition in the UUO (Supplementary Figure 4C and 4F). Taken together, these observations revealed the antifibrotic effect of DHA in vivo.
Next, we used qPCR analyses to assess the MALAT1/miR-145/FAK pathway in UUO mouse models treated with DHA. qPCR analyses demonstrated that DHA inhibited the increase in MALAT1 and FAK expression and restored the inhibition of miR-145 expression in both the UUO (Figure 7G–7I). IHC staining analysis further confirmed that DHA inhibited the increase in FAK expression in UUO mouse models (Supplementary Figure 4I). In summary, these results demonstrated that the MALAT1/miR-145/FAK axis was involved in the antifibrotic effect of DHA in vivo.
m6A modification participates in the upregulation of MALAT1 in renal fibrosis
The m6A modification was reported to play important roles in a variety of cellular processes by affecting RNA stability and protein translation efficiency [34]. First, the ELISA was used to detect the m6A level in HK2 cells treated with TGF-β1, revealing that TGF-β1 elevated the m6A level in HK2 cells (Figure 8A), suggesting that m6A modification occurred in HK2 cells treated with TGF-β1. qPCR and western blot analyses showed that the m6A methyltransferases METTL3, METTL14 and WTAP were upregulated in HK2 cells treated with TGF-β1 (Figure 8B and 8C).
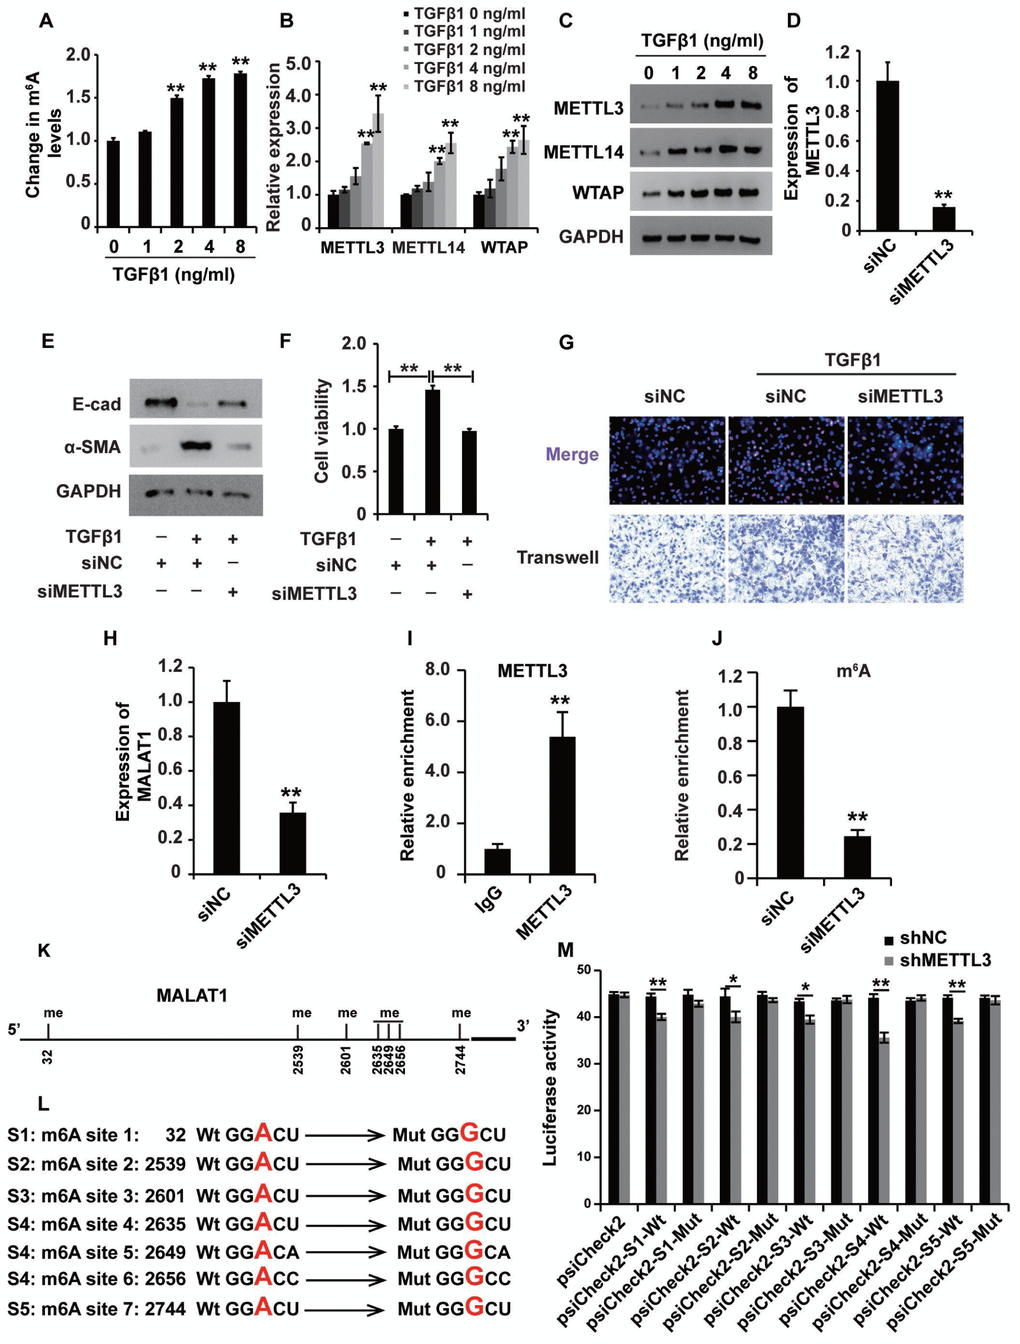
Figure 8. mA modification participates in the upregulation of MALAT1 in renal fibrosis. (A) ELISA was used to measure the m6A levels in HK2 cells treated with TGF-β1 at different concentrations for approximately 48 h. (B and C) qPCR and western blot analyses of METTL3, METTL14 and WTAP in HK2 cells treated with TGF-β1 at different concentrations for approximately 48 h. (D) qPCR analyses of METTL3 expression in HK2 cells transfected with siMETTL3 or siNC for approximately 48 h. (E) qPCR analyses of E-cad and α-SMA expressions in HK2 cells treated with siNC, siNC+TGF-β1 and siMETTL3+TGF-β1 for approximately 48 h. (F and G) CCK8, EdU and cell migration analyses of the viability, proliferation and migration potential of HK2 cells treated with siNC, siNC+TGF-β1 and siMETTL3+TGF-β1 for approximately 48 h. (H) qPCR analyses of MALAT1 expression in HK2 cells transfected with siMETTL3 or siNC for approximately 48 h. (I) METTL3 RIP-qPCR analysis of MALAT1 in HK2 cells. (J) m6A RIP-qPCR analysis of MALAT1 in HK2 cells transfected with siMETTL3 or siNC for approximately 48 h. (K) the predicted m6A sites (with high confidence) in MALAT1. (L) the mutated m6A sites of MALAT1. (M) the inhibitory role of shMETTL3 was attenuated in the luciferase activity inserted the MALAT1 with mutant type (Mut) m6A sites. GAPDH was used as a control. *P < 0.05 and **P < 0.01.
To dissect the role of m6A modification in HK2 cells treated with TGF-β1, we first knocked down the expression of METTL3 (Figure 8D), which is the key m6A methyltransferase. Western blot analysis revealed that suppressing METTL3 could attenuate the TGF-β1-induced EMT in HK2 cells (Figure 8E). Then, CCK8, EdU and cell migration assays were performed to confirm that suppressing METTL3 inhibited the viability, proliferation and migration potential of HK2 cells (Figure 8F and 8G). Collectively, these observations revealed that m6A modification played a crucial role in TGF-β1-treated HK2 cells.
Next, we wondered whether m6A modification was involved in the upregulation of MALAT1 in HK2 cells treated with TGF-β1. qPCR analysis demonstrated that suppressing METTL3 inhibited the expression of MALAT1 in HK2 cells (Figure 8H). METTL3 immunoprecipitation (RIP)-qPCR analysis revealed a 5.3-fold enrichment in the METTL3 antibody levels of MALAT1 in HK2 cells (Figure 8I). In addition, m6A RIP-qPCR analysis illustrated that suppressing METTL3 inhibited the enrichment of MALAT1 m6A antibody levels in HK2 cells by 4-fold (Figure 8J). To discover the m6A sites of MALAT1, we firstly predicted the m6A sites in MALAT1 using http://www.cuilab.cn and introduced the luciferase analysis to detect the m6A sites in MALAT1. There were 7 m6A sites (with high confidence) in MALAT1 (Figure 8K). Then, we mutated the m6A sites in MALAT1(Figure 8L) and the results of luciferase analysis demonstrated that shMETTL3 inhibited the activity of luciferase reporter which inserted the MALAT1 with wild type (Wt) m6A sites and meanwhile, the inhibitory role of shMETTL3 was attenuated in the luciferase inserted the MALAT1 with mutant type (Mut) m6A sites (Figure 8M). In summary, these results revealed that m6A modification participated in the upregulation of MALAT1 in renal fibrosis.
Discussion
ON is not uncommon in the clinic and is often seen in urology departments. Long-term mechanical urinary obstruction caused by, for example, congenital anatomic abnormalities in children, urinary stones in young adults or malignancies in older adults, leads to CKD. The early detection of urinary obstruction can save renal function and improve patient outcomes. Serum creatinine (Scr) and glomerular filtration rate (GFR) are widely used for evaluating renal function, and imaging examinations provide visual evidence of obstruction. However, these methods are not sufficiently sensitive for the early detection of ON, especially in asymptomatic patients whose severe hydronephrosis and renal dysfunction are detected by accident. Apart from this, the pain caused by urologic obstruction is not proportional to the severity of the disease, which is often neglected. Therefore, more sensitive biomarkers are necessary for the earlier warning and detection of ON.
Renal fibrosis is initiated and sustained by a variety of prosclerotic properties, and TGF-β1 is known as the most potent inducer of fibrosis [45, 46]. Although its biological roles in different cell types and biological scenarios are controversial, TGF-β1 plays important roles in the induction of fibrosis [47, 48]. TGF-β1 induces fibrosis by inducing EMT and promoting the expression of ECM proteins [13]. In our study, TGF-β1 induced EMT and increased ECM protein deposition in HK2 cells. Furthermore, the growth, mobility and dysfunction of tubular cells is the leading cause of CKD [49]. Thus, assessing tubular cell functional properties, such as their viability, proliferation and migration abilities, is important to better understand CKD progression and will ultimately lead to improvements in the monitoring techniques and therapeutic interventions for CKD. In the present study, TGF-β1 promoted the viability, proliferation and migration of HK2 cells by activating the MALAT1/miR-145/FAK pathway.
Recent research has shown that lncRNAs are involved in a variety of cellular processes and can be sensitive biomarkers for diseases. Advances in transcriptome analysis by RNA-seq technology have enabled the elucidation of lncRNA functions in renal fibrosis [50]. Several lncRNAs, such as MEG3, H19 and HOTAIR, were reported to play important roles in mediating TGF-β and renal fibrosis [45–53]. MALAT1 was reported to affect the cellular processes induced by TGF-β, such as EMT, ECM protein deposition, cell growth and cell mobility [43]. In our study, we demonstrated for the first time that TGF-β1 promoted MALAT1 expression and that knocking down MALAT1 expression inhibited TGF-β1-induced EMT, ECM deposition and the viability, proliferation and migration of HK2 cells.
In recent years, an increasing number of reports have revealed that a variety of lncRNAs act via the regulatory mechanism described by the ceRNA hypothesis [44]. The corresponding lncRNAs, miRNAs and mRNAs participate in the regulatory pathway, and any perturbation of this pathway alters the cellular processes and physiological and pathological progression of human diseases [54]. A variety of lncRNAs, including SBF2-AS1, SNHG7, TBILA, UCA1, ATB, and MALAT1, play important roles in TGFβ-treated cells via ceRNA mechanisms (43). Xiang Y and colleagues demonstrated that MALAT1 modulates the TGF-β1-induced EMT of endothelial progenitor cells (EPCs) by regulating TGFBR2 and SMAD3 via miR-145 [55]. In our study, we found that MALAT1 activated FAK expression by sponging miR-145. In addition, we revealed that activating the MALAT1/miR-145/FAK ceRNA network could increase TGF-β1-induced renal fibrosis in vitro and significantly altered MALAT1, miR-145 and FAK expression in vivo.
Furthermore, we investigated whether m6A methylation was involved in the upregulation of MALAT1 in TGF-β1-treated HK2 cells. First, the m6A level was elevated, and we confirmed that METTL3 was upregulated in TGF-β1-treated HK2 cells. METTL3 was shown to function and positively regulate MALAT1 in TGF-β1-treated HK2 cells. Thus, we revealed that m6A modifications can modulate MALAT1 in TGF-β1-treated HK2 cells and possibly affect the MALAT1/miR-145/FAK pathway in renal fibrosis.
Currently, surgical treatment is the top option for relieving urological obstruction. Nevertheless, the timing of surgical treatment and the effect of early surgical treatment remain controversial in the following three groups of patients: (1) patients who are not in good physical condition and cannot tolerate surgery; (2) patients whose obstruction cannot be thoroughly removed and are prone to relapse; and (3) patients with congenital ON. Therefore, antifibrotic drugs are necessary for these patients. Fortunately, DHA has been shown to effectively attenuate renal fibrosis caused by ON through the MALAT1/miR-145/FAK axis in vivo and in vitro. Unfortunately, DHA has not been used clinically to treat patients with renal fibrosis caused by ON.
In conclusion, the present study reveals that the expression profile of MALAT1/miR-145/FAK may be a potential biomarker for the diagnosis and treatment of ON-induced renal fibrosis in CKD. In addition, the m6A modification is involved in the regulation of MALAT1. Moreover, DHA can attenuate ON-induced renal fibrosis through the MALAT1/miR-145/FAK axis.
Materials and Methods
Cell culture and reagents
Human renal proximal tubular epithelial cells (HK2 cells, human kidney-2: ATCC CRL-2190) were purchased from American Type Culture Collection (ATCC, Manassas, VA, USA) and cultured in Dulbecco’s Modified Eagle’s Medium with F12 (Invitrogen, Carlsbad, USA) supplemented with 10% heat-inactivated foetal bovine serum, 100 U/ml penicillin and 100 U/ml streptomycin at 37°C in a humidified atmosphere containing 5% CO2.
TGF-β1 was purchased from PeproTech (PeproTech, Rocky Hill, USA) and dissolved in dimethyl sulfoxide (DMSO). DHA (>98% purity; MW 284.35) was purchased from Shanghai Macklin Biochemical Co., Ltd. (Shanghai, China) and dissolved in DMSO.
Human specimens and animal models
This study was approved and supervised by the Research Ethics Committee of Xiangya Hospital, Central South University (no. 201703525 and 201703526).
Clinical specimens were collected from patients undergoing surgical resection at Xiangya Hospital, Central South University; the samples were then quickly frozen in liquid nitrogen and stored at -80°C for no more than 1 year. Informed consent agreements were signed by all patients.
For the unilateral ureteral obstruction (UUO) model, male C57BL/6J mice at 8 weeks of age (20–22 g body weight) were first anaesthetized with pentobarbital sodium (50 mg/kg) via intraperitoneal injection. Then, the left ureter was ligated using 3-0 silk and a left lateral incision. Sham-operated C57BL/6J mice were used as the experimental controls.
RNA interference (RNAi)
Stealth RNAi oligonucleotides (siRNAs) specifically targeting MALAT1 and FAK were designed and synthesized by GenePharma (Shanghai, China). The siRNA sequences were as follows: siMALAT1-1: 5′-GGACAACAGUACACGCAUATT-3′; siMALAT1-2: 5′-GCCACCUACAUUAAAGCUATT-3′; siMALAT1 -3: 5′-GACCAGACCCTACCGGTCATTTATUATT-3′; siFAK-1: 5′-GCUAUGGUGAACACCCUAATT-3′; siFAK-2: 5′-GAACUGGGAUUCACAUCGA-3′; siFAK-3: 5′-GGAUAACGAUGGCUACUCA-3′; and negative control siRNA: 5′-GACCTACAACTACCTATCA-3′.
Transient transfection
HK2 cells were plated in 12-well plates at a density of 1.0×10⁵ cells per well. The next day, upon reaching approximately 80~90% confluence, the cells were transfected with Lipofectamine 2000 (Invitrogen) according to the manufacturer’s instructions. After 48 h, the HK2 cells were used for further research.
Total RNA isolation and qRT-PCR
Total RNA was isolated from cultured cells and tissues using TRIzol (Invitrogen, Carlsbad, CA, USA) according to the manufacturer’s instructions. A NanoDrop ND-1000 spectrophotometer (Thermo Scientific) was employed to determine the total RNA concentrations. Reverse transcription was performed with 1 μg of total RNA and a PrimerScript RT reagent kit with gDNA Eraser (TaKaRa, Dalian, China). qPCR was performed with a SYBR Green I array (Donghuan Biotech, Shanghai, China) and the Prism 7500 SDS system (Applied Biosystems, Thermo Fisher Scientific). Each sample was measured in triplicate. The data were analysed using the 2-∆∆Ct method. Relative mRNA and microRNA expression levels were normalized to those of GAPDH or U6 small nuclear RNA, and arbitrary units were used to show the normalized relative gene expression levels. The primers were designed and synthesized by Sangon Biotech (Shanghai, China). The qRT-PCR primers for MALAT1 were as follows: forward: 5′-TTACCTGGGGAACCCCGACC-3′ and reverse: 5′-TGGTGAAGGATGAGGGCTCGT-3′. The qRT-PCR primers for FAK were as follows: forward: 5′-TTACCTGGGGAACCCCGACC-3′ and reverse: 5′-TGG TGAAGGATGAGGGCTCGT-3′. The primers for E-cadherin were as follows: forward: 5′-GCTTCAGCAAAGACAACGAG-3′ and reverse: 5′-GTGTAATGCAGGACCACAGC-3′. The primers for ZO1 were as follows: forward: 5′-CGGGTCTACGCCTACGTCTTTGAACACCGTGCTTC-3′ and reverse: 5′-CACAGGTCTGAGCAGCGATCCTGCTTGCTG-3′. The primers for vimentin were as follows: forward: 5′-CGGGTCTACGCCTACGTCTTTGAACACCGTGCTTC-3′ and reverse: 5′-ATGGGTGAAGCCTGGGCAGGTG-3′. The primers for α-SMA were as follows: forward: 5′-CCTGTCCACACGGGTGAACT-3′ and reverse: 5′-CACCAGGCCTAGCATTCATTG-3′. The primers for β-actin were as follows: forward: 5′-ACTACCTGAGCACCCAGTCC-3′ and reverse: 5′-CACAGGTCTGAGCAGCGATCCTGCTTGCTG-3′. β-Actin was used as a control.
Western blot analysis
HK2 cells receiving different treatments were harvested and lysed with RIPA lysis buffer (Beyotime). Protein concentrations were measured using a BCA Protein Assay Kit (Donghuan Biotech, Shanghai, China). Equal amounts of protein lysates were separated by electrophoresis on a 10% SDS-polyacrylamide gel and transferred onto polyvinylidene difluoride (PVDF) membranes (Millipore). After blocking in 5% fat-free milk dissolved in PBST, the blots were incubated with different primary antibodies at 4°C overnight. The next day, the primary antibodies were removed, and the blots were incubated with an anti-IgG horseradish peroxidase-conjugated secondary antibody. GAPDH was measured as a control. The antibodies used in our study were E-cadherin (Abcam, UK; dilution of 1:2000), vimentin (Abcam, UK; dilution of 1:2000), N-cadherin (Abcam, UK; dilution of 1:2000), FAK (Cell Signaling Technology, USA; dilution of 1:2000), GAPDH (Abcam, UK; dilution of 1:5000) and a secondary fluorescent goat anti-rabbit antibody (Abcam, UK; dilution of 1:4000). Immunoreactivity was visualized using an ECL western blot system (Donghuan Biotech, Shanghai, China), and the data were analysed using Gel-Pro Analyzer Software.
CCK-8 assay
The viability of HK2 cells receiving different treatments was measured using Cell Counting Kit-8 (Donghuan Biotech, Shanghai, China). HK2 cells were plated in 96-well plates at a density of 4000 cells/well in triplicate. After the cells received the different treatments, 10 μL of CCK-8 reagent was added to each well. After incubation at 37°C for 4 h, the absorbance at 490 nm was measured using a microplate reader. Then, the cell growth curves were generated, and arbitrary units were applied to show the normalized relative differences among the different groups.
Ethynyl-2ʹ-deoxyuridine (EdU) assay
The proliferation of HK2 cells receiving different treatments was detected using an EdU assay kit (Donghuan Biotech, Shanghai, China). Briefly, HK2 cells receiving different treatments were plated in 48-well plates at a density of 1.0×10⁵ cells per well. The next day, EdU was added to the cells and incubated for 2 h at 37°C. Then, the cells were fixed with 4% formaldehyde for 25 min at room temperature (RT), permeabilized with 0.5% Triton X-100 for 25 min at RT and incubated with the staining solution for 30 min at RT. Hoechst 33342 was used to indicate the cells by staining their DNA. Immunofluorescence was detected under a fluorescence microscope (ZKX53, Japan).
Cell migration assay
The migration potential of HK2 cells receiving different treatments was measured using Transwell chambers (Corning). Briefly, HK2 cells receiving different treatments were plated in 24-well plates at a density of 2.5×10⁵ cells per well with medium containing 1% FBS; medium containing 10% FBS was added to the lower wells. The next day, the cells on the upper side of the membrane were removed. Then, the cells on the lower side were washed with PBS, fixed with 95% alcohol, stained with a 0.1% crystal violet solution, and air dried. The results of five random fields were imaged using a fluorescence microscope (Olympus, Japan).
m6A analysis and RNA immunoprecipitation (RIP)
Total RNAs were extracted with Trizol (Donghuan Biotech, Shanghai, China) according to the protocol. The levels of total m6A were detected in equal amount (300 ng) of total RNAs with the m6A RNA methylation detection kit (Epigentek, Farmingdale, NY).
RNA immunoprecipitation (RIP) analysis was performed with an RNA-Binding Protein Immunoprecipitation Kit (Millipore) according to the protocol. Briefly, 5 μg of anti-m6A antibody, 500 μg of cellular RNA, and 20 μl (in 50% slurry) protein-A/G sepharose were incubated in RIP buffer [150 nM NaCl, 0.1% NP-40, 10 mM Tris. HCl (pH. 7.4)] plus 1 U/μl RNasin in 200 μl at 4°C overnight. The beads were washed with the RIP buffer for 5 times. RNA isolated from the IP beads were subjected to reverse transcription (RT) followed by real-time, quantitative (q)PCR analysis.
Luciferase reporter assay
Full-length MALAT1 and FAK-3′UTR sequences were amplified by PCR and cloned into the psiCHECK-2 plasmid (Promega). The sequence of the putative binding site (miR-145) was replaced with MALAT1-Mutant (MALAT1-Mut) and FAK-3′UTR-Mutant (FAK-Mut). In brief, 293 cells were seeded into 6-well plates at a density of 4 × 10⁵ cells per well. The next day, UCA1 and ZEB1Wt or Mut plasmids and miR-455 mimics were transfected into the cells using Lipofectamine 2000 reagent (Invitrogen) according to the manufacturer’s instructions. After 48 h, the firefly and Renilla luciferase activities were measured using a Dual-Luciferase Assay System (Promega).
Statistical analysis
The data were analysed using the SPSS software package (version 13.0.0) and expressed as the mean ± standard deviation (S.D.). All experiments were repeated a minimum of three times. Student’s t-test was used to assess the differences between two groups, and one-way analysis of variance was employed to detect the differences between more than two groups. The symbol * represents a statistically significant difference (P < 0.05), while ** indicates a highly significant difference (P < 0.01).
Supplementary Materials
Author Contributions
PH.L, B.Z and Y.H were responsible for data curation. PH.L and B.Z designed the experiments. PH.L wrote the manuscript. B.Z, YC.D, YH.L and X.C reviewed and approved the manuscript. Z.C was responsible for project administration. X.C supervised the experiments.
Conflicts of Interest
The authors declare no conflicts of interest.
Funding
This work was funded by the National Natural Science Foundation of China (81770693) and the Fundamental Research Funds for the Central Universities of Central South University.
References
- 1. Mallappallil M, Friedman EA, Delano BG, McFarlane SI, Salifu MO. Chronic kidney disease in the elderly: evaluation and management. Clin Pract (Lond). 2014; 11:525–35. https://doi.org/10.2217/cpr.14.46 [PubMed]
- 2. Klahr S. Obstructive nephropathy. Intern Med. 2000; 39:355–61. https://doi.org/10.2169/internalmedicine.39.355 [PubMed]
- 3. Liu PH, Xu YF, Zu XB, Wang BZ, Hu XH. A hidden ureteral metastasis that originated from prostate cancer: a case report and literature review. Transl Cancer Res. 2017; 6:650–55. https://doi.org/10.21037/tcr.2017.05.18
- 4. Fogo AB. Mechanisms of progression of chronic kidney disease. Pediatr Nephrol. 2007; 22:2011–22. https://doi.org/10.1007/s00467-007-0524-0 [PubMed]
- 5. Zeisberg M, Kalluri R. The role of epithelial-to-mesenchymal transition in renal fibrosis. J Mol Med (Berl). 2004; 82:175–81. https://doi.org/10.1007/s00109-003-0517-9 [PubMed]
- 6. Strutz F, Müller GA. Renal fibrosis and the origin of the renal fibroblast. Nephrol Dial Transplant. 2006; 21:3368–70. https://doi.org/10.1093/ndt/gfl199 [PubMed]
- 7. Zhao Y, Yin Z, Li H, Fan J, Yang S, Chen C, Wang DW. MiR-30c protects diabetic nephropathy by suppressing epithelial-to-mesenchymal transition in db/db mice. Aging Cell. 2017; 16:387–400. https://doi.org/10.1111/acel.12563 [PubMed]
- 8. Yang J, Liu Y. Dissection of key events in tubular epithelial to myofibroblast transition and its implications in renal interstitial fibrosis. Am J Pathol. 2001; 159:1465–75. https://doi.org/10.1016/S0002-9440(10)62533-3 [PubMed]
- 9. García-Sánchez O, López-Hernández FJ, López-Novoa JM. An integrative view on the role of TGF-beta in the progressive tubular deletion associated with chronic kidney disease. Kidney Int. 2010; 77:950–55. https://doi.org/10.1038/ki.2010.88 [PubMed]
- 10. Gajjala PR, Sanati M, Jankowski J. Cellular and Molecular Mechanisms of Chronic Kidney Disease with Diabetes Mellitus and Cardiovascular Diseases as Its Comorbidities. Front Immunol. 2015; 6:340. https://doi.org/10.3389/fimmu.2015.00340 [PubMed]
- 11. Massagué J. TGF-beta signal transduction. Annu Rev Biochem. 1998; 67:753–91. https://doi.org/10.1146/annurev.biochem.67.1.753 [PubMed]
- 12. Eddy AA. Overview of the cellular and molecular basis of kidney fibrosis. Kidney Int Suppl (2011). 2014; 4:2–8. https://doi.org/10.1038/kisup.2014.2 [PubMed]
- 13. Meng XM, Nikolic-Paterson DJ, Lan HY. TGF-β: the master regulator of fibrosis. Nat Rev Nephrol. 2016; 12:325–38. https://doi.org/10.1038/nrneph.2016.48 [PubMed]
- 14. Stewart AG, Thomas B, Koff J. TGF-β: master regulator of inflammation and fibrosis. Respirology. 2018; 23:1096–97. https://doi.org/10.1111/resp.13415 [PubMed]
- 15. Xu J, Lamouille S, Derynck R. TGF-beta-induced epithelial to mesenchymal transition. Cell Res. 2009; 19:156–72. https://doi.org/10.1038/cr.2009.5 [PubMed]
- 16. Lan HY. Diverse roles of TGF-β/Smads in renal fibrosis and inflammation. Int J Biol Sci. 2011; 7:1056–67. https://doi.org/10.7150/ijbs.7.1056 [PubMed]
- 17. Wilusz JE, Sunwoo H, Spector DL. Long noncoding RNAs: functional surprises from the RNA world. Genes Dev. 2009; 23:1494–504. https://doi.org/10.1101/gad.1800909 [PubMed]
- 18. Sun M, Gadad SS, Kim DS, Kraus WL. Discovery, Annotation, and Functional Analysis of Long Noncoding RNAs Controlling Cell-Cycle Gene Expression and Proliferation in Breast Cancer Cells. Mol Cell. 2015; 59:698–711. https://doi.org/10.1016/j.molcel.2015.06.023 [PubMed]
- 19. Mattick JS. The genetic signatures of noncoding RNAs. PLoS Genet. 2009; 5:e1000459. https://doi.org/10.1371/journal.pgen.1000459 [PubMed]
- 20. Magistri M, Velmeshev D. Identification of Long Noncoding RNAs Associated to Human Disease Susceptibility. Methods Mol Biol. 2017; 1543:197–208. https://doi.org/10.1007/978-1-4939-6716-2_10 [PubMed]
- 21. Marchese FP, Raimondi I, Huarte M. The multidimensional mechanisms of long noncoding RNA function. Genome Biol. 2017; 18:206. https://doi.org/10.1186/s13059-017-1348-2 [PubMed]
- 22. Latronico MV, Condorelli G. Therapeutic applications of noncoding RNAs. Curr Opin Cardiol. 2015; 30:213–21. https://doi.org/10.1097/HCO.0000000000000162 [PubMed]
- 23. Shi X, Sun M, Liu H, Yao Y, Song Y. Long non-coding RNAs: a new frontier in the study of human diseases. Cancer Lett. 2013; 339:159–66. https://doi.org/10.1016/j.canlet.2013.06.013 [PubMed]
- 24. Wapinski O, Chang HY. Long noncoding RNAs and human disease. Trends Cell Biol. 2011; 21:354–61. https://doi.org/10.1016/j.tcb.2011.04.001 [PubMed]
- 25. Xin JW, Jiang YG. Long noncoding RNA MALAT1 inhibits apoptosis induced by oxygen-glucose deprivation and reoxygenation in human brain microvascular endothelial cells. Exp Ther Med. 2017; 13:1225–34. https://doi.org/10.3892/etm.2017.4095 [PubMed]
- 26. Zeng Q, Wang Q, Chen X, Xia K, Tang J, Zhou X, Cheng Y, Chen Y, Huang L, Xiang H, Cao K, Zhou J. Analysis of lncRNAs expression in UVB-induced stress responses of melanocytes. J Dermatol Sci. 2016; 81:53–60. https://doi.org/10.1016/j.jdermsci.2015.10.019 [PubMed]
- 27. Li SY, Susztak K. The long noncoding RNA Tug1 connects metabolic changes with kidney disease in podocytes. J Clin Invest. 2016; 126:4072–75. https://doi.org/10.1172/JCI90828 [PubMed]
- 28. Xie H, Xue JD, Chao F, Jin YF, Fu Q. Long non-coding RNA-H19 antagonism protects against renal fibrosis. Oncotarget. 2016; 7:51473–81. https://doi.org/10.18632/oncotarget.10444 [PubMed]
- 29. Yan J, Du F, Li SD, Yuan Y, Jiang JY, Li S, Li XY, Du ZX. AUF1 modulates TGF-β signal in renal tubular epithelial cells via post-transcriptional regulation of Nedd4L expression. Biochim Biophys Acta Mol Cell Res. 2018; 1865:48–56. https://doi.org/10.1016/j.bbamcr.2017.10.001 [PubMed]
- 30. Wang J, Pan J, Li H, Long J, Fang F, Chen J, Zhu X, Xiang X, Zhang D. lncRNA ZEB1-AS1 Was Suppressed by p53 for Renal Fibrosis in Diabetic Nephropathy. Mol Ther Nucleic Acids. 2018; 12:741–50. https://doi.org/10.1016/j.omtn.2018.07.012 [PubMed]
- 31. Gupta SC, Awasthee N, Rai V, Chava S, Gunda V, Challagundla KB. Long non-coding RNAs and nuclear factor-κB crosstalk in cancer and other human diseases. Biochim Biophys Acta Rev Cancer. 2020; 1873:188316. https://doi.org/10.1016/j.bbcan.2019.188316 [PubMed]
- 32. Bernard D, Prasanth KV, Tripathi V, Colasse S, Nakamura T, Xuan Z, Zhang MQ, Sedel F, Jourdren L, Coulpier F, Triller A, Spector DL, Bessis A. A long nuclear-retained non-coding RNA regulates synaptogenesis by modulating gene expression. EMBO J. 2010; 29:3082–93. https://doi.org/10.1038/emboj.2010.199 [PubMed]
- 33. Aboubakar Nana F, Vanderputten M, Ocak S. Role of Focal Adhesion Kinase in Small-Cell Lung Cancer and Its Potential as a Therapeutic Target. Cancers (Basel). 2019; 11:1683. https://doi.org/10.3390/cancers11111683 [PubMed]
- 34. Meyer KD, Jaffrey SR. The dynamic epitranscriptome: N6-methyladenosine and gene expression control. Nat Rev Mol Cell Biol. 2014; 15:313–26. https://doi.org/10.1038/nrm3785 [PubMed]
- 35. Maity A, Das B. N6-methyladenosine modification in mRNA: machinery, function and implications for health and diseases. FEBS J. 2016; 283:1607–30. https://doi.org/10.1111/febs.13614 [PubMed]
- 36. Zhang S. Mechanism of N6-methyladenosine modification and its emerging role in cancer. Pharmacol Ther. 2018; 189:173–83. https://doi.org/10.1016/j.pharmthera.2018.04.011 [PubMed]
- 37. Shi H, Wei J, He C. Where, When, and How: Context-Dependent Functions of RNA Methylation Writers, Readers, and Erasers. Mol Cell. 2019; 74:640–50. https://doi.org/10.1016/j.molcel.2019.04.025 [PubMed]
- 38. Yang Y, Hsu PJ, Chen YS, Yang YG. Dynamic transcriptomic m(6)A decoration: writers, erasers, readers and functions in RNA metabolism. Cell Res. 2018; 28:616–24. https://doi.org/10.1038/s41422-018-0040-8 [PubMed]
- 39. Allinovi M, De Chiara L, Angelotti ML, Becherucci F, Romagnani P. Anti-fibrotic treatments: A review of clinical evidence. Matrix Biol. 2018; 68–69:333–354. https://doi.org/10.1016/j.matbio.2018.02.017 [PubMed]
- 40. Zhang Y, Li H, Zhu J, Wei T, Peng Y, Li R, Xu R, Li M, Xia A. Role of artesunate in TGF-β1-induced renal tubular epithelial-mesenchymal transdifferentiation in NRK-52E cells. Mol Med Rep. 2017; 16:8891–99. https://doi.org/10.3892/mmr.2017.7728 [PubMed]
- 41. He P, Li D, Zhang B. Losartan attenuates renal interstitial fibrosis and tubular cell apoptosis in a rat model of obstructive nephropathy. Mol Med Rep. 2014; 10:638–44. https://doi.org/10.3892/mmr.2014.2304 [PubMed]
- 42. Jiang C, Li S, Li Y, Bai Y. Anticancer Effects of Dihydroartemisinin on Human Esophageal Cancer Cells In Vivo. Anal Cell Pathol (Amst). 2018; 2018:8759745. https://doi.org/10.1155/2018/8759745 [PubMed]
- 43. Wang L, Yang F, Jia LT, Yang AG. Missing Links in Epithelial-Mesenchymal Transition: Long Non-Coding RNAs Enter the Arena. Cell Physiol Biochem. 2017; 44:1665–80. https://doi.org/10.1159/000485766 [PubMed]
- 44. Salmena L, Poliseno L, Tay Y, Kats L, Pandolfi PP. A ceRNA hypothesis: the Rosetta Stone of a hidden RNA language? Cell. 2011; 146:353–58. https://doi.org/10.1016/j.cell.2011.07.014 [PubMed]
- 45. Border WA, Noble NA. TGF-beta in kidney fibrosis: a target for gene therapy. Kidney Int. 1997; 51:1388–96. https://doi.org/10.1038/ki.1997.190 [PubMed]
- 46. Böttinger EP, Bitzer M. TGF-beta signaling in renal disease. J Am Soc Nephrol. 2002; 13:2600–10. https://doi.org/10.1097/01.ASN.0000033611.79556.AE [PubMed]
- 47. Gewin L, Vadivelu S, Neelisetty S, Srichai MB, Paueksakon P, Pozzi A, Harris RC, Zent R. Deleting the TGF-β receptor attenuates acute proximal tubule injury. J Am Soc Nephrol. 2012; 23:2001–11. https://doi.org/10.1681/ASN.2012020139 [PubMed]
- 48. Gewin LS. Renal fibrosis: Primacy of the proximal tubule. Matrix Biol. 2018; 68–69:248–62. https://doi.org/10.1016/j.matbio.2018.02.006 [PubMed]
- 49. Bonventre JV. Pathophysiology of acute kidney injury: roles of potential inhibitors of inflammation. Contrib Nephrol. 2007; 156:39–46. https://doi.org/10.1159/000102069 [PubMed]
- 50. Arvaniti E, Moulos P, Vakrakou A, Chatziantoniou C, Chadjichristos C, Kavvadas P, Charonis A, Politis PK. Whole-transcriptome analysis of UUO mouse model of renal fibrosis reveals new molecular players in kidney diseases. Sci Rep. 2016; 6:26235. https://doi.org/10.1038/srep26235 [PubMed]
- 51. Xue R, Li Y, Li X, Ma J, An C, Ma Z. miR-185 affected the EMT, cell viability, and proliferation via DNMT1/MEG3 pathway in TGF-β1-induced renal fibrosis. Cell Biol Int. 2019; 43:1152–62. https://doi.org/10.1002/cbin.11046 [PubMed]
- 52. Zhou H, Gao L, Yu ZH, Hong SJ, Zhang ZW, Qiu ZZ. LncRNA HOTAIR promotes renal interstitial fibrosis by regulating Notch1 pathway via the modulation of miR-124. Nephrology (Carlton). 2019; 24:472–80. https://doi.org/10.1111/nep.13394 [PubMed]
- 53. Li A, Peng R, Sun Y, Liu H, Peng H, Zhang Z. LincRNA 1700020I14Rik alleviates cell proliferation and fibrosis in diabetic nephropathy via miR-34a-5p/Sirt1/HIF-1α signaling. Cell Death Dis. 2018; 9:461. https://doi.org/10.1038/s41419-018-0527-8 [PubMed]
- 54. Karreth FA, Pandolfi PP. ceRNA cross-talk in cancer: when ce-bling rivalries go awry. Cancer Discov. 2013; 3:1113–21. https://doi.org/10.1158/2159-8290.CD-13-0202 [PubMed]
- 55. Xiang Y, Zhang Y, Tang Y, Li Q. MALAT1 Modulates TGF-β1-Induced Endothelial-to-Mesenchymal Transition through Downregulation of miR-145. Cell Physiol Biochem. 2017; 42:357–372. https://doi.org/10.1159/000477479 [PubMed]