


Introduction
Hepatocellular Carcinoma (HCC) is one of the most common cancers worldwide, especially in East Asia and sub-Saharan Africa [1, 2]. The major risk factors for HCC are chronic hepatitis B virus (HBV) and hepatitis C virus (HCV) infections [3, 4]. The dietary aflatoxin exposure, alcoholic abuse, age-related disorders, and metabolic disorders due to obesity are also linked to increased risk for HCC [5–7]. Antiviral therapy reduces the risk of HCC caused by chronic HBV infections [8, 9], but, elderly HCC patients show poor response to interferon-based antiviral therapy [10]. Furthermore, the incidence of HCC is significantly higher in elderly patients, probably due to reduced efficiency of physiological functions and increased susceptibility to infections [10–13]. A large number of HCC patients are diagnosed in the advanced stages because the symptoms are not evident during early stages. Moreover, the survival rates of these patients are poor despite the availability of curative treatments because of increased recurrence [14]. Hence, effective early diagnostic markers and novel therapeutic targets are necessary to improve the overall survival rates and disease prognosis of HCC patients. The gold standard diagnostic marker for HCC is alpha-fetoprotein (AFP). However, its sensitivity and specificity is low and its expression can be influenced by several non-HCC related factors [15, 16]. Hence, novel sensitive biomarkers are urgently needed for early identification of HCC and improve the clinical outcomes. Previous studies have identified glypican 3 (GPC3), Golgi protein-73 (GP73), descarboxyprothrombin (DCP), glutamic—pyruvic transaminase (GPT) and gamma-glutamyl carboxylase (GGCX) as complementary biomarkers for HCC diagnosis [17–19]. Nevertheless, the early and specific diagnosis of HCC remains challenging.
Apyrimidinic endodeoxyribonuclease 1 (APEX1) is involved in the DNA damage response and is expressed in a wide array of human tissues [20]. Aberrant expression of APEX1 can disrupt several physiological processes, including cellular redox homeostasis, smooth muscle cell migration, cell cycle, apoptosis, and mRNA stability [21]. The N-terminal APEX1 domain is responsible for the redox regulation of transcription factors, such as p53 [22], c-Fos and c-Jun [23], and Myb [24]. The C-terminal domain is critical for the DNA repair activity of APEX1 [25]. In some cancers, APEX1 is aberrantly expressed and activates the Notch signaling pathway [20]. The expression of APEX1 positively correlates with the prognosis of osteosarcoma patients [26]. Furthermore, high expression of APEX1 is associated with chemotherapeutic resistance in biliary cancer, and hence considered as a potential therapeutic target to sensitize tumors to chemotherapy [27].
In this study, we investigated the expression and clinical significance of APEX1 in HCC.
Results
APEX1 is overexpressed in hepatocellular carcinoma
We observed significantly higher expression of APEX1 mRNA in the HCC tissues compared to the normal liver tissues in the Roessler Liver dataset from the Oncomine database (Figure 1A). Moreover, APEX1 mRNA levels were significantly higher in the HCC tissues compared to the adjacent normal liver tissues in multiple GEO datasets (Figure 1B–1G). These results demonstrate that APEX1 is overexpressed in HCC.
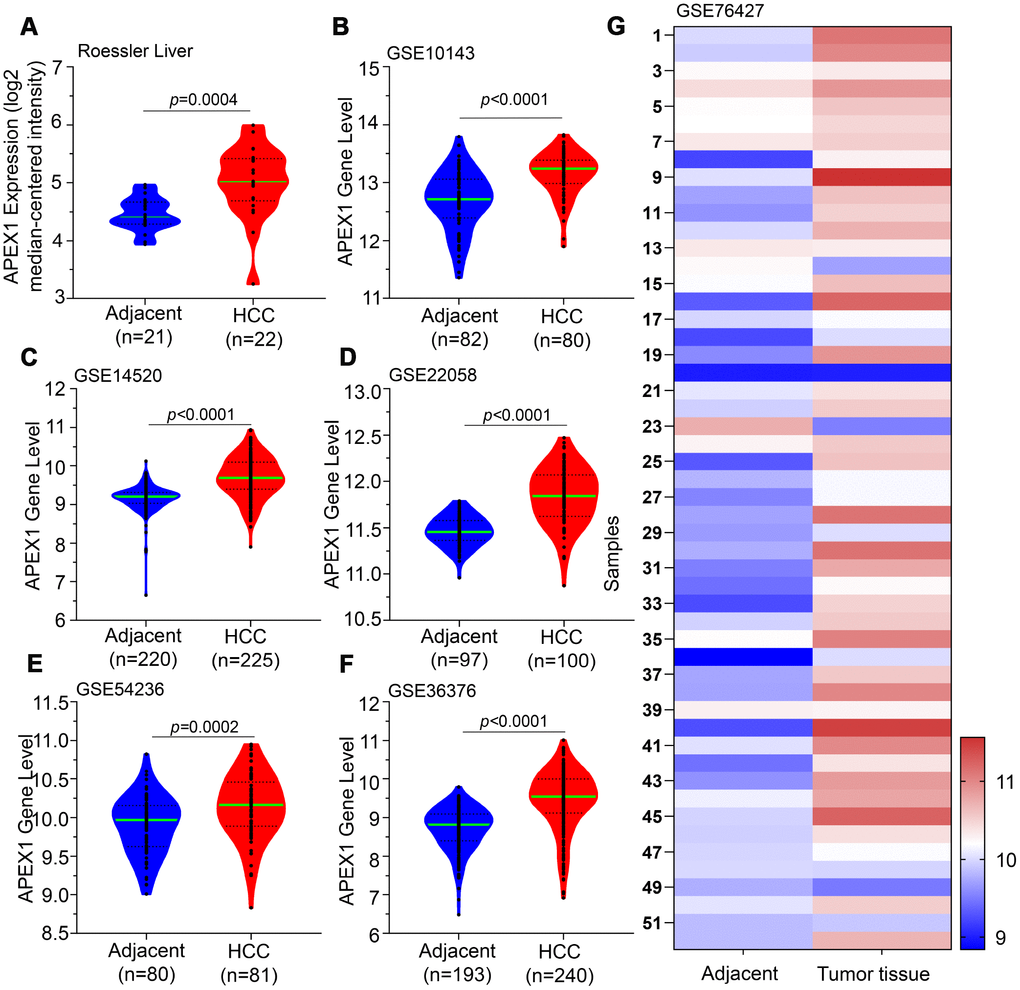
Figure 1. APEX1 transcript levels in HCC and adjacent normal liver tissues. The APEX1 transcript levels in HCC and adjacent normal liver tissues from the (A) Roessler Liver dataset (22 HCC and 21 normal liver samples) and (B) GSE10143; (C) GSE14520; (D) GSE22058; (E) GSE54236; and (F) GSE36376 datasets are shown. (G) The heatmap shows APEX1 mRNA expression in 52 paired HCC and corresponding adjacent normal liver tissues.
The expression of APEX1 was positively correlated with the development of hepatocellular carcinoma
APEX1 was overexpressed in the HCC tissues compared to normal liver tissues in The Cancer Genome Atlas (TCGA) database (Figure 2A). Next, we analyzed APEX1 expression in HCC specimens from different tumor stages in the TCGA database. We observed incremental increase in the APEX1 mRNA levels with higher tumor grades and stages (Figure 2B, 2C). The expression of APEX1 was significantly higher even in the early-stages of HCC compared with the normal liver tissues (Figure 2B, 2C). APEX1 mRNA levels were significantly higher in grade 3 HCC samples than in the grade 1 HCC tissues from the Wurmbach liver dataset from the Oncomine database (Figure 2D and Supplementary Figure 1). Furthermore, analysis of the Human Protein Atlas database showed that the APEX1 protein levels in the HCC tissues were 75% higher quantity than in the normal liver tissue samples (Figure 2E).
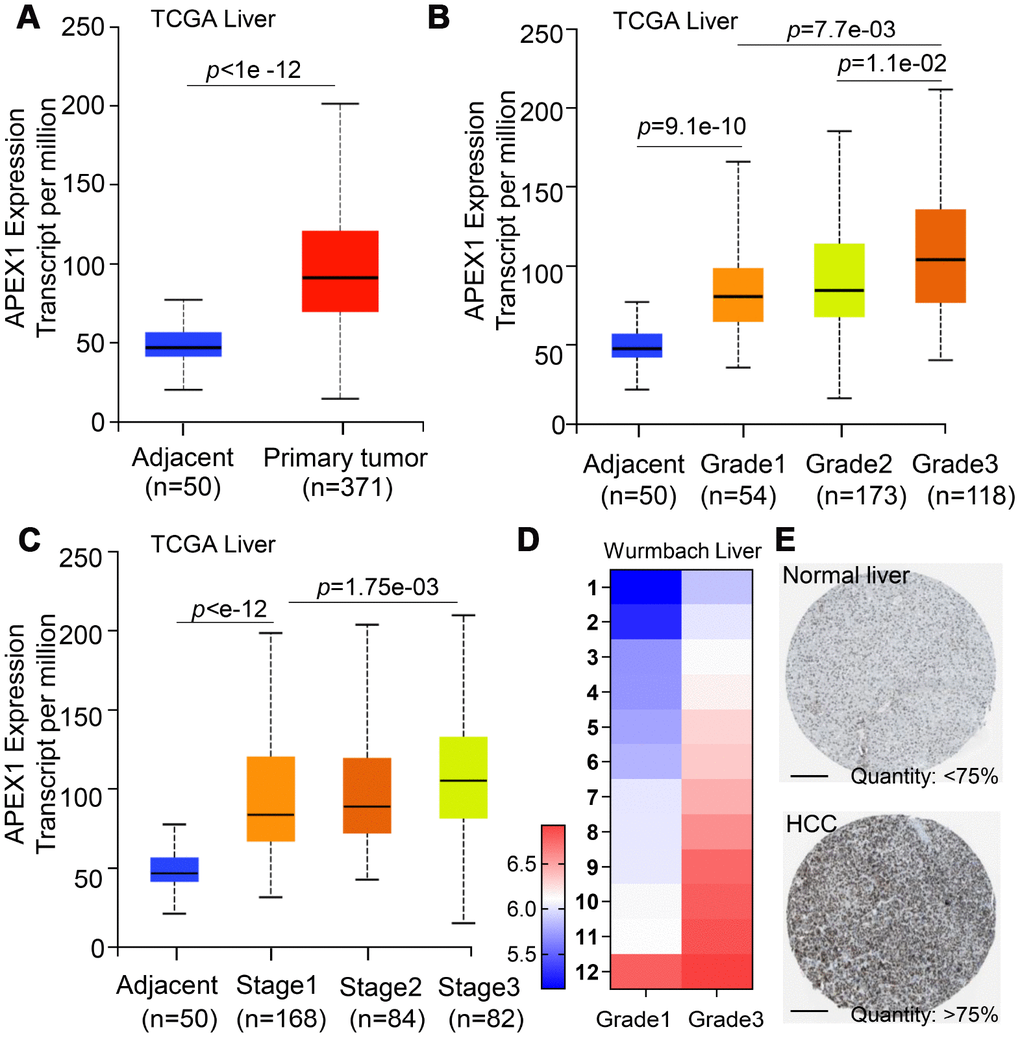
Figure 2. APEX1 mRNA and protein expression correlates with HCC tumor grades. (A) APEX1 mRNA levels in 371 HCC and 50 normal liver tissues from the TCGA database are shown. (B) The histogram plot shows APEX1 mRNA expression in grades 1-4 HCC patients. As shown, APEX1 mRNA expression is incrementally upregulated with increasing tumor grades. (C) The histogram plot shows APEX1 mRNA expression levels in stages 1-4 HCC patients. As shown, APEX1 mRNA levels show incremental upregulation with increasing tumor stages. (D) The heat map shows APEX1 mRNA levels in grade 1 and 3 HCC patients in the Wurmbach Liver dataset from the Oncomine database. (E) Representative images show APEX1 protein expression in HCC and adjacent normal liver tissues that were obtained from The Human Protein Atlas database. The APEX protein expression was analyzed by immunohistochemistry. The scale bar is 200μm.
APEX1 is a diagnostic biomarker for HCC
QRT-PCR analysis of 45 paired HCC patient samples showed that APEX1 mRNA levels were significantly higher in tumor tissues compared to paired adjacent normal liver tissues (Figure 3A). Among these, APEX1 expression in HCC tissues was five-fold higher in 19 cases and 1.5-fold higher in 15 cases compared with their corresponding adjacent normal liver tissues. The mean APEX1 expression in the 45 HCC tissue samples was 75% higher than in the corresponding adjacent normal liver tissue samples (Figure 3B). These data demonstrate that APEX1 is highly expressed in HCC tissues. Based on these results, we hypothesized that APEX1 is a diagnostic biomarker for HCC. ROC curve analysis demonstrated that APEX1 was diagnostically significant with an AUC value of 0.7432 (Figure 3C). This strongly suggests that APEX1 is a potential diagnostic biomarker for HCC.
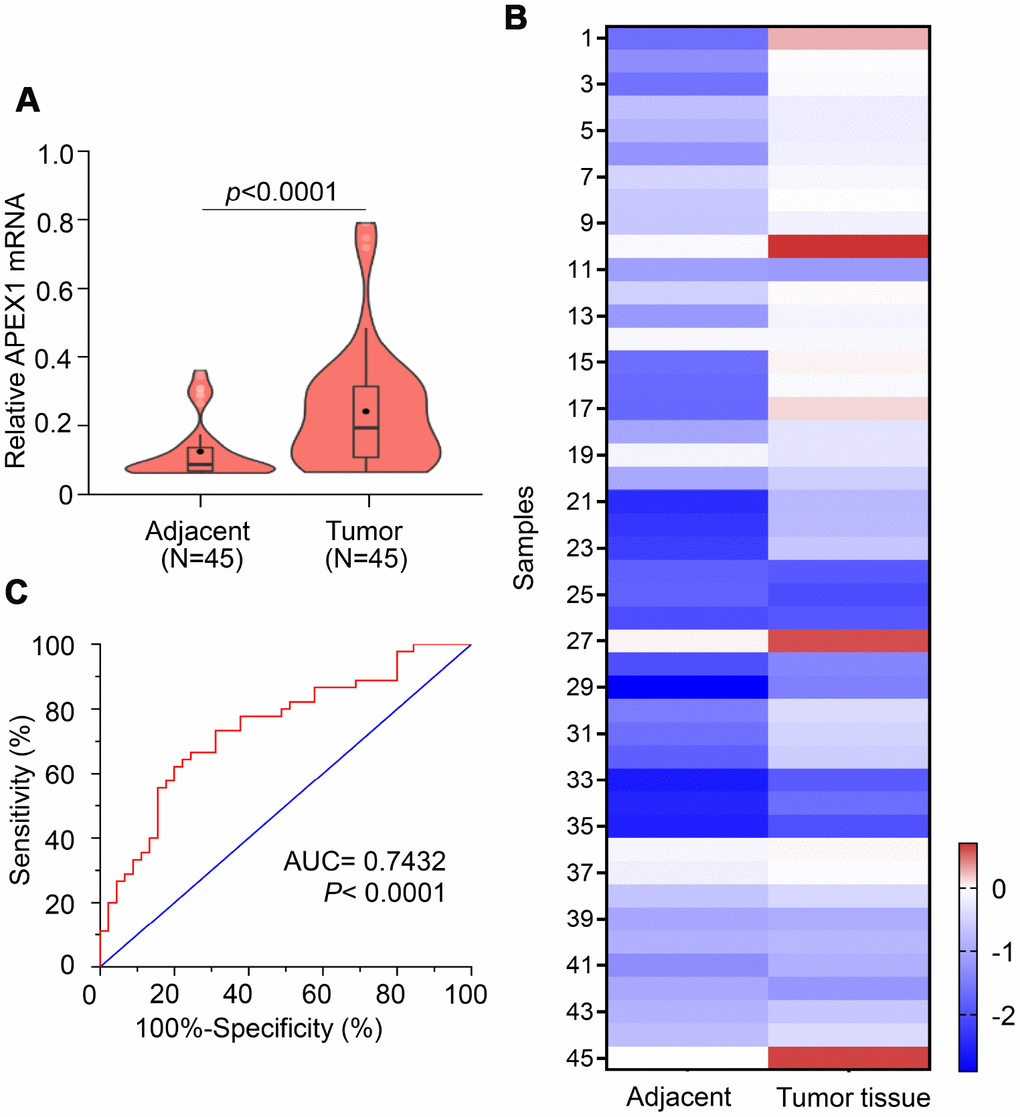
Figure 3. APEX1 is a potential diagnostic biomarker for HCC. (A) The violin plot, (B) heatmap and (C) ROC curve analysis shows APEX1 mRNA levels in tumor and adjacent normal liver tissues isolated from 45 HCC patients.
APEX1 shows higher positive predictive value than AFP for HCC diagnosis
Next, we analyzed the GSE25097 and GSE63898 datasets using ROC analysis to distinguish HCC from liver cirrhosis patients. Both APEX1 and AFP expression was significantly higher in HCC tissues compared to liver cirrhosis samples (Figure 4A and Supplementary Figure 2). The AUC value of 0.823 for APEX1 (95% CI: 0.765 to 0.881; p<0.001) was significantly higher than the AUC value of 0.7869 for AFP in HCC tumor samples (95% CI: 0.7295 to 0.8443, p<0.0001) as shown in Figure 4B. Then, we determined the best cut-off values for APEX1 and AFP based on the specificity and sensitivity of the ROC curve. The negative predictive values (NPV) for APEX1 (90%) and AFP (97.5%) were statistically similar, but, the positive predictive value (PPV) of APEX1 (67.91%) was significantly higher than the PPV for AFP (55.22%) as shown in Figure 4B, 4C. This demonstrates that APEX1 was a more sensitive diagnostic marker than AFP in HCC patients. Next, we performed ROC analysis of HCC and liver cirrhosis samples using the GSE63898 dataset. In the GSE63898 dataset, the APEX1 mRNA levels of the HCC tissues were significantly higher than the liver cirrhosis samples (Figure 4D). Moreover, the AUC value for AFP was 0.5874 (95%CI, 0.53 to 0.64; p=0.003), which was significantly lower than the AUC value of 0.7378 for APEX1 (95%CI, 0.69 to 0.79, p<0.0001) for the HCC samples (Figure 4E). Moreover, the NPV for AFP was similar to that of APEX1, but, the PPV for APEX1 (66.23%) was significantly higher than the PPV for AFP (42.54%) (Figure 4F). These results demonstrate that APEX1 was a more sensitive diagnostic marker than AFP to distinguish HCC patients from those with liver cirrhosis.
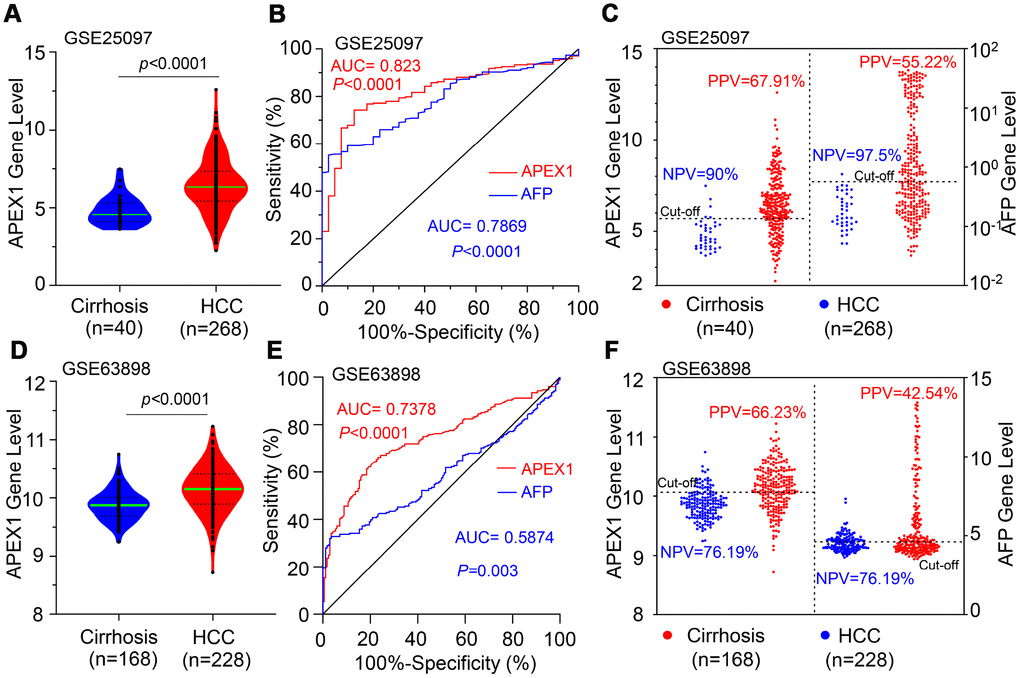
Figure 4. APEX1 shows a higher positive predictive value than AFP in HCC patients. (A) The histogram plot shows APEX1 mRNA levels in patients with liver cirrhosis (n=40) and HCC (n=268) from the GSE25097 dataset. (B) ROC curve analysis shows the diagnostic value of APEX1 and AFP in liver cirrhosis and HCC patients from the GSE25097 dataset. (C) The optimal cut-off value for APEX1 and AFP in liver cirrhosis and HCC patients was determined according to the Youden and Product indices. Also shown are the positive predictive value (PPV) and negative predictive value (NPV) for APEX1 and AFP. (D) The histogram plot shows relative APEX1 mRNA levels in patients with liver cirrhosis (n=168) and HCC (n=228) from the GSE63898 dataset. (E) ROC curve analysis shows the diagnostic values of APEX1 and AFP in the liver cirrhosis and HCC patients from the GSE63898 dataset. (F) The optimal cut-off values for APEX1 and AFP in the liver cirrhosis and HCC patients was determined according to the Youden and Product indices. Also shown are the PPV and NPV for APEX1 and AFP.
APEX1 shows better diagnostic value in HCC patients with low AFP expression
HCC patients with low AFP expression cannot be distinguished from those with liver cirrhosis because of low sensitivity of AFP. Therefore, we evaluated the diagnostic value of APEX1 in HCC patients with low AFP expression using the GSE25097 and GSE63898 datasets. The APEX1 levels were significantly higher in low-AFP expressing HCC patients compared to patients with liver cirrhosis (Figure 5A and 5D). As expected, the AFP levels of liver cirrhosis and HCC patients were similar in these two datasets (Figure 5B and 5E), and the AUC value of AFP in the GSE25097 and GSE63898 datasets were not statistically significant (Figure 5C and 5F). The ROC curve analysis showed that the AUC values for APEX1 were statistically significant in both datasets (GSE25097: AUC, 0.7802, p<0.0001; GSE63898: AUC, 0.71, p<0.0001; Figure 5C and 5F). These data demonstrate that APEX1 can be used to accurately diagnose low AFP-expressing HCC patients that cannot be distinguished from those with liver cirrhosis using AFP.
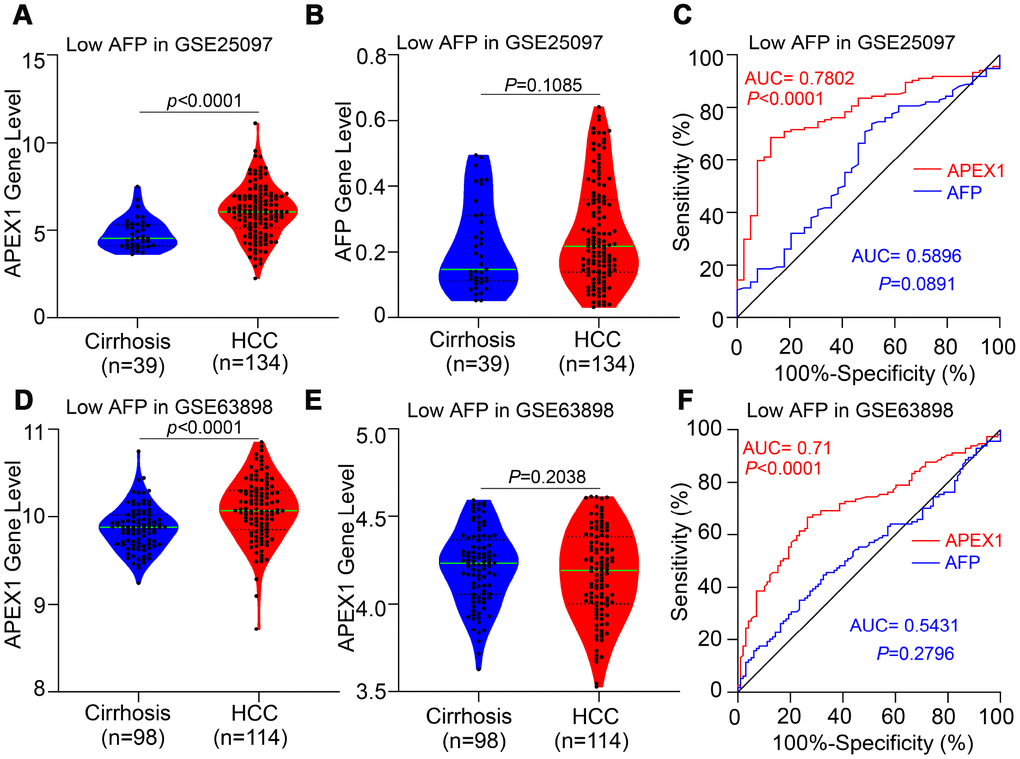
Figure 5. APEX1 expression is significantly higher in the HCC patients with low AFP expression and is a better diagnostic biomarker. (A, B) APEX1 and AFP mRNA expression in the liver cirrhosis (n=40) and HCC patients with low AFP expression (n=134) from the GSE25097 dataset is shown. The 134 HCC patients with low AFP expression were selected based on the median expression of AFP in 268 HCC patients from the GSE25097 dataset. (C) ROC curve analysis shows the diagnostic values of APEX1 and AFP in 134 HCC patients with low AFP expression from the GSE25097 dataset. (D, E) APEX1 and AFP mRNA expression in the liver cirrhosis (n=168) and HCC patients with low AFP expression (n=114) from the GSE63898 dataset is shown. The 114 HCC patients with low AFP expression were selected based on the median expression of AFP in 228 HCC patients in the GSE63898 dataset. (F) ROC curve analysis shows the diagnostic value of APEX1 and AFP in 114 HCC patients with low AFP expression from the GSE63898 dataset.
APEX1 is a better diagnostic biomarker in early stage HCC patients
Next, we analyzed the diagnostic value of APEX1 in stage 1 HCC patients using ROC analysis. As shown in Figure 6A, the diagnostic value of APEX1 (AUC: 0.80, 95%CI: 0.738-0.862, p<0.0001) was significantly higher than that of AFP (AUC: 0.607, 95%CI: 0.531-0.683, p=0.0252). Moreover, the positive predictive value (PPV) of APEX1 was significantly higher than that of AFP (62.5% vs. 43.75%; Figure 6B). These results suggest that APEX1 is a more sensitive biomarker than AFP in the early diagnosis of HCC. Pearson correlation analysis showed no association between APEX1 and AFP in HCC patients (Pearson R=0.062, p=0.23; Figure 6C). Moreover, APEX1 showed no correlation with other potential biomarkers such as DCP, GP73, GPC3, and GPT (Supplementary Figure 3). These data indicate that APEX1 is an independent diagnostic biomarker in HCC.
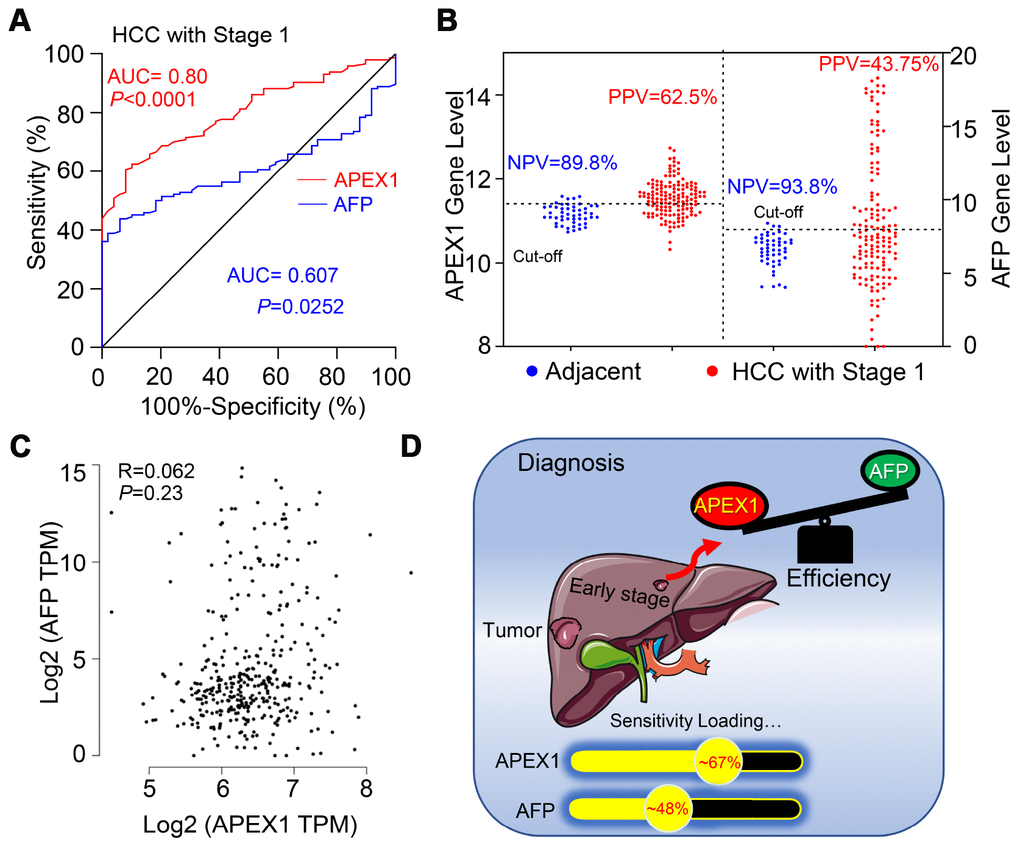
Figure 6. APEX1 is a better diagnostic biomarker than AFP in early stage HCC patients. (A) The diagnostic values of APEX1 and AFP in stage 1 HCC patients based on ROC curve analysis is shown. (B) The best cut-off values for APEX1 and AFP were calculated using the Youden index in combination with the Product index. (C) The analysis of Pearson correlation co-efficients for APEX1 and AFP expression in the HCC and adjacent normal liver tissues is shown. (D) The graphical representation shows the mean diagnostic sensitivity of APEX1 and AFP in HCC patients from the GSE25097 and GSE63898 datasets. APEX1 shows significantly higher diagnostic value compared to AFP.
High APEX1 expression correlates with drug resistance in HCC patients
Drug resistance is an important factor that determines poor prognosis of HCC patients. We analyzed the correlation between APEX1expression and drug resistance in HCC patients. Sorafenib is the gold standard main chemotherapeutic drug for treating advanced stage HCC patients, but its efficacy is affected by drug resistance [28]. We evaluated the correlation between APEX1 and sorafenib-resistance in HCC patients from the GSE109211 database. APEX1 expression was significantly higher in the sorafenib-resistant HCC patients than in the sorafenib-sensitive HCC patients (Figure 7A). However, the AFP levels of both sorafenib-sensitive and –resistant groups were similar (Figure 7B). Next, we analyzed the correlation between APEX1 expression and tolerance against PD-1 immunotherapy in HCC patients. APEX1 expression was significantly higher in HCC patients showing resistance against PD-1 immunotherapy compared to those sensitive to PD-1 immunotherapy (Figure 7C). However, AFP expression was similar in both PD-1 immunotherapy-resistant and –sensitive groups (Figure 7D). These results demonstrate that APEX1 expression correlates with drug resistance in HCC patients.
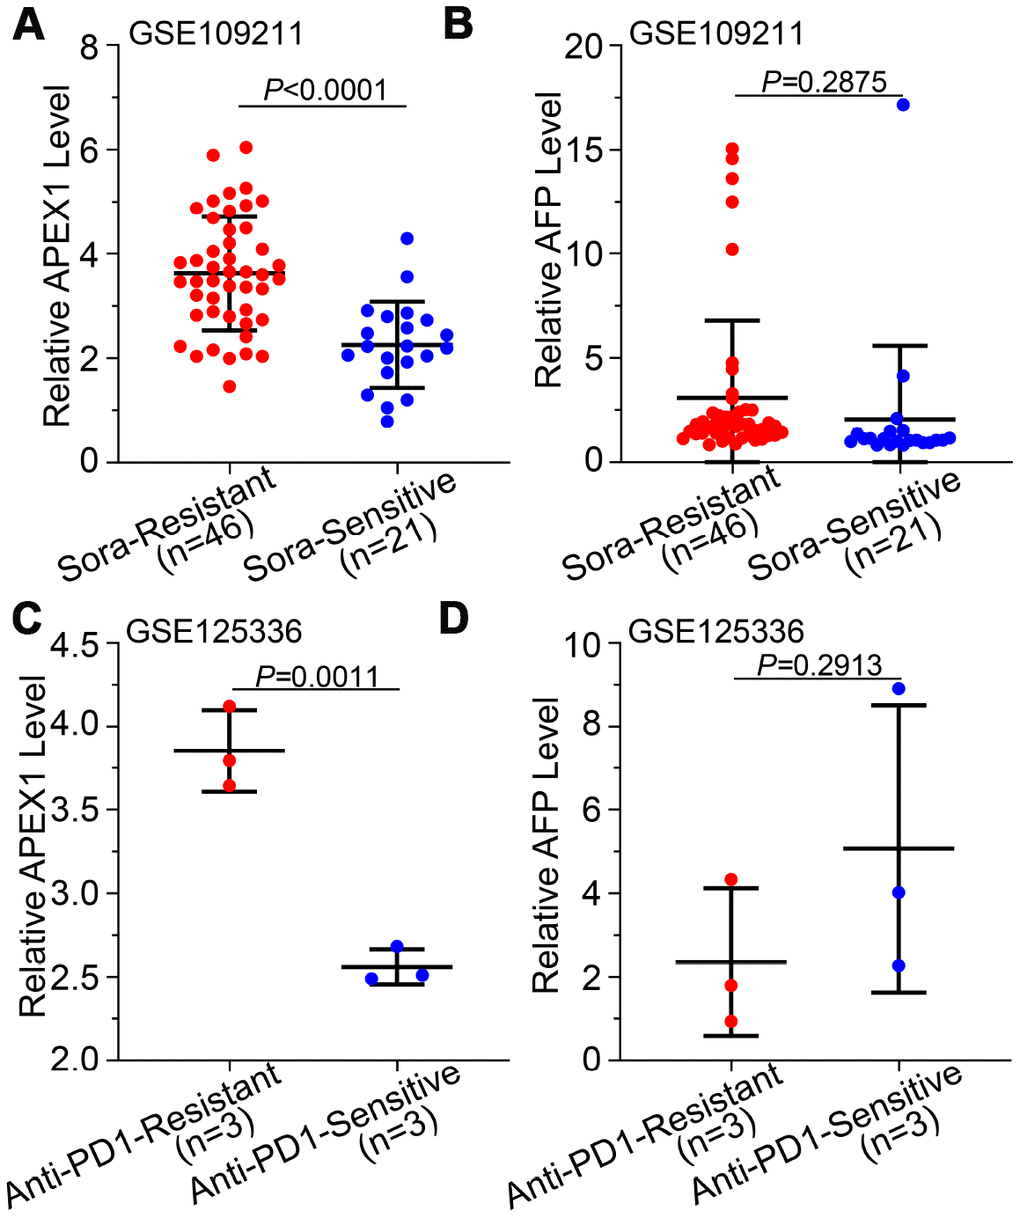
Figure 7. High APEX1 expression correlates with resistance against sorafenib and anti-PD1 immunotherapy in HCC patients. (A, B) APEX1 and AFP mRNA expression in 46 sorafenib-resistant and 21 sorafenib-sensitive HCC patients from the GSE109211 dataset is shown. (C, D) APEX1 and AFP expression in three anti-PD1 immunotherapy-resistant and three anti-PD1 immunotherapy-sensitive HCC patients belonging to the GSE125336 dataset is shown.
APEX1 expression correlates with prognosis of HCC patients
We then evaluated the prognostic significance of APEX1 in HCC patients. As shown in Figure 8A–8D, HCC patients with high APEX1 expression were associated with worse overall survival (OS, log-rank p=0.017), disease-specific survival (DSS, log-rank p=0.075), progression-free survival (PFS, log-rank p=0.006), and relapse-free survival (RFS, log-rank p=0.0011). Next, we analyzed the prognostic significance of APEX1 in early stage HCC patients. As shown in Figure 8E–8F, grade 1 or stage 1 HCC patients in the high APEX1 expression group were associated with worse OS (grade 1 HCC: HR=2.83, log-rank p=0.042; stage 1 HCC: HR=2.19; log-rank p=0.018) compared to those in the low APEX1 expression group. These results demonstrate that APEX1 is a potential prognostic biomarker in HCC patients, including those with early stage HCC.
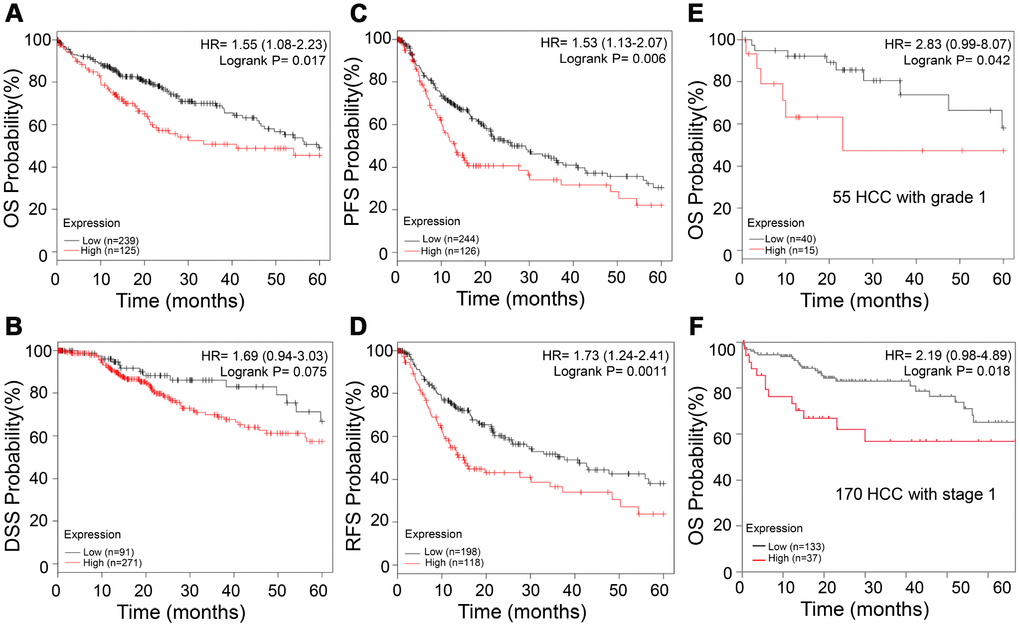
Figure 8. High APEX1 expression predicts poor prognosis in HCC patients, including those with grade 1 tumors. (A–D) Kaplan-Meier survival curve analysis shows OS, DSS, PFS and RFS rates of high and low APEX1 expressing HCC patients, respectively. (E) Kaplan-Meier survival curve analysis of 5-year OS probability of 55 tumor grade 1 HCC patients is shown. (F) Kaplan-Meier survival curve analysis of the 5-year OS rate of HCC patients with stage 1 cancer is shown. The hazard ratio (HR) was calculated based on the Cox Proportional-Hazards model.
APEX1 expression correlates with prognosis in non-alcoholic, vascular invasion-negative and hepatitis virus infection-negative HCC patients
Next, we analyzed the correlation between APEX1 expression and various clinical characteristics of HCC patients, including alcohol consumption, vascular invasion, and hepatitis virus infection. The OS rates were similar in high- and low-APEX1 expressing HCC patients that belong to alcohol consuming, vascular invasion-positive, and hepatitis virus infection-positive groups (Figure 9A–9C). However, high APEX1 expressing HCC patients belonging to non-alcohol consuming, vascular invasion-negative and hepatitis virus infection-negative groups showed significantly worse OS rates than those with low APEX1 expression (Figure 9D–9F; Supplementary Figure 4, log-rank p=0.026). These data suggests that APEX1 is a valuable prognostic biomarker for HCC patients belonging to non-alcohol consuming, vascular invasion-negative and hepatitis virus infection-negative groups.
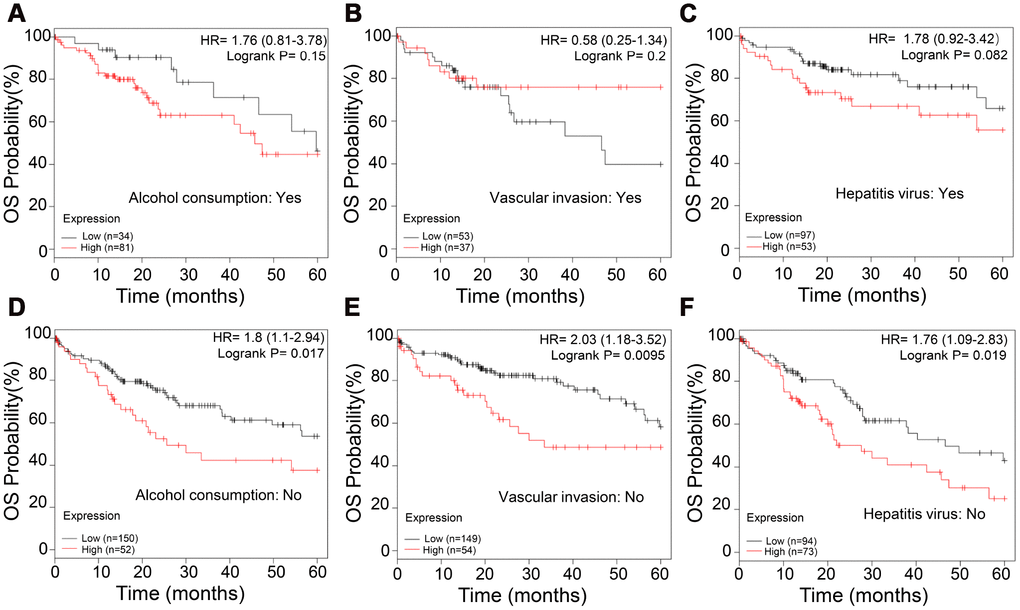
Figure 9. APEX1 is a prognostic biomarker in non-alcoholic, vascular invasion-negative and hepatitis virus infection-negative HCC patients. (A, B) Kaplan-Meier survival curve analysis shows the OS rates of high- and low-APEX1 expressing alcoholic and non-alcoholic HCC patients. (C, D) Kaplan-Meier survival curve analysis shows the OS rates of high- and low-APEX1 expressing vascular invasion-positive and vascular invasion-negative HCC patients. (E, F) Kaplan-Meier survival curve analysis shows the OS rates of high- and low-APEX1 expressing hepatitis virus infection-positive and hepatitis virus infection-negative HCC patients.
High APEX1 expression correlates with DNA damage repair signaling in HCC
Previous studies have shown that APEX1 is actively involved in the DNA damage response in lung [29] and prostate [30] cancers. Moreover, DNA damage repair pathways play an important role in the growth and progression of several cancers [31]. Gene set enrichment analysis (GSEA) analysis of paired HCC and adjacent normal liver samples showed that the top ten differentially regulated pathways were MYC, DNA damage repair, Wnt/β-catenin, E2F, G2/M checkpoint, mitotic spindle, glycolysis, and mTORC1 signaling (Figure 10A). The normalized enrichment score for the DNA damage repair pathway was 1.334 (Figure 10B), which suggests that DNA damage repair positively correlates with HCC growth and progression. We then analyzed the signaling pathways associated with prognosis or survival of HCC patients. The list of significant survival-associated genes in HCC tissues are shown in Supplementary Table 1 with GEPIA portal. Gene ontology (GO) analysis demonstrates that the DNA repair pathway significantly correlates with the prognosis of HCC patients (Figure 10C). The genes that co-express with APEX1 in HCC tissues are shown in Figure 10D. High APEX1 expression in HCC tissues positively correlates with pathways related to DNA conformational change and DNA damage repair (Figure 10E, 10F). These results show that APEX1 expression positively correlates with the DNA damage repair signaling pathway in HCC patients.
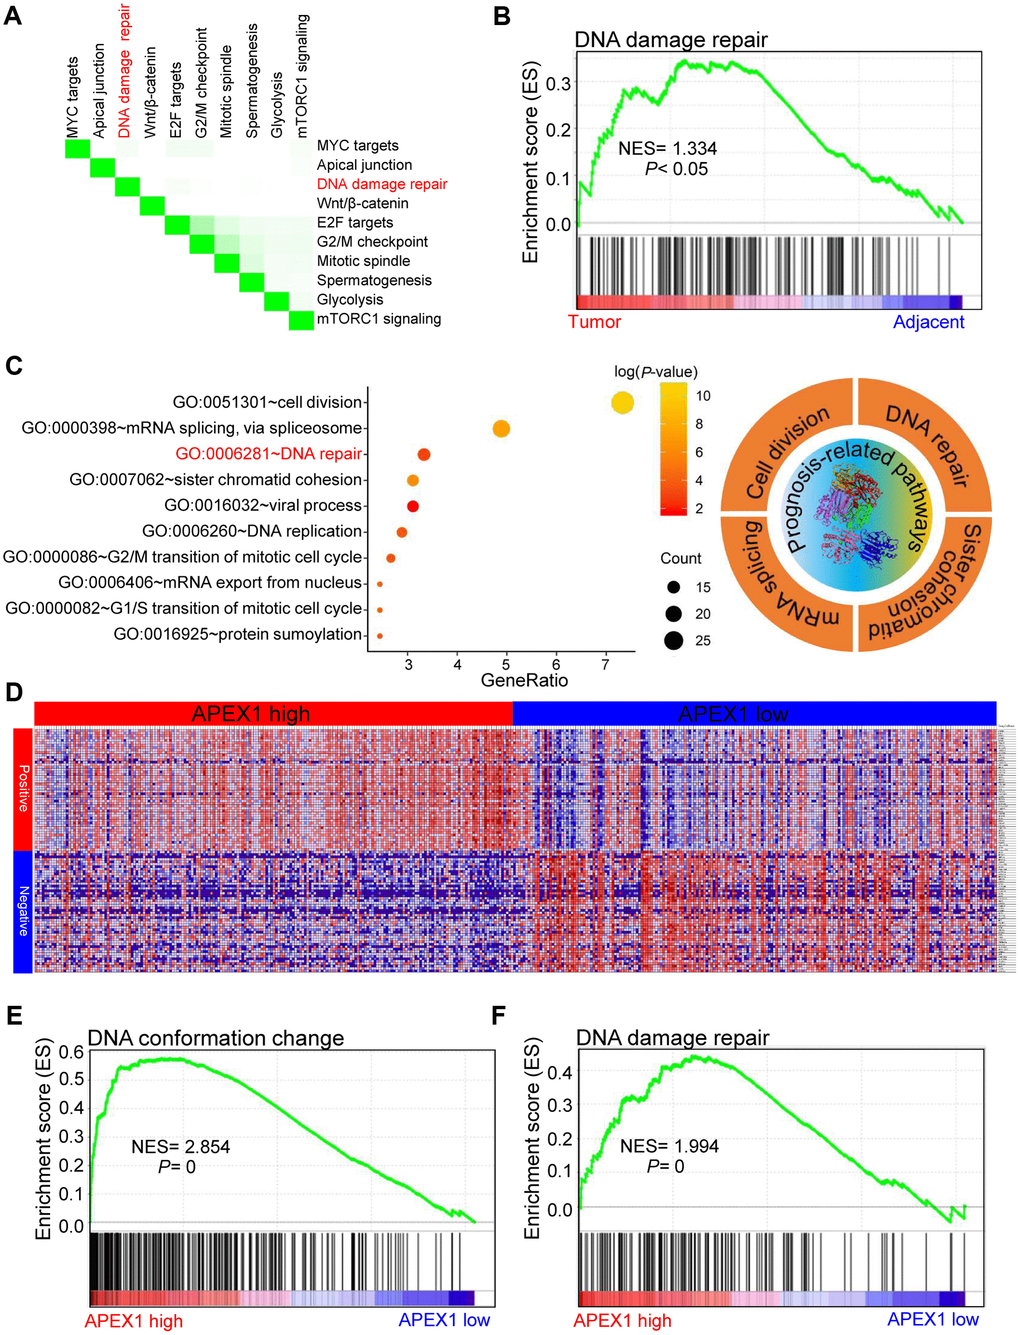
Figure 10. High APEX1 expression positively correlates with DNA damage repair in HCC patients. (A) The top ten signaling pathways in HCC tissues based on gene set enrichment analysis (GSEA) are shown. (B) Enrichment plot shows the status of DNA damage repair pathways in HCC and adjacent normal liver tissue samples. (C) The most significant survival-associated genes in the HCC tissues according to analysis using the GEPIA portal and the most enriched genes in HCC tissues based on the gene ontology (GO) analysis are shown. The right panel shows the top four prognosis-related pathways that are enriched in the HCC tissues. (D) The median mRNA levels of genes that co-express with APEX1 in HCC tissues are shown. (E, F) The enrichment plot shows GSEA analysis of genes involved in DNA conformation change and DNA damage repair in the HCC tissues.
Discussion
HCC ranks 14th among the cancers with newly diagnosed cases in a year and 5th among the cancer- related mortality according to the 2019 cancer statistics reported in the United States [32]. Sorafenib is the only FDA-approved chemotherapeutic drug for advanced stage HCC [28]. There is an urgent need for novel therapeutic options for HCC to overcome the poor survival outcomes because of fewer effective drugs, chemotherapeutic resistance, and radiation toxicity. Furthermore, most patients are diagnosed in the advanced stages and are not amenable for surgery. Hence, there is an urgent need for effective early diagnostic markers to improve the prognosis of HCC patients. While aberrant APEX1 expression has been reported in some tumors including prostate cancer, colon cancer and so on [20, 30], its role in HCC is relatively unknown. Therefore, we aimed to study the expression and the clinical significance of APEX1 in HCC. Our study shows that APEX1 is overexpressed in early and advanced stage HCC tumor tissues (Figures 1–3). Besides, APEX1 expression positively correlates with HCC initiation and progression (Figure 2A–2D). These results suggest that APEX1 is a potential biomarker for HCC. ROC curve analysis demonstrates that the positive predictive value of APEX1 was better than that of AFP, the current gold standard biomarker for HCC diagnosis (Figure 4). We also demonstrate that APEX1 is highly expressed in early stage HCC patients (Figure 2B, 2C) and is a more sensitive diagnostic biomarker in HCC patients with low AFP expression (Figure 5). The diagnostic sensitivity of APEX1 is significantly higher than AFP (62.5% vs. 43.75%; Figure 6B). These results demonstrate that APEX1 is a very effective diagnostic biomarker for HCC, especially for early stage HCC patients with low AFP expression. Moreover, correlation analysis shows that APEX1expression is an independent diagnostic factor for HCC (Figure 6C and Supplementary Figure 3).
The efficacy of AFP in determining the prognosis of HCC patients is poor [33]. Our data suggests that APEX1 expression correlates with response to sorafenib and anti-PD-1 therapies in HCC patients. APEX1 expression is significantly higher in patients that develop resistance to these two therapies, whereas AFP levels are similar in both drug-resistant and -sensitive HCC patients (Figure 7). This indicates that APEX1 expression can be used to evaluate the response to sorafenib and PD-1 immunotherapy. However, it should be noted that we used biopsy samples for our study. Other diagnostic methods like ultrasonography, Computed tomography (CT) and magnetic resonance imaging (MRI) are more convenient than biopsy for liver disease [34]. A recent report shows that serum APEX1 can be used as a biomarker for cholangiocarcinomas [35]. It is plausible that serum APEX1 levels may be elevated in HCC patients and may be a more sensitive diagnostic biomarker. However, this needs to be investigated in future studies.
We also demonstrate that APEX1 is a potential prognostic biomarker for HCC patients, even for those with early stage HCC (Figure 8). Moreover, high expression of APEX1 is prognostically significant for HCC patients that do not consume alcohol and belong to vascular invasion-negative and hepatitis virus infection-negative groups (Figure 9). Aberrant regulation of the DNA damage repair pathway plays an important role in oncogenesis [31]. Our study demonstrates that DNA damage repair pathway is significantly enriched in HCC tissues (Figure 10A–10C). APEX1 is a known regulator of DNA damage repair [30]. Our study shows a positive correlation between APEX1 and DNA damage repair signaling pathway (Figure 10D–10F). Hence, we postulate that APEX1 plays a role in DNA damage repair in the HCC tissues.
In conclusion, our study demonstrates that APEX1 is a novel diagnostic biomarker for HCC, particularly for early stage patients and patients with low AFP expression. Our study also demonstrates that APEX1 is a potential prognostic biomarker for HCC patients, including those that belong to non-alcohol consuming, vascular invasion-negative and hepatitis virus infection-negative groups. APEX1 expression correlates with the DNA damage repair signaling pathway in HCC tumor tissues. Overall, our study demonstrates that APEX1 is a potential diagnostic and prognostic biomarker for HCC.
Materials and Methods
Gene expression analysis
We analyzed APEX1 mRNA levels of the Roessler Liver 2 dataset in the Oncomine database by applying a threshold as a p-value < 1E-4, fold change ≥ 2.0, and the gene ranking in the top 10. The Roessler Liver statistics were based on the Affymetrix Human Genome HT U133A 2.0 microarray platform [36]. We analyzed APEX1 expression in HCC patients with different tumor grades using the Wurmbach Liver dataset that was based on the Affymetrix Human Genome U133 plus 2.0 microarray platform [37]. We also analyzed APEX1 and AFP mRNA expression in the HCC and control samples using the GSE10143 [38], GSE14520 [36], GSE22058 [39], GSE54236 [40], GSE36376 [41], GSE76427 [42], GSE25097 [43] and GSE63898 [44] datasets in the GEO database. We analyzed APEX1 and AFP mRNA levels in 46 sorafenib-resistant and 21 sorafenib-sensitive HCC patients from the GSE109211 dataset that were enrolled in the phase-3 STORM-trial to determine the safety and efficacy of sorafenib in HCC patients [45]. We also analyzed APEX1 and AFP mRNA levels in the HCC patients from the GSE125336 dataset who were resistant (n=3) or sensitive (n=3) to anti-PD-1 therapy [46]. Furthermore, we analyzed APEX1 expression using the UALCAN portal [47] in 371 primary HCC tissues from patients with different tumor grades and tumor stages and 50 adjacent normal liver tissues at the TCGA database.
APEX1 protein expression analysis
The APEX1 protein expression data from HCC and normal liver tissue samples at the TCGA database were obtained from The Human Protein Atlas (http://www.proteinatlas.org) database [48]. Immunohistochemical staining was performed using the anti-APEX1 antibody (Cat. No. sc-17774; Santa Cruz, USA).
Real-time quantitative PCR (qPCR)
We obtained tumor and adjacent normal liver tissues from 45 HCC patients that underwent surgical resection at the Fuzhou General Hospital. All the patients gave informed and written consent. The study was approved by the institutional review board of the Fuzhou General Hospital (IRB00006161). The samples were immediately stored at -80°C. Total RNA was extracted from the tumor and adjacent normal liver samples using Trizol, and diluted in DEPC-treated water. The cDNA synthesis was performed using SuperScript Reverse Transcriptase and quantified using the Nanodrop (ND-2000) by analyzing the A260/A280 ratio. Equal amounts of cDNA from different samples were subjected to qPCR using the HieffTM qPCR SYBR Green Master Mix (High Rox Plus). The APEX1 mRNA levels were normalized to GAPDH mRNA levels and the relative APEX1 expression was determined using the 2-ΔΔCT method. The specific qPCR primers used were : APEX1 (forward primer: 5′-TCTTGGAATGTG GATGGGCT-3′; reverse primer: 5′-ACTGTACCCTTC CTTGTCCG-3′); GAPDH (forward primer: 5′-AGGTCGGAGTCAACGGATTT-3′; reverse primer: 5′-ATC TCGCTCCTGGAAGATGG-3′). All primers were synthesized by Invitrogen, and the specificity of the primers was confirmed by performing the melting curve analysis as previously reported [49].
Receiver operating characteristic (ROC) curve analysis
The ROC curve analysis was performed using the Wilson/Brown method and 95% confidence interval for the HCC and adjacent normal liver tissues or liver cirrhosis tissues. The area under the ROC curve (AUC) value was estimated to determine the diagnostic significance of APEX1 expression in HCC patients compared to the control group.
Kaplan-Meier survival curve analysis
The 5-year overall survival (OS) rates were determined for HCC patients using Kaplan Meier database [50]. We divided 364 HCC patients into high- and low-APEX1 expression groups. The best cut-off value was determined from all possible cut-off values between the lower and the upper quartiles [50]. We also determined the false discovery rate and the corresponding p-value to ensure that the most optimal cutoff value was used. The follow-up time was set to 60 months following which the median survival time was determined for the HCC cohort. The patients that were still alive at the 60 month follow-up were censored.
Gene set enrichment analysis (GSEA)
We performed GSEA analysis of HCC and normal liver tissue samples from the TCGA database to determine the enriched genes. Moreover, the HCC samples were subdivided into high and low APEX1 expression groups based on the median APEX1 expression value, which were also analyzed with GSEA. The functional gene set file “c5. all. v7.0. symbols. gmt” was used to determine the enriched genes in HCC tissues. The p value for all the pathways was determined after 1000 permutations. Pathway enrichment was determined in a weighted manner. The pathways and genes with a P-value <0.05 and FDR <0.25 were considered significantly enriched.
Statistical analysis
The unpaired Student’s t-test was used to determine statistically significant differences in APEX1 expression between HCC tissues and adjacent normal liver or liver cirrhosis tissues. Paired Student’s t-test was used to analyze APEX1 expression data in HCC and adjacent normal liver tissues samples from the GSE76427 dataset and 45 fresh samples collected at our hospital. Kaplan-Meier survival curve analysis and log-rank test was used to determine the survival rate. Correlation analysis was performed by the Pearson method and the Pearson correlation coefficients were analyzed by the two-tailed t-test. ROC curves were analyzed by the Wilson/Brown method and 95% confidence intervals to determine differences between HCC and adjacent normal liver or liver cirrhosis tissues. The area under the ROC curve (AUC) value was used to determine the diagnostic significance of APEX1 and AFP expression in HCC tissues compared with the control group. All the results were analyzed using the GraphPad Prism version 8 software. A p-value below 0.05 was considered statistically significant.
Ethics approval
The study was approved by the institutional review board of Fuzhou General Hospital (IRB00006161).
Author Contributions
L.C and H.C conducted the experiments and the data analysis; H.L and Z.W designed the experiments; L.C and H.C wrote the manuscript and contributed equally to this work. Q.J revised and discussed the data. All the authors reviewed the results, read the final manuscript and gave consent.
Conflicts of Interest
All the authors declare that they have no conflicts of interest.
Funding
This work was supported by the Science and Technology Innovation Joint Fund Project of Fujian Province (Grant No. 2016Y9063).
References
- 1. Omata M, Cheng AL, Kokudo N, Kudo M, Lee JM, Jia J, Tateishi R, Han KH, Chawla YK, Shiina S, Jafri W, Payawal DA, Ohki T, et al. Asia-Pacific clinical practice guidelines on the management of hepatocellular carcinoma: a 2017 update. Hepatol Int. 2017; 11:317–70. https://doi.org/10.1007/s12072-017-9799-9 [PubMed]
- 2. Bertuccio P, Turati F, Carioli G, Rodriguez T, La Vecchia C, Malvezzi M, Negri E. Global trends and predictions in hepatocellular carcinoma mortality. J Hepatol. 2017; 67:302–09. https://doi.org/10.1016/j.jhep.2017.03.011 [PubMed]
- 3. Huo TI, Wu JC, Hsia CY, Chau GY, Lui WY, Huang YH, Lee PC, Chang FY, Lee SD, Hepatitis C. Hepatitis C virus infection is a risk factor for tumor recurrence after resection of small hepatocellular carcinomas. World J Surg. 2004; 28:787–91. https://doi.org/10.1007/s00268-004-7320-9 [PubMed]
- 4. Lin H, Ha NB, Ladzekpo D, Ahmed A, Ayoub W, Daugherty T, Lutchman GA, Garcia G, Cooper AD, Keeffe EB, Nguyen MH. Association of Hepatocellular Carcinoma (HCC) With Hepatitis B Virus (HBV) Versus Hepatitis C Virus (HCV) Infection Among Different Asian Subgroups. Gastroenterology. 2011; 140:S- 924–25. https://doi.org/10.1016/S0016-5085(11)63835-3
- 5. Said A, Ghufran A. Epidemic of non-alcoholic fatty liver disease and hepatocellular carcinoma. World J Clin Oncol. 2017; 8:429–36. https://doi.org/10.5306/wjco.v8.i6.429 [PubMed]
- 6. Chu YJ, Yang HI, Wu HC, Lee MH, Liu J, Wang LY, Lu SN, Jen CL, You SL, Santella RM, Chen CJ. Aflatoxin B1 exposure increases the risk of hepatocellular carcinoma associated with hepatitis C virus infection or alcohol consumption. Eur J Cancer. 2018; 94:37–46. https://doi.org/10.1016/j.ejca.2018.02.010 [PubMed]
- 7. Schütte K, Bornschein J, Kahl S, Seidensticker R, Arend J, Ricke J, Malfertheiner P. Delayed Diagnosis of HCC with Chronic Alcoholic Liver Disease. Liver Cancer. 2012; 1:257–66. https://doi.org/10.1159/000343840 [PubMed]
- 8. Triolo M, Della Corte C, Colombo M. Impact of HBV therapy on the incidence of hepatocellular carcinoma. Liver Int. 2014 (Suppl 1); 34:139–45. https://doi.org/10.1111/liv.12394 [PubMed]
- 9. Zhang S, Gao S, Zhao M, Liu Y, Bu Y, Jiang Q, Zhao Q, Ye L, Zhang X. Anti-HBV drugs suppress the growth of HBV-related hepatoma cells via down-regulation of hepatitis B virus X protein. Cancer Lett. 2017; 392:94–104. https://doi.org/10.1016/j.canlet.2017.02.003 [PubMed]
- 10. Asahina Y, Tsuchiya K, Tamaki N, Hirayama I, Tanaka T, Sato M, Yasui Y, Hosokawa T, Ueda K, Kuzuya T, Nakanishi H, Itakura J, Takahashi Y, et al. Effect of aging on risk for hepatocellular carcinoma in chronic hepatitis C virus infection. Hepatology. 2010; 52:518–27. https://doi.org/10.1002/hep.23691 [PubMed]
- 11. Stevens RG, Merkle EJ, Lustbader ED. Age and cohort effects in primary liver cancer. Int J Cancer. 1984; 33:453–58. https://doi.org/10.1002/ijc.2910330406 [PubMed]
- 12. Sunakozaka H, Kaneko S. Aging and hepatocarcinogenesis. Nihon Rinsho. 2016; 74:1548–53. [PubMed]
- 13. López-Otín C, Blasco MA, Partridge L, Serrano M, Kroemer G. The hallmarks of aging. Cell. 2013; 153:1194–217. https://doi.org/10.1016/j.cell.2013.05.039 [PubMed]
- 14. Forner A, Gilabert M, Bruix J, Raoul JL. Treatment of intermediate-stage hepatocellular carcinoma. Nat Rev Clin Oncol. 2014; 11:525–35. https://doi.org/10.1038/nrclinonc.2014.122 [PubMed]
- 15. Duan H, Zhao G, Xu B, Hu S, Li J. Maternal Serum PLGF, PAPPA, β-hCG and AFP Levels in Early Second Trimester as Predictors of Preeclampsia. Clin Lab. 2017; 63:921–25. https://doi.org/10.7754/Clin.Lab.2016.161103 [PubMed]
- 16. Gopal P, Yopp AC, Waljee AK, Chiang J, Nehra M, Kandunoori P, Singal AG. Factors that affect accuracy of α-fetoprotein test in detection of hepatocellular carcinoma in patients with cirrhosis. Clin Gastroenterol Hepatol. 2014; 12:870–77. https://doi.org/10.1016/j.cgh.2013.09.053 [PubMed]
- 17. Jing JS, Ye W, Jiang YK, Ma J, Zhu MQ, Ma JM, Zhou H, Yu LQ, Yang YF, Wang SC. The Value of GPC3 and GP73 in Clinical Diagnosis of Hepatocellular Carcinoma. Clin Lab. 2017; 63:1903–09. https://doi.org/10.7754/Clin.Lab.2017.170712 [PubMed]
- 18. Wongjarupong N, Negron-Ocasio GM, Chaiteerakij R, Addissie BD, Mohamed EA, Mara KC, Harmsen WS, Theobald JP, Peters BE, Balsanek JG, Ward MM, Giama NH, Venkatesh SK, et al. Model combining pre-transplant tumor biomarkers and tumor size shows more utility in predicting hepatocellular carcinoma recurrence and survival than the BALAD models. World J Gastroenterol. 2018; 24:1321–31. https://doi.org/10.3748/wjg.v24.i12.1321 [PubMed]
- 19. Ono K, Kokubu S, Hidaka H, Watanabe M, Nakazawa T, Saigenji K. Risk factors of delay in restoration of hepatic reserve capacity and local recurrence after radiofrequency ablation therapy for hepatocellular carcinoma (HCC). Hepatol Res. 2005; 31:172–77. https://doi.org/10.1016/j.hepres.2005.01.006 [PubMed]
- 20. Kim MH, Kim HB, Yoon SP, Lim SC, Cha MJ, Jeon YJ, Park SG, Chang IY, You HJ. Colon cancer progression is driven by APEX1-mediated upregulation of Jagged. J Clin Invest. 2013; 123:3211–30. https://doi.org/10.1172/JCI65521 [PubMed]
- 21. Pei DS, Jia PP, Luo JJ, Liu W, Strauss PR. AP endonuclease 1 (Apex1) influences brain development linking oxidative stress and DNA repair. Cell Death Dis. 2019; 10:348. https://doi.org/10.1038/s41419-019-1578-1 [PubMed]
- 22. Jayaraman L, Murthy KG, Zhu C, Curran T, Xanthoudakis S, Prives C. Identification of redox/repair protein Ref-1 as a potent activator of p53. Genes Dev. 1997; 11:558–70. https://doi.org/10.1101/gad.11.5.558 [PubMed]
- 23. Xanthoudakis S, Curran T. Identification and characterization of Ref-1, a nuclear protein that facilitates AP-1 DNA-binding activity. EMBO J. 1992; 11:653–65. https://doi.org/10.1002/j.1460-2075.1992.tb05097.x [PubMed]
- 24. Robertson KA, Bullock HA, Xu Y, Tritt R, Zimmerman E, Ulbright TM, Foster RS, Einhorn LH, Kelley MR. Altered expression of Ape1/ref-1 in germ cell tumors and overexpression in NT2 cells confers resistance to bleomycin and radiation. Cancer Res. 2001; 61:2220–25. [PubMed]
- 25. Mol CD, Izumi T, Mitra S, Tainer JA. Mitra S. and Tainer JA. DNA-bound structures and mutants reveal abasic DNA binding by APE1 and DNA repair coordination. Nature. 2000; 403:451–56. https://doi.org/10.1038/35000249 [PubMed]
- 26. Yang J, Yang D, Cogdell D, Du X, Li H, Pang Y, Sun Y, Hu L, Sun B, Trent J, Chen K, Zhang W. APEX1 gene amplification and its protein overexpression in osteosarcoma: correlation with recurrence, metastasis, and survival. Technol Cancer Res Treat. 2010; 9:161–69. https://doi.org/10.1177/153303461000900205 [PubMed]
- 27. Kim HB, Cho WJ, Choi NG, Kim SS, Park JH, Lee HJ, Park SG. Clinical implications of APEX1 and Jagged1 as chemoresistance factors in biliary tract cancer. Ann Surg Treat Res. 2017; 92:15–22. https://doi.org/10.4174/astr.2017.92.1.15 [PubMed]
- 28. Wang J, Wei H, Huang Y, Chen D, Zeng G, Lian Y, Huang Y. The combination of lonafarnib and sorafenib induces cyclin D1 degradation via ATG3-mediated autophagic flux in hepatocellular carcinoma cells. Aging (Albany NY). 2019; 11:5769–85. https://doi.org/10.18632/aging.102165 [PubMed]
- 29. Sevilya Z, Leitner-Dagan Y, Pinchev M, Kremer R, Elinger D, Lejbkowicz F, Rennert HS, Freedman LS, Rennert G, Paz-Elizur T, Livneh Z. Development of APE1 enzymatic DNA repair assays: low APE1 activity is associated with increase lung cancer risk. Carcinogenesis. 2015; 36:982–91. https://doi.org/10.1093/carcin/bgv082 [PubMed]
- 30. Kuasne H, Rodrigues IS, Losi-Guembarovski R, Reis MB, Fuganti PE, Gregório EP, Libos Junior F, Matsuda HM, Rodrigues MA, Kishima MO, Cólus IM. Base excision repair genes XRCC1 and APEX1 and the risk for prostate cancer. Mol Biol Rep. 2011; 38:1585–91. https://doi.org/10.1007/s11033-010-0267-z [PubMed]
- 31. Lieberman R, You M. Corrupting the DNA damage response: a critical role for Rad52 in tumor cell survival. Aging (Albany NY). 2017; 9:1647–59. https://doi.org/10.18632/aging.101263 [PubMed]
- 32. Siegel RL, Miller KD, Jemal A. Cancer statistics, 2019. CA Cancer J Clin. 2019; 69:7–34. https://doi.org/10.3322/caac.21551 [PubMed]
- 33. Zhou PY, Yang CP, Tang Z, Yi Y, Liu WR, Tian MX, Huang JL, Gan W, Jiang XF, Liu G, Wang H, Tao CY, Fang Y, et al. Daily decrease of post-operative alpha-fetoprotein by 9% discriminates prognosis of HCC: A multicenter retrospective study. Aging (Albany NY). 2019; 11:11111–23. https://doi.org/10.18632/aging.102513 [PubMed]
- 34. Xu M, Pan FS, Wang W, Zhang XE, Li XJ, Hong Y, Zhou LY, Xie XY, Lyu MD. The value of clinical and ultrasound features for the diagnosis of infantile hepatic hemangioma: comparison with contrast-enhanced CT/MRI. Clin Imaging. 2018; 51:311–17. https://doi.org/10.1016/j.clinimag.2018.06.017 [PubMed]
- 35. Tummanatsakun D, Proungvitaya T, Roytrakul S, Limpaiboon T, Wongkham S, Wongkham C, Silsirivanit A, Somintara O, Sangkhamanon S, Proungvitaya S. Serum Apurinic/Apyrimidinic Endodeoxyribonuclease 1 (APEX1) Level as a Potential Biomarker of Cholangiocarcinoma. Biomolecules. 2019; 9:413. https://doi.org/10.3390/biom9090413 [PubMed]
- 36. Roessler S, Jia HL, Budhu A, Forgues M, Ye QH, Lee JS, Thorgeirsson SS, Sun Z, Tang ZY, Qin LX, Wang XW. A unique metastasis gene signature enables prediction of tumor relapse in early-stage hepatocellular carcinoma patients. Cancer Res. 2010; 70:10202–12. https://doi.org/10.1158/0008-5472.CAN-10-2607 [PubMed]
- 37. Wurmbach E, Chen YB, Khitrov G, Zhang W, Roayaie S, Schwartz M, Fiel I, Thung S, Mazzaferro V, Bruix J, Bottinger E, Friedman S, Waxman S, Llovet JM. Genome-wide molecular profiles of HCV-induced dysplasia and hepatocellular carcinoma. Hepatology. 2007; 45:938–47. https://doi.org/10.1002/hep.21622 [PubMed]
- 38. Hoshida Y, Villanueva A, Kobayashi M, Peix J, Chiang DY, Camargo A, Gupta S, Moore J, Wrobel MJ, Lerner J, Reich M, Chan JA, Glickman JN, et al. Gene expression in fixed tissues and outcome in hepatocellular carcinoma. N Engl J Med. 2008; 359:1995–2004. https://doi.org/10.1056/NEJMoa0804525 [PubMed]
- 39. Burchard J, Zhang C, Liu AM, Poon RT, Lee NP, Wong KF, Sham PC, Lam BY, Ferguson MD, Tokiwa G, Smith R, Leeson B, Beard R, et al. microRNA-122 as a regulator of mitochondrial metabolic gene network in hepatocellular carcinoma. Mol Syst Biol. 2010; 6:402. https://doi.org/10.1038/msb.2010.58 [PubMed]
- 40. Villa E, Critelli R, Lei B, Marzocchi G, Cammà C, Giannelli G, Pontisso P, Cabibbo G, Enea M, Colopi S, Caporali C, Pollicino T, Milosa F, et al. Neoangiogenesis-related genes are hallmarks of fast-growing hepatocellular carcinomas and worst survival. Results from a prospective study. Gut. 2016; 65:861–69. https://doi.org/10.1136/gutjnl-2014-308483 [PubMed]
- 41. Lim HY, Sohn I, Deng S, Lee J, Jung SH, Mao M, Xu J, Wang K, Shi S, Joh JW, Choi YL, Park CK. Prediction of disease-free survival in hepatocellular carcinoma by gene expression profiling. Ann Surg Oncol. 2013; 20:3747–53. https://doi.org/10.1245/s10434-013-3070-y [PubMed]
- 42. Grinchuk OV, Yenamandra SP, Iyer R, Singh M, Lee HK, Lim KH, Chow PK, Kuznetsov VA. Tumor-adjacent tissue co-expression profile analysis reveals pro-oncogenic ribosomal gene signature for prognosis of resectable hepatocellular carcinoma. Mol Oncol. 2018; 12:89–113. https://doi.org/10.1002/1878-0261.12153 [PubMed]
- 43. Tung EK, Mak CK, Fatima S, Lo RC, Zhao H, Zhang C, Dai H, Poon RT, Yuen MF, Lai CL, Li JJ, Luk JM, Ng IO. Clinicopathological and prognostic significance of serum and tissue Dickkopf-1 levels in human hepatocellular carcinoma. Liver Int. 2011; 31:1494–504. https://doi.org/10.1111/j.1478-3231.2011.02597.x [PubMed]
- 44. Villanueva A, Portela A, Sayols S, Battiston C, Hoshida Y, Méndez-González J, Imbeaud S, Letouzé E, Hernandez-Gea V, Cornella H, Pinyol R, Solé M, Fuster J, et al, and HEPTROMIC Consortium. DNA methylation-based prognosis and epidrivers in hepatocellular carcinoma. Hepatology. 2015; 61:1945–56. https://doi.org/10.1002/hep.27732 [PubMed]
- 45. Pinyol R, Montal R, Bassaganyas L, Sia D, Takayama T, Chau GY, Mazzaferro V, Roayaie S, Lee HC, Kokudo N, Zhang Z, Torrecilla S, Moeini A, et al. Molecular predictors of prevention of recurrence in HCC with sorafenib as adjuvant treatment and prognostic factors in the phase 3 STORM trial. Gut. 2019; 68:1065–75. https://doi.org/10.1136/gutjnl-2018-316408 [PubMed]
- 46. Ruiz de Galarreta M, Bresnahan E, Molina-Sánchez P, Lindblad KE, Maier B, Sia D, Puigvehi M, Miguela V, Casanova-Acebes M, Dhainaut M, Villacorta-Martin C, Singhi AD, Moghe A, et al. β-Catenin Activation Promotes Immune Escape and Resistance to Anti-PD-1 Therapy in Hepatocellular Carcinoma. Cancer Discov. 2019; 9:1124–41. https://doi.org/10.1158/2159-8290.CD-19-0074 [PubMed]
- 47. Chandrashekar DS, Bashel B, Balasubramanya SA, Creighton CJ, Ponce-Rodriguez I, Chakravarthi BV, Varambally S. UALCAN: A Portal for Facilitating Tumor Subgroup Gene Expression and Survival Analyses. Neoplasia. 2017; 19:649–58. https://doi.org/10.1016/j.neo.2017.05.002 [PubMed]
- 48. Uhlén M, Fagerberg L, Hallström BM, Lindskog C, Oksvold P, Mardinoglu A, Sivertsson Å, Kampf C, Sjöstedt E, Asplund A, Olsson I, Edlund K, Lundberg E, et al. Proteomics. Tissue-based map of the human proteome. Science. 2015; 347:1260419. https://doi.org/10.1126/science.1260419 [PubMed]
- 49. Cheng H, Wu Z, Wu C, Wang X, Liow SS, Li Z, Wu YL. Overcoming STC2 mediated drug resistance through drug and gene co-delivery by PHB-PDMAEMA cationic polyester in liver cancer cells. Mater Sci Eng C Mater Biol Appl. 2018; 83:210–17. https://doi.org/10.1016/j.msec.2017.08.075 [PubMed]
- 50. Nagy Á, Lánczky A, Menyhárt O, Győrffy B. Validation of miRNA prognostic power in hepatocellular carcinoma using expression data of independent datasets. Sci Rep. 2018; 8:9227. https://doi.org/10.1038/s41598-018-27521-y [PubMed]