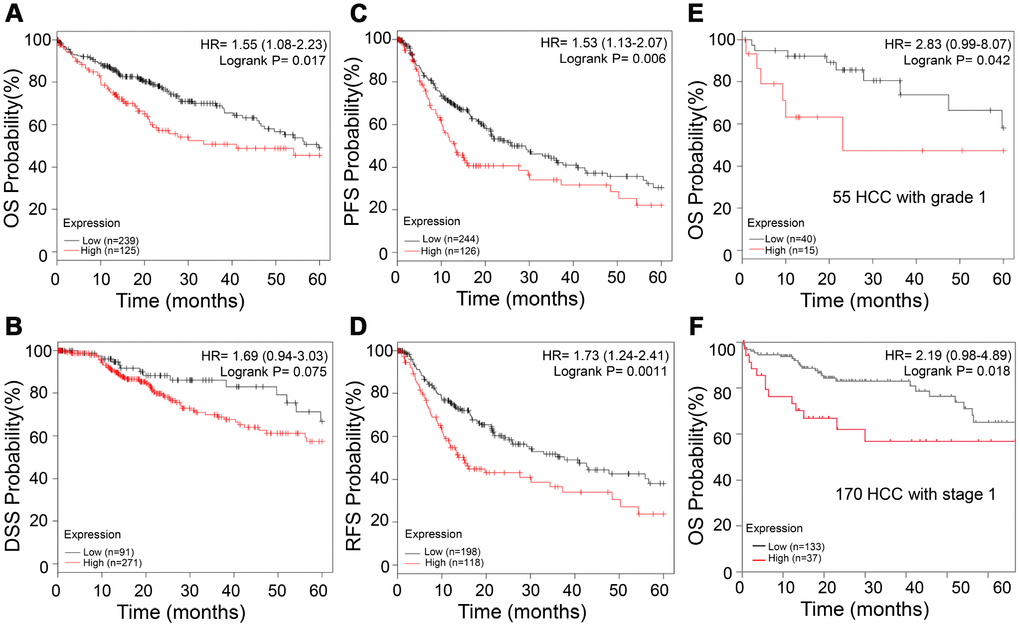
Figure 8.High APEX1 expression predicts poor prognosis in HCC patients, including those with grade 1 tumors. (A–D) Kaplan-Meier survival curve analysis shows OS, DSS, PFS and RFS rates of high and low APEX1 expressing HCC patients, respectively. (E) Kaplan-Meier survival curve analysis of 5-year OS probability of 55 tumor grade 1 HCC patients is shown. (F) Kaplan-Meier survival curve analysis of the 5-year OS rate of HCC patients with stage 1 cancer is shown. The hazard ratio (HR) was calculated based on the Cox Proportional-Hazards model.