


Introduction
Frailty is a clinical syndrome that is characterized by reduced responsiveness to stressors due to physiological decline in multiple organs and is associated with poor health outcomes including falls, incident disability, hospitalization, and mortality [1–4]. Frailty is usually studied in the elderly, yet it affects younger individuals as well, 45 – 64 years old [5, 6]. With the number of Americans aged 65 and older projected to double by 2060 [7] frailty consists of a condition with important implications in the quality of life of older individuals and overall healthcare management.
Despite that this condition is being recognized as a distinct clinical entity, our understanding of its pathogenetic mechanism remains limited. Comprehensive molecular studies at the whole transcriptome level, were only recently initiated underscoring the role of a proinflammatory response in the development of this condition [8, 9]. Despite this progress, additional research is imperative, both at the level of generation of new primary experimental data and at the level of application of novel analytical approaches, facilitating extraction of biologically relevant and clinically meaningful information.
Conventionally, gene expression analyses aim to identify differentially expressed genes in predefined experimental groups. In such analyses, the magnitude of over- or under-expression is considered indicative for the impact of the corresponding genes in the pathology of interest. Such strategies are frequently limited by the variation in expression between specimens which is particularly relevant when genetically diverse specimens are analyzed [10, 11]. To overcome these limitations, we have applied an alternative strategy in which samples were evaluated by comparing the correlation of expression of specific genes with the whole transcriptome, in different experimental groups [12, 13]. Coupling such analysis with publicly available gene ontology platforms [14–17] could identify changes in the transcriptome that would not be appreciated by conventional differential expression analysis. Furthermore, it could provide hints regarding the biological implications of such changes. For example, by focusing on the unfolded protein response (UPR) we were able to unveil specific functions of UPR branches and how they change during pathology [12, 13].
To apply this strategy to frailty we have reanalyzed publicly available data extracted from a comprehensive study that was performed in individuals that developed this syndrome [9].
Results and Discussion
By arbitrarily selecting at least 70 reads as the cut-off in the NOR group we identified 178 highly expressed transcripts. This limit was set for the convenience of the calculations and in theory could be increased indefinitely, provided that appropriate tools for computational analysis are developed. For the same reason specimens were assigned to only 2 groups, the NOR and the FRA groups, however additional sub-groups could be utilized, if a higher number of samples were available.
Initially, we asked how the expression among these 178 highly expressed genes is correlated between the NOR and FRA groups. To that end we calculated the correlation coefficient R (Pearson’s) for all pairwise comparisons between these 178 highly expressed genes, generating a heatmap illustrating the correlation in their expression. As shown in Figure 1, the vast majority of the genes subjected to this type of analysis was highly correlated with each other and the correlation increased in the FRA group. It is generally accepted that correlated expression or co-expression implies coregulation, by the same or similar transcription factors that define transcriptional networks [18–20]. According to the results of Figure 1, this coregulation becomes more intense during frailty. It is plausible that the lower degree of correlation in the control group (NOR) is indicative of the margins of expression at which physiological function for these genes can be attained. This flexibility is abolished in frailty because activation of signaling pathways under these conditions dictates more robust expression profiles. In line with this notion we recently reported that correlation was more intense in primary fibroblasts of outbred rodents, under endoplasmic reticulum stress as compared to unstressed cells in culture [21].
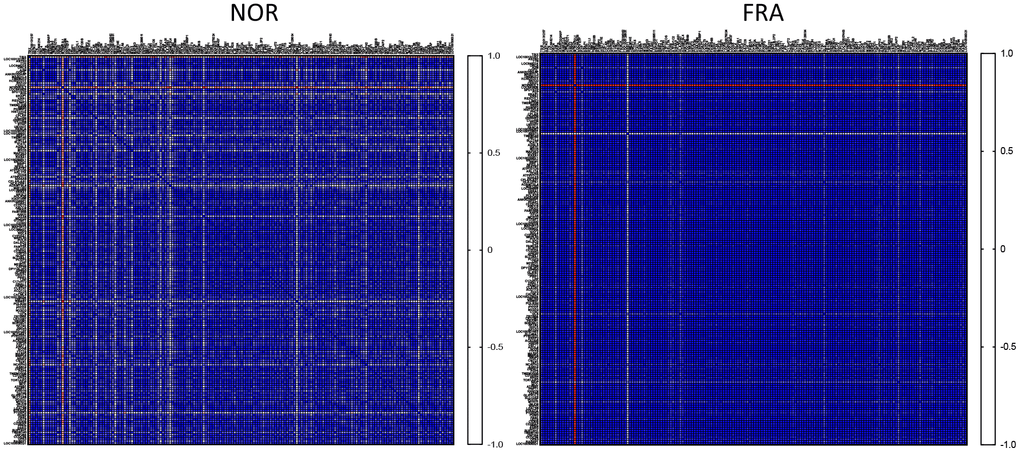
Figure 1. Heatmaps of the correlation coefficients (R) among all pairwise comparisons between the most highly expressed genes in the NOR group.
Subsequently, we estimated how the whole transcriptome is correlated with these 178 genes and compared how this correlation changes during frailty. To that end, a composite correlation (Pc) was calculated for each gene which corresponds to the correlation of the R values this gene has, with the whole transcriptome between the NOR and FRA groups. Then, we ranked these genes according to Pc (Supplementary Table 1). Therefore, high Pc indicates retention of coordination between the NOR and FRA groups while low Pc is suggestive for the loss of coordination, when the pathology emerges. The top 3 genes with lowest Pc were TSIX, BEST1 and ADAMTSL4 (-0.069, 0.074 and 0.135 respectively) while the top 3 with highest Pc were PNPT1, ORAI2 and MAP3K13 (0.462, 0.462 and 0.466 respectively) (Figure 2). These genes, such as TSIX, BEST1 and ADAMTSL4, are the ones that according to our hypotheses are being affected by (or affecting) frailty, or being affected minimally by this syndrome, such as PNPT1, ORAI2 and MAP3K13. TSIX encodes for an antisense RNA that is involved in the regulation of XIST and therefore in X chromosome inactivation [22, 23]. BEST1 encodes for a member of the bestrophin family of proteins that are calcium-activated chloride channels and have been associated with retinal disease [24, 25]. ADAMTSL4 participates in the formation of microfibrils and is associated with the development of ectopia lentis, an eye disorder [26].
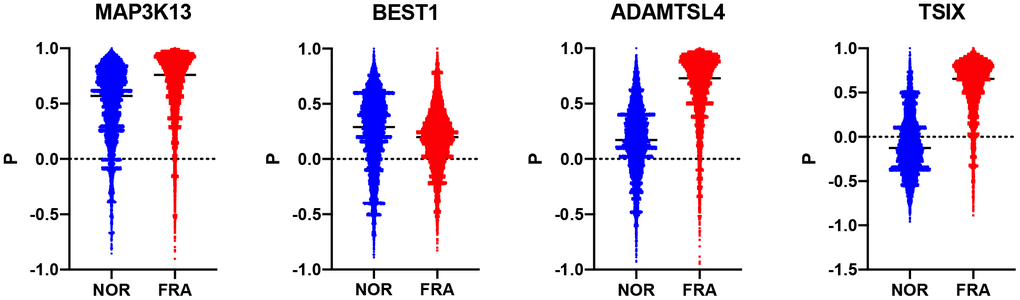
Figure 2. Violin plots showing the R values between each of TSIX, BEST1, ADAMTSL4 and MAP3K13 in the NOR and the FRA groups.
In order to better understand the relevance of loss of coordination in TSIX, BEST1 and ADAMTSL4 we ranked the transcriptome according to its coordination with these 3 genes, Then, by using R=0.5 as a cut-off, we subjected the corresponding transcriptome to GO analysis [14, 15]. This analysis indicated that for the same gene, several functions were retained between the NOR and FRA groups, but several novel functions were also acquired (Figure 3 and Supplementary Table 2). Among the latter, the most prominent ones included functions related to immune system processes and metabolic processes (Table 1).
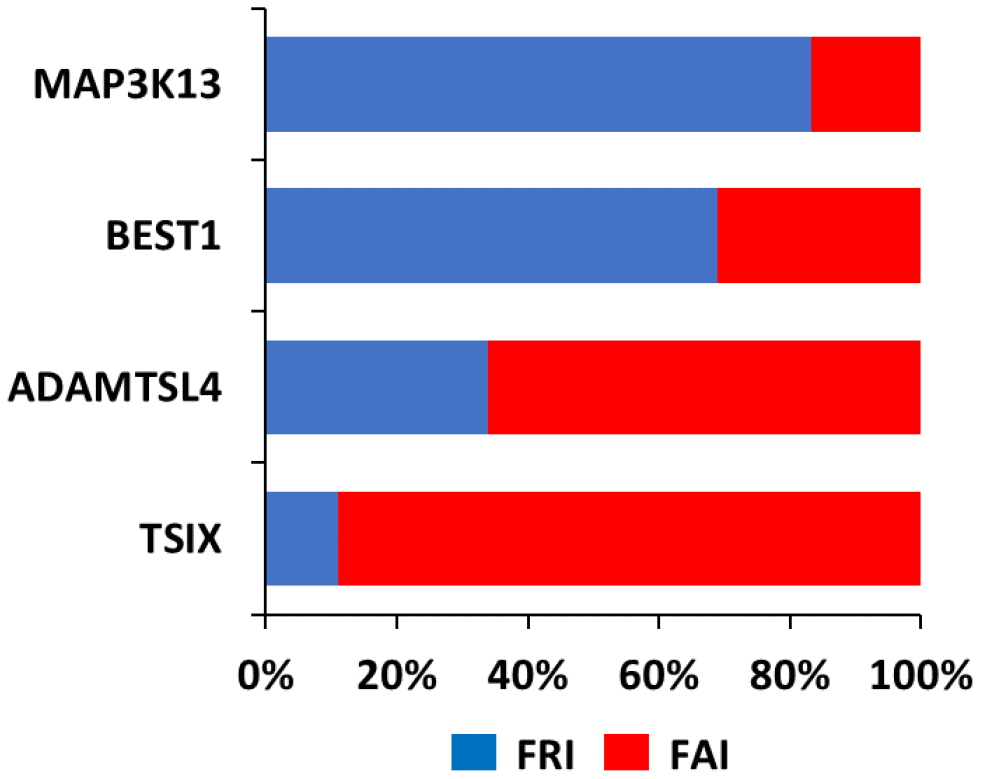
Figure 3. Function Retention Index (FRI) and Function Acquisition Index (FAI) for each of TSIX, BEST1, ADAMTSL4 and MAP3K13. FRI reflects the ratio of the functions in the NOR group that were retained in the FRA group (FRI=common functions in both groups/all functions in FRA group). FAI reflects the ratio of the novel functions in the FRA group that were absent from the NOR group (FAI=new functions in FRA group/all functions in FRA group).
Table 1. Biological processes according to GO that were common for TSIX, BEST1 and ADAMTSL4 in the FRA group.
| ADAMTSL4 in FRA, BEST1 in FRA, TSIX in FRA | 103 | immune system process (GO:0002376) regulation of cellular macromolecule biosynthetic process (GO:2000112) organic cyclic compound biosynthetic process (GO:1901362) cellular macromolecule metabolic process (GO:0044260) negative regulation of biosynthetic process (GO:0009890) cellular biosynthetic process (GO:0044249) negative regulation of RNA metabolic process (GO:0051253) cellular process (GO:0009987) macromolecule metabolic process (GO:0043170) positive regulation of macromolecule metabolic process (GO:0010604) negative regulation of RNA biosynthetic process (GO:1902679) negative regulation of transcription, DNA-templated (GO:0045892) detection of chemical stimulus involved in sensory perception of smell (GO:0050911) cellular component organization or biogenesis (GO:0071840) response to organic substance (GO:0010033) intracellular signal transduction (GO:0035556) detection of chemical stimulus involved in sensory perception (GO:0050907) nitrogen compound metabolic process (GO:0006807) regulation of RNA biosynthetic process (GO:2001141) positive regulation of cellular process (GO:0048522) cellular response to stress (GO:0033554) nucleic acid-templated transcription (GO:0097659) positive regulation of cellular metabolic process (GO:0031325) biological regulation (GO:0065007) positive regulation of transcription, DNA-templated (GO:0045893) positive regulation of nucleic acid-templated transcription (GO:1903508) RNA metabolic process (GO:0016070) biological process (GO:0008150) regulation of multicellular organismal process (GO:0051239) cellular aromatic compound metabolic process (GO:0006725) regulation of cellular process (GO:0050794) Unclassified (UNCLASSIFIED) organic cyclic compound metabolic process (GO:1901360) gene expression (GO:0010467) positive regulation of cellular biosynthetic process (GO:0031328) detection of chemical stimulus (GO:0009593) negative regulation of cellular macromolecule biosynthetic process (GO:2000113) cellular macromolecule biosynthetic process (GO:0034645) primary metabolic process (GO:0044238) biosynthetic process (GO:0009058) organic substance biosynthetic process (GO:1901576) cellular nitrogen compound metabolic process (GO:0034641) regulation of developmental process (GO:0050793) positive regulation of gene expression (GO:0010628) cellular response to stimulus (GO:0051716) regulation of macromolecule metabolic process (GO:0060255) positive regulation of protein metabolic process (GO:0051247) negative regulation of gene expression (GO:0010629) regulation of cellular metabolic process (GO:0031323) positive regulation of biological process (GO:0048518) positive regulation of nitrogen compound metabolic process (GO:0051173) metabolic process (GO:0008152) regulation of nitrogen compound metabolic process (GO:0051171) positive regulation of RNA biosynthetic process (GO:1902680) negative regulation of cellular process (GO:0048523) negative regulation of biological process (GO:0048519) apoptotic process (GO:0006915) negative regulation of macromolecule biosynthetic process (GO:0010558) macromolecule biosynthetic process (GO:0009059) localization (GO:0051179) regulation of transcription, DNA-templated (GO:0006355) nucleobase-containing compound metabolic process (GO:0006139) sensory perception of chemical stimulus (GO:0007606) hematopoietic or lymphoid organ development (GO:0048534) regulation of catalytic activity (GO:0050790) regulation of response to stress (GO:0080134) small molecule metabolic process (GO:0044281) negative regulation of nucleic acid-templated transcription (GO:1903507) detection of stimulus involved in sensory perception (GO:0050906) RNA biosynthetic process (GO:0032774) sensory perception of smell (GO:0007608) cellular component assembly (GO:0022607) positive regulation of macromolecule biosynthetic process (GO:0010557) cellular component organization (GO:0016043) regulation of cellular biosynthetic process (GO:0031326) immune system development (GO:0002520) positive regulation of metabolic process (GO:0009893) detection of stimulus (GO:0051606) regulation of metabolic process (GO:0019222) developmental process (GO:0032502) positive regulation of molecular function (GO:0044093) nucleic acid metabolic process (GO:0090304) leukocyte activation (GO:0045321) heterocycle biosynthetic process (GO:0018130) transcription, DNA- templated (GO:0006351) regulation of macromolecule biosynthetic process (GO:0010556) regulation of biological process (GO:0050789) regulation of gene expression (GO:0010468) regulation of nucleic acid-templated transcription (GO:1903506) cell activation (GO:0001775) regulation of nucleobase-containing compound metabolic process (GO:0019219) regulation of RNA metabolic process (GO:0051252) positive regulation of RNA metabolic process (GO:0051254) regulation of biosynthetic process (GO:0009889) cellular metabolic process (GO:0044237) heterocycle metabolic process (GO:0046483) sensory perception (GO:0007600) regulation of immune system process (GO:0002682) positive regulation of biosynthetic process (GO:0009891) regulation of primary metabolic process (GO:0080090) organic substance metabolic process (GO:0071704) regulation of molecular function (GO:0065009) positive regulation of nucleobase-containing compound metabolic process (GO:0045935) |
These findings confirm and extend previous findings on the role of immune system in the pathogenesis of frailty and also identify the significance of metabolic deregulation or reprogramming in the development of this syndrome. In addition, they provide novel gene targets that may play a role in the development of this condition. It is conceivable that refinement of the proposed strategy, by including larger datasets and deeper and more expanded roster of genes to initiate the coregulation assessment, will be applicable to various conditions and be leveraged - as opposed to be restricted - by the high variation, when genetically diverse specimens are analyzed.
Materials and Methods
Data used were retrieved from GEO (Accession number: GSE129534). Specimens’ characteristics are described in detail in the original study [9]. Participants of the study were from the Healthy Aging in Neighborhoods of Diversity across the Life Span (HANDLS) study of the National Institute on Aging Intramural Research Program (NIA IRP), National Institutes of Health. In our analysis we assigned the specimens in 2 groups, with (FRA) or without (NOR) frailty, consistently with the classification of the original study [9]. Each group consisted of 8 samples, each of which included 4 whites and 4 African Americans, both males (50%) and females (50%). All individuals were 45-49 years old (Mean ± sd = 48.09 ±1.21 and 47.85 ± 1.84 for the NOR and FRA groups respectively). RNA-seq was performed in peripheral blood mononuclear cells [9].
The experimental outline we applied is shown in Figure 4. Initially we identified the transcripts exhibiting relatively high abundance. Arbitrarily we selected genes that displayed at least 70 reads in the NOR group (resulting in n=178 highly expressed genes). Subsequently we calculated the correlation (R, Pearson’s) for these 178 genes with the whole transcriptome, independently in the NOR and the FRA groups. In order to test for which of these genes correlation with the transcriptome changes in the different groups, we calculated the Pc from the R values calculated above. This transformation assigned a unique Pc value to each of these genes which reflects the degree by which coordination with the whole transcriptome changes in the 2 groups for the corresponding genes of interest. Then, the genes were sorted according to Pc, and for the ones that exhibited the lowest Pc (3 genes in this study) their correlation ® with the whole transcriptome, in the NOR and the FRA groups was calculated. These R values were used to sort the transcriptome and supply it to a GO platform for further analysis. As a cut-off we arbitrarily chose genes with R>0.5. Finally, predicted functions were compared between the NOR and the FRA groups for the genes selected.
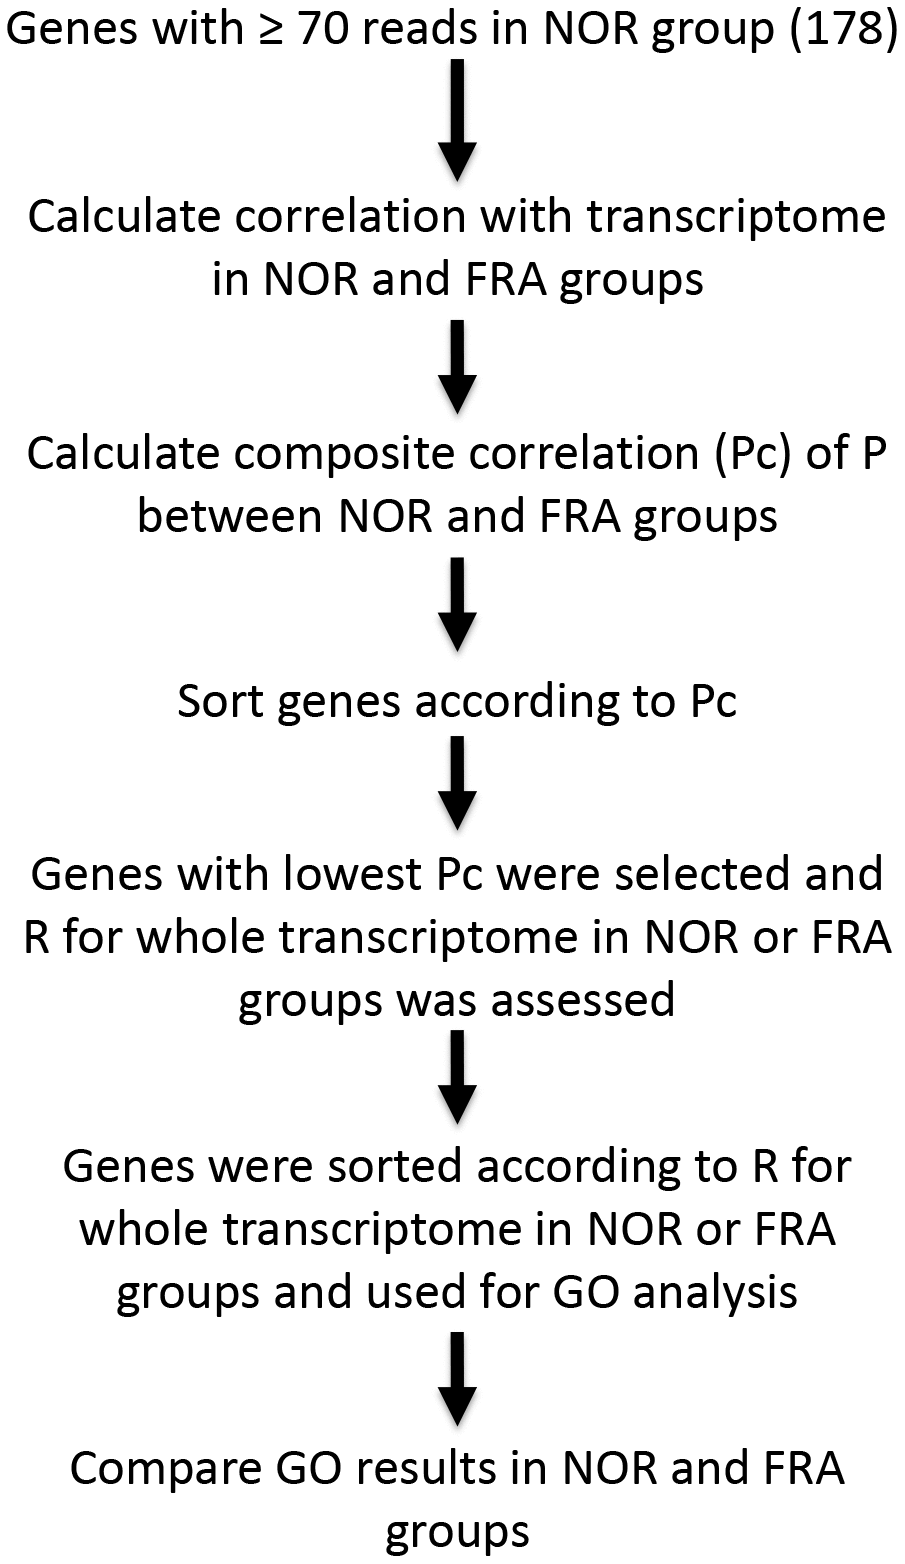
Figure 4. Outline of the coordination analysis applied in the present study.
Conflicts of Interest
The authors declare that they have no conflicts of interests.
Funding
This study was supported by NSF (Award Number: 1736150).
References
- 1. Xue QL. The frailty syndrome: definition and natural history. Clin Geriatr Med. 2011; 27:1–15. https://doi.org/10.1016/j.cger.2010.08.009 [PubMed]
- 2. Bandeen-Roche K, Xue QL, Ferrucci L, Walston J, Guralnik JM, Chaves P, Zeger SL, Fried LP. Phenotype of frailty: characterization in the women’s health and aging studies. J Gerontol A Biol Sci Med Sci. 2006; 61:262–66. https://doi.org/10.1093/gerona/61.3.262 [PubMed]
- 3. Fried LP, Tangen CM, Walston J, Newman AB, Hirsch C, Gottdiener J, Seeman T, Tracy R, Kop WJ, Burke G, McBurnie MA, and Cardiovascular Health Study Collaborative Research Group. Frailty in older adults: evidence for a phenotype. J Gerontol A Biol Sci Med Sci. 2001; 56:M146–56. https://doi.org/10.1093/gerona/56.3.M146 [PubMed]
- 4. Graham JE, Snih SA, Berges IM, Ray LA, Markides KS, Ottenbacher KJ. Frailty and 10-year mortality in community-living Mexican American older adults. Gerontology. 2009; 55:644–51. https://doi.org/10.1159/000235653 [PubMed]
- 5. Griffin FR, Mode NA, Ejiogu N, Zonderman AB, Evans MK. Frailty in a racially and socioeconomically diverse sample of middle-aged Americans in Baltimore. PLoS One. 2018; 13:e0195637. https://doi.org/10.1371/journal.pone.0195637 [PubMed]
- 6. Malmstrom TK, Miller DK, Herning MM, Morley JE. Low appendicular skeletal muscle mass (ASM) with limited mobility and poor health outcomes in middle-aged African Americans. J Cachexia Sarcopenia Muscle. 2013; 4:179–86. https://doi.org/10.1007/s13539-013-0106-x [PubMed]
- 7. Mather M, Jacobsen LA, Pollard KM. Aging in the United States. Popul Bull. 2015; 70:1–18.
- 8. Jylhävä J, Raitanen J, Marttila S, Hervonen A, Jylhä M, Hurme M. Identification of a prognostic signature for old-age mortality by integrating genome-wide transcriptomic data with the conventional predictors: the Vitality 90+ Study. BMC Med Genomics. 2014; 7:54. https://doi.org/10.1186/1755-8794-7-54 [PubMed]
- 9. Prince CS, Noren Hooten N, Mode NA, Zhang Y, Ejiogu N, Becker KG, Zonderman AB, Evans MK. Frailty in middle age is associated with frailty status and race-specific changes to the transcriptome. Aging (Albany NY). 2019; 11:5518–34. https://doi.org/10.18632/aging.102135 [PubMed]
- 10. Costa-Silva J, Domingues D, Lopes FM. RNA-Seq differential expression analysis: An extended review and a software tool. PLoS One. 2017; 12:e0190152. https://doi.org/10.1371/journal.pone.0190152 [PubMed]
- 11. Wang T, Li B, Nelson CE, Nabavi S. Comparative analysis of differential gene expression analysis tools for single-cell RNA sequencing data. BMC Bioinformatics. 2019; 20:40. https://doi.org/10.1186/s12859-019-2599-6 [PubMed]
- 12. Havighorst A, Kiaris H, Chatzistamou I. SUN-106 Loss of Coordination in the Expression of Hepatic Lipase and Endoplasmic Reticulum Stress Genes in Steatosis. J Endocr Soc. 2019 (Suppl 1); 3:SUN-106. https://doi.org/10.1210/js.2019-SUN-106
- 13. Zhang Y, Lucius MD, Altomare D, Havighorst A, Farmaki E, Chatzistamou I, Shtutman M, Kiaris H. Coordination Analysis of Gene Expression Points to the Relative Impact of Different Regulators During Endoplasmic Reticulum Stress. DNA Cell Biol. 2019; 38:969–81. https://doi.org/10.1089/dna.2019.4910 [PubMed]
- 14. Ashburner M, Ball CA, Blake JA, Botstein D, Butler H, Cherry JM, Davis AP, Dolinski K, Dwight SS, Eppig JT, Harris MA, Hill DP, Issel-Tarver L, et al, and The Gene Ontology Consortium. Gene ontology: tool for the unification of biology. Nat Genet. 2000; 25:25–29. https://doi.org/10.1038/75556 [PubMed]
- 15. Carbon S, Ireland A, Mungall CJ, Shu S, Marshall B, Lewis S, and AmiGO Hub, and Web Presence Working Group. AmiGO: online access to ontology and annotation data. Bioinformatics. 2009; 25:288–89. https://doi.org/10.1093/bioinformatics/btn615 [PubMed]
- 16. Eden E, Navon R, Steinfeld I, Lipson D, Yakhini Z. GOrilla: a tool for discovery and visualization of enriched GO terms in ranked gene lists. BMC Bioinformatics. 2009; 10:48. https://doi.org/10.1186/1471-2105-10-48 [PubMed]
- 17. Maere S, Heymans K, Kuiper M. BiNGO: a Cytoscape plugin to assess overrepresentation of gene ontology categories in biological networks. Bioinformatics. 2005; 21:3448–49. https://doi.org/10.1093/bioinformatics/bti551 [PubMed]
- 18. Allocco DJ, Kohane IS, Butte AJ. Quantifying the relationship between co-expression, co-regulation and gene function. BMC Bioinformatics. 2004; 5:18. https://doi.org/10.1186/1471-2105-5-18 [PubMed]
- 19. Tavazoie S, Hughes JD, Campbell MJ, Cho RJ, Church GM. Systematic determination of genetic network architecture. Nat Genet. 1999; 22:281–85. https://doi.org/10.1038/10343 [PubMed]
- 20. van Dam S, Võsa U, van der Graaf A, Franke L, de Magalhães JP. Gene co-expression analysis for functional classification and gene-disease predictions. Brief Bioinform. 2018; 19:575–92. https://doi.org/10.1093/bib/bbw139 [PubMed]
- 21. Havighorst A, Zhang Y, Farmaki E, Kaza V, Chatzistamou I, Kiaris H. Differential regulation of the unfolded protein response in outbred deer mice and susceptibility to metabolic disease. Dis Model Mech. 2019; 12:dmm037242. https://doi.org/10.1242/dmm.037242 [PubMed]
- 22. Lee JT, Davidow LS, Warshawsky D. Tsix, a gene antisense to Xist at the X-inactivation centre. Nat Genet. 1999; 21:400–04. https://doi.org/10.1038/7734 [PubMed]
- 23. Stavropoulos N, Lu N, Lee JT. A functional role for Tsix transcription in blocking Xist RNA accumulation but not in X-chromosome choice. Proc Natl Acad Sci USA. 2001; 98:10232–37. https://doi.org/10.1073/pnas.171243598 [PubMed]
- 24. Johnson AA, Guziewicz KE, Lee CJ, Kalathur RC, Pulido JS, Marmorstein LY, Marmorstein AD. Bestrophin 1 and retinal disease. Prog Retin Eye Res. 2017; 58:45–69. https://doi.org/10.1016/j.preteyeres.2017.01.006 [PubMed]
- 25. Vaisey G, Long SB. An allosteric mechanism of inactivation in the calcium-dependent chloride channel BEST1. J Gen Physiol. 2018; 150:1484–97. https://doi.org/10.1085/jgp.201812190 [PubMed]
- 26. Neuhann TM, Stegerer A, Riess A, Blair E, Martin T, Wieser S, Kläs R, Bouman A, Kuechler A, Rittinger O. ADAMTSL4-associated isolated ectopia lentis: further patients, novel mutations and a detailed phenotype description. Am J Med Genet A. 2015; 167A:2376–81. https://doi.org/10.1002/ajmg.a.37157 [PubMed]