Submit an Article
Navigate
Home
Editorial Board
Editorial Policies
Current Volume
Archive
Scientific Integrity
Publication Ethics Statements
Interviews with Outstanding Authors
Newsroom
Sponsored Conferences
Podcast
Contact
Special Collections
Submit an Article
Online ISSN: 1945-4589
Research Paper
|
Volume 12, Issue 5
|
pp. 4222–4229
Identification of frailty-associated genes by coordination analysis of gene expression
Back to article
Figure 2
(2 of 4)
−
100%
+
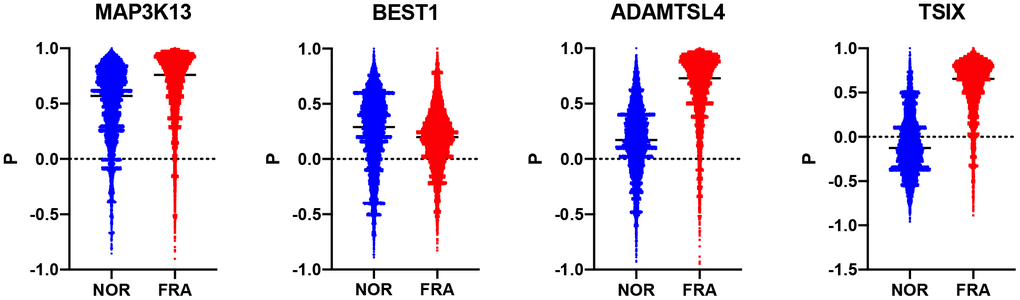
Figure 2.
Violin plots showing the R values between each of TSIX, BEST1, ADAMTSL4 and MAP3K13 in the NOR and the FRA groups.