


Introduction
Esophageal cancer is the 8th most common tumor and the 6th cause of tumor associated death in the world [1]. The 5-year survival rate of this disorder is only 15–25%, owing to the aggressive nature of the disease and resistance to therapy. Approximately 50% of esophageal cancer patients worldwide occur in China. Patients typically present with progressive dysphagia when diagnosed [2]. Esophageal cancer can arise in the upper (<10% of cases), middle (>50%), or lower (>20%) segment of the esophagus [2, 3]. Patients in high-risk areas in China therefore undergo routine endoscopic screening, which is useful for early diagnosis and effective treatment of esophageal cancer.
Surgical or endoscopic resection and chemoradiotherapy are the standard treatments for esophageal cancer, although the therapeutic strategy varies according to stage [4, 5]. Many patients who present with resectable esophageal cancer ultimately develop local recurrence and metastasis [6]. These patients are primarily managed with chemotherapy (e.g. fluoropyrimidine/platinum) [7]. Additional chemotherapy methods include capecitabine, S-1, infusional 5-fluorouracil (5-FU) and other 5-FU pro-drugs, and oxaliplatin or cisplatin [7]. The response rates to 5-FU in combination with cisplatin were reported to be 30–40% and 40–50% for esophageal adenocarcinoma and esophageal squamous cell carcinoma (ESCC), respectively [6]. In total, improvements of chemotherapy were disappointing over the last 3 decades, and current efforts should pay attention to targeted therapies and immunotherapy. Several new drugs such as ramucirumab, capecitabine, oxaliplatin, and everolimus have also demonstrated therapeutic efficacy in esophageal cancer [6, 8–12]. However, some patients have developed resistance to these therapies, and the underlying mechanisms were complex and poorly understood. Drug resistance may in part be mediated by the long non-coding RNA CCAT1 [13]. Additionally, microRNA-10b and CDKN3 have been shown to contribute to cisplatin resistance [14, 15].
Esophageal cancer contains 2 primary pathological subtypes: adenocarcinoma and ESCC. Similar genetic and environmental risk factors for esophageal adenocarcinoma and ESCC have been identified including gender, race, obesity, nutrition, smoking, and alcohol consumption [1]. Interestingly, polymorphisms in the programmed death-1 (PD-1) gene (located in chromosome 2q37.3) have been associated with esophageal cancer risk and prognosis [16–18].
PD-1, a 50–55 kDa type I transmembrane glycoprotein, was first isolated from activated T cells [19, 20]. It consists of a transmembrane domain, extracellular domain, and intracellular region. It is reported to express on the surface of some immune cells including activated monocytes, T cells, natural killer cells, B cells, and NK T cells [21, 22]. PD-1 negatively regulated the regulatory and effector T cells. It plays a critical role in suppressing the immune response to promote self-tolerance [23]. However, by suppressing the immune response, it can contribute to cancer progression. PD-1 gene expression was associated with T cell activation-induced apoptosis in murine T cell hybridomas [24]. Additionally, persistent PD-1 expression in tumor-infiltrating lymphocytes was related with poor prognosis and cancer recurrence [25]. Two FDA-approved monoclonal antibodies targeting PD-1 including pembrolizumab and nivolumab have demonstrated efficacy for several cancer treatment [26, 27]. Anti-PD-1 therapy promoted regression of advanced tumors and improved survival, particularly among subsets of patients with solid tumors, and demonstrated durable effects and tolerable toxicities [27]. Biomarkers including density of tumor infiltrating lymphocyte, mismatch-repair deficiency, PD-L1 expression, and tumor mutational burden, predicted treatment effect of anti-PD-1 therapy [26].
PD-1 gene polymorphisms were associated with the risk of various cancers [1, 28–30]. Beyond foregoing disorders, PD-1 is overexpressed in different cancers, including esophageal cancer. For example, the rs2227981, rs2227982, and rs3608432 polymorphisms were related to lung adenocarcinoma risk and prognosis [31]. However, no associations were observed in basal cell carcinoma [32]. The PD-1.5 C/T polymorphism increased the risk of cervical [33], lung [34], gastric [35], colon [36], thyroid cancers [37]. The rs2227982 C>T polymorphism associated with gastric cardia adenocarcinoma risk [38]. Interestingly, it was reduced the risk of breast cancer [39] and increased the risk of ovarian cancer [40]. Hua et al. mentioned that PD-1 gene polymorphisms may regulate the breast cancer susceptibility and prognosis in Chinese individuals [41], while inconsistent findings were obtained in the study by Haghshenas et al. [42]. Thus, several meta-analyses were conducted to solve these conflicting findings [43–45]. Data summarized that PD-1 rs11568821 and rs2227981 polymorphisms decreased the overall cancer risk, and PD-1 rs7421861 polymorphism was associated with an increased risk of overall cancer [43]. No significant association between some SNPs (rs2227982, rs10204525, rs36084323, and rs2890658 polymorphisms) and overall cancer risk was obtained [43]. To be honest, these loci of PD-1 gene might be potential biomarkers for predicting susceptibility to cancers and therapeutic markers for cancer treatment.
Considering the vital role of PD-1 gene polymorphisms in cancers, we designed this hospital-based case-control study containing 814 esophageal cancer patients and 961 healthy controls. The aims of this case-control study were to investigate whether three PD-1 gene polymorphisms (rs10204525, rs36084323, and rs7421861) were related with esophageal cancer risk and clinical features in Chinese subjects.
Results
Population characteristics
We performed a case-control study consisting of 814 esophageal cancer patients and 961 age- and gender-matched controls. The baseline characteristics of these patients including TNM stage, pathological grade, and distant metastases are shown in Table 1. The mean ages of the controls and cases were 60.91 and 60.66years, respectively. No differences were observed in smoking or alcohol between the two groups. The majority of the patients (85%) were diagnosed with ESCC.
Table 1. Patient demographics and risk factors in esophageal cancer.
| Characteristics | Case (N=814) | Control (N=961) | P | ||||||||||||||||||||||||||||||||||||||||||||||||||||||||||||||||||||||||||||||||||||||||||||||||
| Age | 60.66 (36-82) | 60.91 (38-85) | 0.495 | ||||||||||||||||||||||||||||||||||||||||||||||||||||||||||||||||||||||||||||||||||||||||||||||||
| Sex | 0.440 | ||||||||||||||||||||||||||||||||||||||||||||||||||||||||||||||||||||||||||||||||||||||||||||||||||
| Male | 577(70.9%) | 665(69.2%) | |||||||||||||||||||||||||||||||||||||||||||||||||||||||||||||||||||||||||||||||||||||||||||||||||
| Female | 237(29.1%) | 296(30.8%) | |||||||||||||||||||||||||||||||||||||||||||||||||||||||||||||||||||||||||||||||||||||||||||||||||
| Smoking | 0.771 | ||||||||||||||||||||||||||||||||||||||||||||||||||||||||||||||||||||||||||||||||||||||||||||||||||
| YES | 430(52.8%) | 501(52.1%) | |||||||||||||||||||||||||||||||||||||||||||||||||||||||||||||||||||||||||||||||||||||||||||||||||
| NO | 384(47.2%) | 460(47.9%) | |||||||||||||||||||||||||||||||||||||||||||||||||||||||||||||||||||||||||||||||||||||||||||||||||
| Alcohol | 0.358 | ||||||||||||||||||||||||||||||||||||||||||||||||||||||||||||||||||||||||||||||||||||||||||||||||||
| YES | 470 (57.7%) | 534(55.6%) | |||||||||||||||||||||||||||||||||||||||||||||||||||||||||||||||||||||||||||||||||||||||||||||||||
| NO | 344(42.3%) | 427(44.4%) | |||||||||||||||||||||||||||||||||||||||||||||||||||||||||||||||||||||||||||||||||||||||||||||||||
| TNM stage | |||||||||||||||||||||||||||||||||||||||||||||||||||||||||||||||||||||||||||||||||||||||||||||||||||
| I+II | 424(52.1%) | ||||||||||||||||||||||||||||||||||||||||||||||||||||||||||||||||||||||||||||||||||||||||||||||||||
| III+IV | 390(47.9%) | ||||||||||||||||||||||||||||||||||||||||||||||||||||||||||||||||||||||||||||||||||||||||||||||||||
| Pathological grading | |||||||||||||||||||||||||||||||||||||||||||||||||||||||||||||||||||||||||||||||||||||||||||||||||||
| Well differentiation | 320(39.3%) | ||||||||||||||||||||||||||||||||||||||||||||||||||||||||||||||||||||||||||||||||||||||||||||||||||
| Moderately differentiation | 378(46.4%) | ||||||||||||||||||||||||||||||||||||||||||||||||||||||||||||||||||||||||||||||||||||||||||||||||||
| Poorly differentiation | 116(14.3%) | ||||||||||||||||||||||||||||||||||||||||||||||||||||||||||||||||||||||||||||||||||||||||||||||||||
| Histology | |||||||||||||||||||||||||||||||||||||||||||||||||||||||||||||||||||||||||||||||||||||||||||||||||||
| Squamous cell carcinoma | 782(96.1%) | ||||||||||||||||||||||||||||||||||||||||||||||||||||||||||||||||||||||||||||||||||||||||||||||||||
| Others | 32(3.9%) | ||||||||||||||||||||||||||||||||||||||||||||||||||||||||||||||||||||||||||||||||||||||||||||||||||
| Distant metastasis | |||||||||||||||||||||||||||||||||||||||||||||||||||||||||||||||||||||||||||||||||||||||||||||||||||
| M0 | 723(88.8%) | ||||||||||||||||||||||||||||||||||||||||||||||||||||||||||||||||||||||||||||||||||||||||||||||||||
| M1 | 91(11.2%) | ||||||||||||||||||||||||||||||||||||||||||||||||||||||||||||||||||||||||||||||||||||||||||||||||||
| TNM stage = Tumor node metastasis stage | |||||||||||||||||||||||||||||||||||||||||||||||||||||||||||||||||||||||||||||||||||||||||||||||||||
PD-1 polymorphisms increase the risk of esophageal cancer
We evaluated the associations between three polymorphisms in PD-1 (rs10204525, rs7421861, and rs36084323) and the risk of esophageal cancer. The distributions of the genotypes of the PD-1 variants among the case and control populations are presented in Table 2 and Supplementary Figure 1. The GG genotype of rs10204525 polymorphism increased the risk of esophageal cancer compared to the more common AA genotype (GG vs. AA: adjusted odds ratio [OR] = 1.65, 95% confidence interval [CI] = 1.12–2.45; P = 0.012). This association was significant under recessive, dominant, and allelic models. The TT genotype of rs7421861 was related with a 1.45-fold higher risk of esophageal cancer compared to the CC genotype (TT vs. CC: OR = 1.45, 95% CI = 1.06–1.99); P = 0.022). We did not observe an association between rs36084323 polymorphism and esophageal cancer risk.
Table 2. Genotype frequencies of PD-1 gene polymorphisms in cases and controls.
| Models | Genotype | Case (n, %)a | Control (n, %)a | OR (95% CI) | P-value | P (FDR)b | OR (95% CI)c | P-valuec | |||||||||||||||||||||||||||||||||||||||||||||||||||||||||||||||||||||||||||||||||||||||||||
| rs10204525 | |||||||||||||||||||||||||||||||||||||||||||||||||||||||||||||||||||||||||||||||||||||||||||||||||||
| Co-dominant | AA | 420(51.7%) | 551(57.4%) | 1.00(reference) | |||||||||||||||||||||||||||||||||||||||||||||||||||||||||||||||||||||||||||||||||||||||||||||||
| Heterozygote | AG | 329(40.5%) | 359(37.4%) | 1.20(0.99-1.46) | 0.066 | 1.20(0.99-1.46) | 0.070 | ||||||||||||||||||||||||||||||||||||||||||||||||||||||||||||||||||||||||||||||||||||||||||||
| Homozygote | GG | 63(7.8%) | 50(5.2%) | 1.65(1.12-2.45) | 0.012 | 1.67(1.13-2.48) | 0.010 | ||||||||||||||||||||||||||||||||||||||||||||||||||||||||||||||||||||||||||||||||||||||||||||
| Dominant | AA | 420(51.7%) | 551(57.4%) | 1.00(reference) | |||||||||||||||||||||||||||||||||||||||||||||||||||||||||||||||||||||||||||||||||||||||||||||||
| GG+AG | 392(48.3%) | 409(42.6%) | 1.26(1.04-1.52) | 0.017 | 1.26(1.04-1.52) | 0.017 | |||||||||||||||||||||||||||||||||||||||||||||||||||||||||||||||||||||||||||||||||||||||||||||
| Recessive | AG+AA | 749(92.2%) | 910(94.8%) | 1.00(reference) | |||||||||||||||||||||||||||||||||||||||||||||||||||||||||||||||||||||||||||||||||||||||||||||||
| GG | 63(7.8%) | 50(5.2%) | 1.53(1.04-2.25) | 0.030 | 1.55(1.06,2.28) | 0.025 | |||||||||||||||||||||||||||||||||||||||||||||||||||||||||||||||||||||||||||||||||||||||||||||
| Allele | A | 1169(72.0%) | 1461(76.1%) | 1.00(reference) | |||||||||||||||||||||||||||||||||||||||||||||||||||||||||||||||||||||||||||||||||||||||||||||||
| G | 455(28.0%) | 459(23.9%) | 1.24(1.07-1.44) | 0.005 | 0.015 | ||||||||||||||||||||||||||||||||||||||||||||||||||||||||||||||||||||||||||||||||||||||||||||||
| rs36084323 | |||||||||||||||||||||||||||||||||||||||||||||||||||||||||||||||||||||||||||||||||||||||||||||||||||
| Co-dominant | GG | 673(82.8%) | 761(79.2%) | 1.00(reference) | |||||||||||||||||||||||||||||||||||||||||||||||||||||||||||||||||||||||||||||||||||||||||||||||
| Heterozygote | GA | 132(16.2%) | 188(19.6%) | 0.79(0.62-1.02) | 0.066 | 0.79(0.62-1.01) | 0.064 | ||||||||||||||||||||||||||||||||||||||||||||||||||||||||||||||||||||||||||||||||||||||||||||
| Homozygote | AA | 8(1.0%) | 12(1.2%) | 0.75(0.31-1.86) | 0.539 | 0.75(0.30-1.85) | 0.530 | ||||||||||||||||||||||||||||||||||||||||||||||||||||||||||||||||||||||||||||||||||||||||||||
| Dominant | GG | 673(82.8%) | 761(79.2%) | 1.00(reference) | |||||||||||||||||||||||||||||||||||||||||||||||||||||||||||||||||||||||||||||||||||||||||||||||
| AA+GA | 140(17.2%) | 200(20.8%) | 0.79(0.62-1.01) | 0.056 | 0.79(0.62-1.00) | 0.054 | |||||||||||||||||||||||||||||||||||||||||||||||||||||||||||||||||||||||||||||||||||||||||||||
| Recessive | GA+GG | 805(99.0%) | 949(98.8%) | 1.00(reference) | |||||||||||||||||||||||||||||||||||||||||||||||||||||||||||||||||||||||||||||||||||||||||||||||
| AA | 8(1.0%) | 12(1.2%) | 0.79(0.32-1.93) | 0.600 | 0.78(0.32,1.92) | 0.589 | |||||||||||||||||||||||||||||||||||||||||||||||||||||||||||||||||||||||||||||||||||||||||||||
| Allele | G | 1478(90.9%) | 1710(89.0%) | 1.00(reference) | |||||||||||||||||||||||||||||||||||||||||||||||||||||||||||||||||||||||||||||||||||||||||||||||
| A | 148(9.1%) | 212(11.0%) | 0.81(0.65-1.01) | 0.058 | 0.058 | ||||||||||||||||||||||||||||||||||||||||||||||||||||||||||||||||||||||||||||||||||||||||||||||
| rs7421861 | |||||||||||||||||||||||||||||||||||||||||||||||||||||||||||||||||||||||||||||||||||||||||||||||||||
| Co-dominant | CC | 343(42.2%) | 457(47.6%) | 1.00(reference) | - | - | - | ||||||||||||||||||||||||||||||||||||||||||||||||||||||||||||||||||||||||||||||||||||||||||||
| Heterozygote | CT | 370(45.5%) | 411(42.8%) | 1.19(0.98-1.46) | 0.072 | 1.20(0.98-1.46) | 0.074 | ||||||||||||||||||||||||||||||||||||||||||||||||||||||||||||||||||||||||||||||||||||||||||||
| Homozygote | TT | 100(12.3%) | 92(9.6%) | 1.45(1.06-1.99) | 0.022 | 1.44(1.05,1.97) | 0.024 | ||||||||||||||||||||||||||||||||||||||||||||||||||||||||||||||||||||||||||||||||||||||||||||
| Dominant | CC | 343(42.2%) | 457(47.6%) | 1.00(reference) | - | - | - | ||||||||||||||||||||||||||||||||||||||||||||||||||||||||||||||||||||||||||||||||||||||||||||
| TT+CT | 470(57.8%) | 503(52.4%) | 1.25(1.03-1.50) | 0.023 | 1.24(1.03,1.50) | 0.024 | |||||||||||||||||||||||||||||||||||||||||||||||||||||||||||||||||||||||||||||||||||||||||||||
| Recessive | CT+CC | 713(87.7%) | 868(90.4%) | 1.00(reference) | - | - | - | ||||||||||||||||||||||||||||||||||||||||||||||||||||||||||||||||||||||||||||||||||||||||||||
| TT | 100(12.3%) | 92(9.6%) | 1.32(0.98-1.79) | 0.067 | 1.32(0.97,1.78) | 0.074 | |||||||||||||||||||||||||||||||||||||||||||||||||||||||||||||||||||||||||||||||||||||||||||||
| Allele | C | 1056(64.9%) | 1325(69.0%) | 1.00(reference) | - | - | - | ||||||||||||||||||||||||||||||||||||||||||||||||||||||||||||||||||||||||||||||||||||||||||||
| T | 570(35.1%) | 595(31.0%) | 1.20(1.04-1.38) | 0.010 | 0.015 | ||||||||||||||||||||||||||||||||||||||||||||||||||||||||||||||||||||||||||||||||||||||||||||||
| aThe genotyping was successful in 812 cases and 960 controls for rs10204525; The genotyping was successful in 813 cases and 961 controls for rs36084323; The genotyping was successful in 813 cases and 960 controls for rs7421861. | |||||||||||||||||||||||||||||||||||||||||||||||||||||||||||||||||||||||||||||||||||||||||||||||||||
| Bold values are statistically significant (P <0.05). | |||||||||||||||||||||||||||||||||||||||||||||||||||||||||||||||||||||||||||||||||||||||||||||||||||
| bP (FDR) values were calculated with for false discovery rate (FDR) and P < 0.05/3 was considered significant. | |||||||||||||||||||||||||||||||||||||||||||||||||||||||||||||||||||||||||||||||||||||||||||||||||||
| cAdjust for sex, age, smoking and drinking. | |||||||||||||||||||||||||||||||||||||||||||||||||||||||||||||||||||||||||||||||||||||||||||||||||||
We next stratified patients by age, gender, pathological subtype, alcohol consumption, and smoking. The genotype numbers among different subgroups are summarized in Supplementary Figure 2. The association between rs10204525 polymorphism and the esophageal cancer risk was stronger among men, those who smoked or consumed alcohol, and those ≥ 60 years old (Table 3). The rs7421861 polymorphism demonstrated a significant association with esophageal cancer risk among men and among smokers (Table 3). The rs36084323 polymorphism was only related to esophageal cancer risk among men. Finally, rs10204525 and rs7421861 polymorphisms increased the risk of ESCC (Supplementary Tables 1 and 2).
Table 3. Stratified analyses between PD-1 gene polymorphisms and the risk of esophageal cancer.
| Variable | Genotypes (case/control) | Heterozygous model | Homozygous model | Recessive model | Dominant model | ||||||||||||||||||||||||||||||||||||||||||||||||||||||||||||||||||||||||||||||||||||||||||||||
| Wild | Heterozygote | Homozygous | |||||||||||||||||||||||||||||||||||||||||||||||||||||||||||||||||||||||||||||||||||||||||||||||||
| rs10204525 | AA | AG | GG | AG vs. AA | GG vs. AA | GG vs. AA+AG | GG+AG vs. AA | ||||||||||||||||||||||||||||||||||||||||||||||||||||||||||||||||||||||||||||||||||||||||||||
| Sex | |||||||||||||||||||||||||||||||||||||||||||||||||||||||||||||||||||||||||||||||||||||||||||||||||||
| Male | 299/388 | 236/244 | 41/33 | 1.26(0.99-1.59); 0.057 | 1.61(0.99-2.61); 0.052 | 1.47(0.92-2.35); 0.112 | 1.30(1.04-1.63); 0.023 | ||||||||||||||||||||||||||||||||||||||||||||||||||||||||||||||||||||||||||||||||||||||||||||
| Female | 121/163 | 93/115 | 22/17 | 1.09(0.76-1.56); 0.642 | 1.74(0.89-3.43); 0.107 | 1.68(0.87-3.25); 0.122 | 1.17(0.83-1.65); 0.361 | ||||||||||||||||||||||||||||||||||||||||||||||||||||||||||||||||||||||||||||||||||||||||||||
| Smoking | |||||||||||||||||||||||||||||||||||||||||||||||||||||||||||||||||||||||||||||||||||||||||||||||||||
| Yes | 222/290 | 168/185 | 38/26 | 1.19(0.90-1.56); 0.219 | 1.91(1.13-3.24); 0.017 | 1.78(1.06-2.98); 0.029 | 1.28(0.98-1.65); 0.066 | ||||||||||||||||||||||||||||||||||||||||||||||||||||||||||||||||||||||||||||||||||||||||||||
| No | 198/261 | 161/174 | 25/24 | 1.22(0.92-1.62); 0.169 | 1.37(0.76-2.48); 0.292 | 1.26(0.71-2.25); 0.429 | 1.14(0.94-1.63); 0.124 | ||||||||||||||||||||||||||||||||||||||||||||||||||||||||||||||||||||||||||||||||||||||||||||
| Alcohol | |||||||||||||||||||||||||||||||||||||||||||||||||||||||||||||||||||||||||||||||||||||||||||||||||||
| Yes | 240/301 | 191/209 | 38/24 | 1.15(0.88,1.49); 0.303 | 1.99(1.16,3.40); 0.013 | 1.87(1.11,3.17); 0.020 | 1.23(0.96,1.58); 0.100 | ||||||||||||||||||||||||||||||||||||||||||||||||||||||||||||||||||||||||||||||||||||||||||||
| No | 180/250 | 138/150 | 25/26 | 1.29(0.95,1.73); 0.110 | 1.34(0.75,2.39); 0.330 | 1.21(0.69,2.14); 0.512 | 1.29(0.97,1.71); 0.085 | ||||||||||||||||||||||||||||||||||||||||||||||||||||||||||||||||||||||||||||||||||||||||||||
| Age (years) | |||||||||||||||||||||||||||||||||||||||||||||||||||||||||||||||||||||||||||||||||||||||||||||||||||
| <60 | 207/238 | 134/158 | 22/21 | 0.98(0.73,1.31); 0.868 | 1.21(0.64,2.26); 0.559 | 1.22(0.66,2.25); 0.531 | 1.00(0.75,1.33); 0.989 | ||||||||||||||||||||||||||||||||||||||||||||||||||||||||||||||||||||||||||||||||||||||||||||
| ≥60 | 213/313 | 195/201 | 41/29 | 1.43(1.10,1.85); 0.008 | 2.08(1.25,3.45); 0.005 | 1.78(1.09,2.92); 0.022 | 1.51(1.17,1.94); 0.001 | ||||||||||||||||||||||||||||||||||||||||||||||||||||||||||||||||||||||||||||||||||||||||||||
| rs36084323 | GG | GA | AA | GA vs. GG | AA vs. GG | AA vs. GG+GA | AA+GA vs. GG | ||||||||||||||||||||||||||||||||||||||||||||||||||||||||||||||||||||||||||||||||||||||||||||
| Sex | |||||||||||||||||||||||||||||||||||||||||||||||||||||||||||||||||||||||||||||||||||||||||||||||||||
| Male | 484/520 | 87/135 | 6/10 | 0.69(0.52-0.93); 0.015 | 0.65(0.23-1.79); 0.399 | 0.69(0.25-1.91); 0.472 | 0.69(0.52-0.92); 0.011 | ||||||||||||||||||||||||||||||||||||||||||||||||||||||||||||||||||||||||||||||||||||||||||||
| Female | 189/241 | 45/53 | 2/2 | 1.08(0.70-1.68); 0.724 | 1.28(0.78-9.14); 0.809 | 1.26(0.18-8.99); 0.820 | 1.09(0.71-1.68); 0.697 | ||||||||||||||||||||||||||||||||||||||||||||||||||||||||||||||||||||||||||||||||||||||||||||
| Smoking | |||||||||||||||||||||||||||||||||||||||||||||||||||||||||||||||||||||||||||||||||||||||||||||||||||
| Yes | 355/395 | 71/101 | 4/5 | 0.78(0.56-1.09); 0.152 | 0.89(0.24-3.34); 0.863 | 0.93(0.25-3.49); 0.916 | 0.79(0.57-1.09); 0.154 | ||||||||||||||||||||||||||||||||||||||||||||||||||||||||||||||||||||||||||||||||||||||||||||
| No | 318/366 | 61/87 | 4/7 | 0.81(0.56-1.16); 0.243 | 0.66(0.19-2.27); 0.507 | 0.68(0.20-2.35); 0.546 | 0.80(0.56-1.13); 0.201 | ||||||||||||||||||||||||||||||||||||||||||||||||||||||||||||||||||||||||||||||||||||||||||||
| Alcohol | |||||||||||||||||||||||||||||||||||||||||||||||||||||||||||||||||||||||||||||||||||||||||||||||||||
| Yes | 388/417 | 75/111 | 6/6 | 0.73(0.53,1.00); 0.053 | 1.08(0.34,3.36); 0.901 | 1.14(0.37,3.56); 0.821 | 0.86(0.59,1.24); 0.416 | ||||||||||||||||||||||||||||||||||||||||||||||||||||||||||||||||||||||||||||||||||||||||||||
| No | 285/344 | 57/77 | 2/6 | 0.89(0.61,1.30); 0.558 | 0.40(0.08,2.01); 0.268 | 0.41(0.08,2.05); 0.278 | 0.74(0.54,1.02); 0.307 | ||||||||||||||||||||||||||||||||||||||||||||||||||||||||||||||||||||||||||||||||||||||||||||
| Age (years) | |||||||||||||||||||||||||||||||||||||||||||||||||||||||||||||||||||||||||||||||||||||||||||||||||||
| <60 | 300/322 | 58/86 | 5/10 | 0.72(0.50,1.05); 0.086 | 0.54(0.18,1.59); 0.261 | 0.57(0.19,1.68); 0.309 | 0.70(0.49,1.00); 0.053 | ||||||||||||||||||||||||||||||||||||||||||||||||||||||||||||||||||||||||||||||||||||||||||||
| ≥60 | 173/439 | 74/102 | 3/2 | 0.85(0.61,1.19); 0.348 | 1.77(0.29,10.62); 0.535 | 1.81(0.30,10.90); 0.515 | 0.87(0.63,1.21); 0.407 | ||||||||||||||||||||||||||||||||||||||||||||||||||||||||||||||||||||||||||||||||||||||||||||
| rs7421861 | CC | CT | TT | CT vs. CC | TT vs. CC | TT vs. CC+CT | TT+CT vs. CC | ||||||||||||||||||||||||||||||||||||||||||||||||||||||||||||||||||||||||||||||||||||||||||||
| Sex | |||||||||||||||||||||||||||||||||||||||||||||||||||||||||||||||||||||||||||||||||||||||||||||||||||
| Male | 233/318 | 272/283 | 71/63 | 1.31(1.04-1.66); 0.025 | 1.54(1.05-2.25); 0.026 | 1.34(0.94-1.92); 0.109 | 1.35(1.08-1.70); 0.009 | ||||||||||||||||||||||||||||||||||||||||||||||||||||||||||||||||||||||||||||||||||||||||||||
| Female | 110/139 | 98/128 | 29/29 | 0.97(0.67-1.39); 0.858 | 1.26(0.71-2.24); 0.423 | 1.28(0.74-2.22); 0.370 | 1.02(0.73-1.44); 0.900 | ||||||||||||||||||||||||||||||||||||||||||||||||||||||||||||||||||||||||||||||||||||||||||||
| Smoking | |||||||||||||||||||||||||||||||||||||||||||||||||||||||||||||||||||||||||||||||||||||||||||||||||||
| Yes | 174/240 | 195/221 | 61/39 | 1.22(0.93-1.60); 0.160 | 2.16(1.38-3.37); 0.001 | 1.95(1.28-2.99); 0.002 | 1.36(1.05-1.76); 0.021 | ||||||||||||||||||||||||||||||||||||||||||||||||||||||||||||||||||||||||||||||||||||||||||||
| No | 169/217 | 175/190 | 39/53 | 1.18(0.89-1.58); 0.253 | 0.95(0.60-1.50); 0.809 | 0.87(0.56-1.35); 0.535 | 1.13(0.86-1.49); 0.377 | ||||||||||||||||||||||||||||||||||||||||||||||||||||||||||||||||||||||||||||||||||||||||||||
| Alcohol | |||||||||||||||||||||||||||||||||||||||||||||||||||||||||||||||||||||||||||||||||||||||||||||||||||
| Yes | 191/261 | 222/225 | 44/45 | 0.73(0.53,1.00); 0.053 | 1.08(0.34,3.36); 0.901 | 1.14(0.37,3.56); 0.821 | 0.86(0.59,1.24); 0.416 | ||||||||||||||||||||||||||||||||||||||||||||||||||||||||||||||||||||||||||||||||||||||||||||
| No | 152/196 | 148/186 | 56/47143 | 0.89(0.61,1.30); 0.558 | 0.40(0.08,2.01); 0.268 | 0.41(0.08,2.05); 0.278 | 0.74(0.54,1.02); 0.307 | ||||||||||||||||||||||||||||||||||||||||||||||||||||||||||||||||||||||||||||||||||||||||||||
| Age (years) | |||||||||||||||||||||||||||||||||||||||||||||||||||||||||||||||||||||||||||||||||||||||||||||||||||
| <60 | 143/205 | 173/170 | 47/42 | 0.72(0.50,1.05); 0.086 | 0.54(0.18,1.59); 0.261 | 0.57(0.19,1.68); 0.309 | 0.70(0.49,1.00); 0.053 | ||||||||||||||||||||||||||||||||||||||||||||||||||||||||||||||||||||||||||||||||||||||||||||
| ≥60 | 200/252 | 197/241 | 53/50 | 0.85(0.61,1.19); 0.348 | 1.77(0.29,10.62); 0.535 | 1.81(0.30,10.90); 0.515 | 0.87(0.63,1.21); 0.407 | ||||||||||||||||||||||||||||||||||||||||||||||||||||||||||||||||||||||||||||||||||||||||||||
| Bold values are statistically significant (P <0.05). | |||||||||||||||||||||||||||||||||||||||||||||||||||||||||||||||||||||||||||||||||||||||||||||||||||
Cross-over analysis
We next analyzed the joint effects of the PD-1 polymorphisms and either smoking or alcohol consumption on esophageal cancer risk (Table 4). The GG genotype of rs10204525 did not confer an increased risk to esophageal cancer. Additionally, smoking had no association with the risk of esophageal cancer. However, smokers with the GG genotype of rs10204525 polymorphism showed an increased risk of esophageal cancer compared to non-smokers with the AA genotype (OR = 1.93, 95% CI = 1.13–3.28; P = 0.014). These data indicate that there is a strong interaction between the GG genotype of rs10204525 and smoking. The TT genotype of rs7421861 was also not associated with an increased risk of esophageal cancer. However, smokers with the TT genotype of rs7421861 had a significantly increased risk of esophageal cancer. No interaction between rs36084323 and either smoking or alcohol consumption was observed.
Table 4. Genetic (G) and environmental (E) factors 2*4 fork analysis.
| Ga | Eb | Case | Control | OR (95%CI); P value | Reflecting information | ||||||||||||||||||||||||||||||||||||||||||||||||||||||||||||||||||||||||||||||||||||||||||||||
| rs10204525 | |||||||||||||||||||||||||||||||||||||||||||||||||||||||||||||||||||||||||||||||||||||||||||||||||||
| GG vs. AA | Smoking | ||||||||||||||||||||||||||||||||||||||||||||||||||||||||||||||||||||||||||||||||||||||||||||||||||
| + | + | 38 | 26 | 1.93(1.13,3.28); 0.014 | G, E combined effect | ||||||||||||||||||||||||||||||||||||||||||||||||||||||||||||||||||||||||||||||||||||||||||||||
| + | - | 25 | 24 | 1.37(0.76,2.48); 0.291 | G alone effect | ||||||||||||||||||||||||||||||||||||||||||||||||||||||||||||||||||||||||||||||||||||||||||||||
| - | + | 222 | 290 | 1.01(0.78,1.30); 0.944 | E alone effect | ||||||||||||||||||||||||||||||||||||||||||||||||||||||||||||||||||||||||||||||||||||||||||||||
| - | - | 198 | 261 | 1.00 (reference) | Common control | ||||||||||||||||||||||||||||||||||||||||||||||||||||||||||||||||||||||||||||||||||||||||||||||
| AG vs. AA | Smoking | ||||||||||||||||||||||||||||||||||||||||||||||||||||||||||||||||||||||||||||||||||||||||||||||||||
| + | + | 168 | 185 | 1.20(0.91,1.58); 0.206 | G, E combined effect | ||||||||||||||||||||||||||||||||||||||||||||||||||||||||||||||||||||||||||||||||||||||||||||||
| + | - | 161 | 174 | 1.22(0.92,1.62); 0.169 | G alone effect | ||||||||||||||||||||||||||||||||||||||||||||||||||||||||||||||||||||||||||||||||||||||||||||||
| - | + | 222 | 290 | 1.01(0.78,1.30); 0.944 | E alone effect | ||||||||||||||||||||||||||||||||||||||||||||||||||||||||||||||||||||||||||||||||||||||||||||||
| - | - | 198 | 261 | 1.00 (reference) | Common control | ||||||||||||||||||||||||||||||||||||||||||||||||||||||||||||||||||||||||||||||||||||||||||||||
| GG vs. AA | Drinking | ||||||||||||||||||||||||||||||||||||||||||||||||||||||||||||||||||||||||||||||||||||||||||||||||||
| + | + | 38 | 50 | 1.06(0.66,1.68); 0.819 | G, E combined effect | ||||||||||||||||||||||||||||||||||||||||||||||||||||||||||||||||||||||||||||||||||||||||||||||
| + | - | 25 | 24 | 1.45(0.80,2.62); 0.220 | G alone effect | ||||||||||||||||||||||||||||||||||||||||||||||||||||||||||||||||||||||||||||||||||||||||||||||
| - | + | 240 | 301 | 1.11(0.86,1.43); 0.434 | E alone effect | ||||||||||||||||||||||||||||||||||||||||||||||||||||||||||||||||||||||||||||||||||||||||||||||
| - | - | 180 | 250 | 1.00 (reference) | Common control | ||||||||||||||||||||||||||||||||||||||||||||||||||||||||||||||||||||||||||||||||||||||||||||||
| AG vs. AA | Drinking | ||||||||||||||||||||||||||||||||||||||||||||||||||||||||||||||||||||||||||||||||||||||||||||||||||
| + | + | 191 | 209 | 1.27(0.97,1.67); 0.088 | G, E combined effect | ||||||||||||||||||||||||||||||||||||||||||||||||||||||||||||||||||||||||||||||||||||||||||||||
| + | - | 138 | 150 | 1.28(0.95,1.73); 0.109 | G alone effect | ||||||||||||||||||||||||||||||||||||||||||||||||||||||||||||||||||||||||||||||||||||||||||||||
| - | + | 240 | 301 | 1.11(0.86,1.43); 0.434 | E alone effect | ||||||||||||||||||||||||||||||||||||||||||||||||||||||||||||||||||||||||||||||||||||||||||||||
| - | - | 180 | 250 | 1.00 (reference) | Common control | ||||||||||||||||||||||||||||||||||||||||||||||||||||||||||||||||||||||||||||||||||||||||||||||
| rs36084323 | |||||||||||||||||||||||||||||||||||||||||||||||||||||||||||||||||||||||||||||||||||||||||||||||||||
| AA vs. GG | Smoking | ||||||||||||||||||||||||||||||||||||||||||||||||||||||||||||||||||||||||||||||||||||||||||||||||||
| + | + | 4 | 5 | 0.99(0.27,3.73); 0.993 | G, E combined effect | ||||||||||||||||||||||||||||||||||||||||||||||||||||||||||||||||||||||||||||||||||||||||||||||
| + | - | 4 | 7 | 0.71(0.21,2.45); 0.585 | G alone effect | ||||||||||||||||||||||||||||||||||||||||||||||||||||||||||||||||||||||||||||||||||||||||||||||
| - | + | 355 | 366 | 1.21(0.98,1.48); 0.079 | E alone effect | ||||||||||||||||||||||||||||||||||||||||||||||||||||||||||||||||||||||||||||||||||||||||||||||
| - | - | 318 | 395 | 1.00 (reference) | Common control | ||||||||||||||||||||||||||||||||||||||||||||||||||||||||||||||||||||||||||||||||||||||||||||||
| GA vs. GG | Smoking | ||||||||||||||||||||||||||||||||||||||||||||||||||||||||||||||||||||||||||||||||||||||||||||||||||
| + | + | 71 | 101 | 0.87(0.62,1.22); 0.431 | G, E combined effect | ||||||||||||||||||||||||||||||||||||||||||||||||||||||||||||||||||||||||||||||||||||||||||||||
| + | - | 61 | 87 | 0.87(0.61,1.25); 0.450 | G alone effect | ||||||||||||||||||||||||||||||||||||||||||||||||||||||||||||||||||||||||||||||||||||||||||||||
| - | + | 355 | 366 | 1.21(0.98,1.48); 0.079 | E alone effect | ||||||||||||||||||||||||||||||||||||||||||||||||||||||||||||||||||||||||||||||||||||||||||||||
| - | - | 318 | 395 | 1.00 (reference) | Common control | ||||||||||||||||||||||||||||||||||||||||||||||||||||||||||||||||||||||||||||||||||||||||||||||
| AA vs. GG | Drinking | ||||||||||||||||||||||||||||||||||||||||||||||||||||||||||||||||||||||||||||||||||||||||||||||||||
| + | + | 6 | 6 | 1.21(0.39,3.78); 0.747 | G, E combined effect | ||||||||||||||||||||||||||||||||||||||||||||||||||||||||||||||||||||||||||||||||||||||||||||||
| + | - | 2 | 6 | 0.40(0.08,2.01); 0.251 | G alone effect | ||||||||||||||||||||||||||||||||||||||||||||||||||||||||||||||||||||||||||||||||||||||||||||||
| - | + | 388 | 417 | 1.12(0.91,1.38); 0.277 | E alone effect | ||||||||||||||||||||||||||||||||||||||||||||||||||||||||||||||||||||||||||||||||||||||||||||||
| - | - | 285 | 344 | 1.00 (reference) | Common control | ||||||||||||||||||||||||||||||||||||||||||||||||||||||||||||||||||||||||||||||||||||||||||||||
| GA vs. GG | Drinking | ||||||||||||||||||||||||||||||||||||||||||||||||||||||||||||||||||||||||||||||||||||||||||||||||||
| + | + | 75 | 111 | 0.82(0.59,1.14); 0.229 | G, E combined effect | ||||||||||||||||||||||||||||||||||||||||||||||||||||||||||||||||||||||||||||||||||||||||||||||
| + | - | 57 | 77 | 0.89(0.61,1.30); 0.558 | G alone effect | ||||||||||||||||||||||||||||||||||||||||||||||||||||||||||||||||||||||||||||||||||||||||||||||
| - | + | 388 | 417 | 1.12(0.91,1.38); 0.277 | E alone effect | ||||||||||||||||||||||||||||||||||||||||||||||||||||||||||||||||||||||||||||||||||||||||||||||
| - | - | 285 | 344 | 1.00 (reference) | Common control | ||||||||||||||||||||||||||||||||||||||||||||||||||||||||||||||||||||||||||||||||||||||||||||||
| Rs7421861 | |||||||||||||||||||||||||||||||||||||||||||||||||||||||||||||||||||||||||||||||||||||||||||||||||||
| TT vs. CC | Smoking | ||||||||||||||||||||||||||||||||||||||||||||||||||||||||||||||||||||||||||||||||||||||||||||||||||
| + | + | 61 | 39 | 2.01(1.28,3.15); 0.002 | G, E combined effect | ||||||||||||||||||||||||||||||||||||||||||||||||||||||||||||||||||||||||||||||||||||||||||||||
| + | - | 39 | 53 | 0.95(0.60,1.50); 0.809 | G alone effect | ||||||||||||||||||||||||||||||||||||||||||||||||||||||||||||||||||||||||||||||||||||||||||||||
| - | + | 174 | 240 | 0.93(0.70,1.23); 0.617 | E alone effect | ||||||||||||||||||||||||||||||||||||||||||||||||||||||||||||||||||||||||||||||||||||||||||||||
| - | - | 169 | 217 | 1.00 (reference) | Common control | ||||||||||||||||||||||||||||||||||||||||||||||||||||||||||||||||||||||||||||||||||||||||||||||
| CT vs. CC | Smoking | ||||||||||||||||||||||||||||||||||||||||||||||||||||||||||||||||||||||||||||||||||||||||||||||||||
| + | + | 195 | 221 | 1.13(0.86,1.50); 0.379 | G, E combined effect | ||||||||||||||||||||||||||||||||||||||||||||||||||||||||||||||||||||||||||||||||||||||||||||||
| + | - | 175 | 190 | 1.18(0.89,1.58); 0.252 | G alone effect | ||||||||||||||||||||||||||||||||||||||||||||||||||||||||||||||||||||||||||||||||||||||||||||||
| - | + | 174 | 240 | 0.93(0.70,1.23); 0.617 | E alone effect | ||||||||||||||||||||||||||||||||||||||||||||||||||||||||||||||||||||||||||||||||||||||||||||||
| - | - | 169 | 217 | 1.00 (reference) | Common control | ||||||||||||||||||||||||||||||||||||||||||||||||||||||||||||||||||||||||||||||||||||||||||||||
| TT vs. CC | Drinking | ||||||||||||||||||||||||||||||||||||||||||||||||||||||||||||||||||||||||||||||||||||||||||||||||||
| + | + | 56 | 47 | 1.54(0.99,2.39); 0.056 | G, E combined effect | ||||||||||||||||||||||||||||||||||||||||||||||||||||||||||||||||||||||||||||||||||||||||||||||
| + | - | 44 | 45 | 1.26(0.79,2.01); 0.330 | G alone effect | ||||||||||||||||||||||||||||||||||||||||||||||||||||||||||||||||||||||||||||||||||||||||||||||
| - | + | 191 | 261 | 0.94(0.71,1.25); 0.687 | E alone effect | ||||||||||||||||||||||||||||||||||||||||||||||||||||||||||||||||||||||||||||||||||||||||||||||
| - | - | 152 | 196 | 1.00 (reference) | Common control | ||||||||||||||||||||||||||||||||||||||||||||||||||||||||||||||||||||||||||||||||||||||||||||||
| CT vs. CC | Drinking | ||||||||||||||||||||||||||||||||||||||||||||||||||||||||||||||||||||||||||||||||||||||||||||||||||
| + | + | 222 | 225 | 1.27(0.96,1.69); 0.093 | G, E combined effect | ||||||||||||||||||||||||||||||||||||||||||||||||||||||||||||||||||||||||||||||||||||||||||||||
| + | - | 148 | 186 | 1.03(0.76,1.39); 0.868 | G alone effect | ||||||||||||||||||||||||||||||||||||||||||||||||||||||||||||||||||||||||||||||||||||||||||||||
| - | + | 191 | 261 | 0.94(0.71,1.25); 0.687 | E alone effect | ||||||||||||||||||||||||||||||||||||||||||||||||||||||||||||||||||||||||||||||||||||||||||||||
| - | - | 152 | 196 | 1.00 (reference) | Common control | ||||||||||||||||||||||||||||||||||||||||||||||||||||||||||||||||||||||||||||||||||||||||||||||
| aG (+): PD-1 gene rs10204525/rs36084323/rs7421861 variants (Heterozygous or homozygous); G (-): wild type | |||||||||||||||||||||||||||||||||||||||||||||||||||||||||||||||||||||||||||||||||||||||||||||||||||
| bE(+): smoking/non-smoking; E(-): non-smoking/non-drinking | |||||||||||||||||||||||||||||||||||||||||||||||||||||||||||||||||||||||||||||||||||||||||||||||||||
PD-1 gene polymorphisms correlate with the clinical features of esophageal cancer patients
We next investigated the relationship between PD-1 gene polymorphisms and the clinical characteristics of esophageal cancer patients (Table 5). The GG genotype of rs10204525 polymorphism increased the risk of distant metastasis (OR = 2.21, 95% CI = 1.16–4.23; P = 0.014) and higher TNM stage (OR = 1.81, 95% CI = 1.05–3.12; P = 0.032). The AG genotype of rs10204525 was related to an increased risk of ESCC (OR = 1.61, 95% CI = 1.05–2.46; P = 0.029). Finally, the TT genotype of rs7421861was associated with higher TNM stage.
Table 5. The associations between PD-1 gene polymorphisms and clinical characteristics of esophageal cancer.
| Characteristics | Genotype distributions | ||||||||||||||||||||||||||||||||||||||||||||||||||||||||||||||||||||||||||||||||||||||||||||||||||
| rs10204525 | AA | AG | GG | AG+GG | |||||||||||||||||||||||||||||||||||||||||||||||||||||||||||||||||||||||||||||||||||||||||||||||
| Pathological grading | |||||||||||||||||||||||||||||||||||||||||||||||||||||||||||||||||||||||||||||||||||||||||||||||||||
| MD/WD | 212//156 | 139/135 | 26/28 | 165/163 | |||||||||||||||||||||||||||||||||||||||||||||||||||||||||||||||||||||||||||||||||||||||||||||||
| OR (95%CI); P-value | 1.0 (reference) | 0.76(0.55-1.04); 0.083 | 0.68(0.39-1.21); 0.190 | 0.75(0.55-1.01); 0.054 | |||||||||||||||||||||||||||||||||||||||||||||||||||||||||||||||||||||||||||||||||||||||||||||||
| Pathological grading | |||||||||||||||||||||||||||||||||||||||||||||||||||||||||||||||||||||||||||||||||||||||||||||||||||
| PD/WD | 52/156 | 55/135 | 9/28 | 64/163 | |||||||||||||||||||||||||||||||||||||||||||||||||||||||||||||||||||||||||||||||||||||||||||||||
| OR (95%CI); P-value | 1.0 (reference) | 1.22(0.78-1.91); 0.375 | 0.96(0.43-2.18); 0.930 | 1.18(0.77-1.81); 0.452 | |||||||||||||||||||||||||||||||||||||||||||||||||||||||||||||||||||||||||||||||||||||||||||||||
| Distant metastasis | |||||||||||||||||||||||||||||||||||||||||||||||||||||||||||||||||||||||||||||||||||||||||||||||||||
| M1/M0 | 52/368 | 60/269 | 15/48 | 75/317 | |||||||||||||||||||||||||||||||||||||||||||||||||||||||||||||||||||||||||||||||||||||||||||||||
| OR (95%CI); P-value | 1.0 (reference) | 1.58(1.06-2.36); 0.026 | 2.21(1.16-4.23); 0.014 | 1.67(1.14-2.46); 0.008 | |||||||||||||||||||||||||||||||||||||||||||||||||||||||||||||||||||||||||||||||||||||||||||||||
| Tumor node metastasis stage | |||||||||||||||||||||||||||||||||||||||||||||||||||||||||||||||||||||||||||||||||||||||||||||||||||
| T3+T4 / T1+T2 | 206/214 | 153/176 | 40/23 | 193/199 | |||||||||||||||||||||||||||||||||||||||||||||||||||||||||||||||||||||||||||||||||||||||||||||||
| OR (95%CI); P-value | 1.0 (reference) | 0.90(0.68-1.21); 0.489 | 1.81(1.05-3.12); 0.032 | 1.01(0.77-1.33); 0.958 | |||||||||||||||||||||||||||||||||||||||||||||||||||||||||||||||||||||||||||||||||||||||||||||||
| Histology | |||||||||||||||||||||||||||||||||||||||||||||||||||||||||||||||||||||||||||||||||||||||||||||||||||
| Squamous/Not Squamous | 349/71 | 292/37 | 49/14 | 341/51 | |||||||||||||||||||||||||||||||||||||||||||||||||||||||||||||||||||||||||||||||||||||||||||||||
| OR (95%CI); P-value | 1.0 (reference) | 1.61(1.05-2.46); 0.029 | 0.71(0.37-1.36); 0.301 | 1.36(0.92-2.01); 0.121 | |||||||||||||||||||||||||||||||||||||||||||||||||||||||||||||||||||||||||||||||||||||||||||||||
| rs36084323 | GG | GA | AA | GA+AA | |||||||||||||||||||||||||||||||||||||||||||||||||||||||||||||||||||||||||||||||||||||||||||||||
| Pathological grading | |||||||||||||||||||||||||||||||||||||||||||||||||||||||||||||||||||||||||||||||||||||||||||||||||||
| MD/WD | 321/268 | 60/49 | 5/3 | 65/52 | |||||||||||||||||||||||||||||||||||||||||||||||||||||||||||||||||||||||||||||||||||||||||||||||
| OR (95%CI); P-value | 1.0 (reference) | 1.02(0.68-1.54); 0.916 | 1.39(0.33-5.88); 0.652 | 1.04(0.70-1.56); 0.834 | |||||||||||||||||||||||||||||||||||||||||||||||||||||||||||||||||||||||||||||||||||||||||||||||
| Pathological grading | |||||||||||||||||||||||||||||||||||||||||||||||||||||||||||||||||||||||||||||||||||||||||||||||||||
| PD/WD | 93/268 | 23/49 | ½ | 13/52 | |||||||||||||||||||||||||||||||||||||||||||||||||||||||||||||||||||||||||||||||||||||||||||||||
| OR (95%CI); P-value | 1.0 (reference) | 1.35(0.78-2.34); 0.279 | 1.44(0.13-16.08); 0.765 | 0.72(0.38-1.38); 0.323 | |||||||||||||||||||||||||||||||||||||||||||||||||||||||||||||||||||||||||||||||||||||||||||||||
| Distant metastasis | |||||||||||||||||||||||||||||||||||||||||||||||||||||||||||||||||||||||||||||||||||||||||||||||||||
| M1/M0 | 80/593 | 10/122 | 2/6 | 10/130 | |||||||||||||||||||||||||||||||||||||||||||||||||||||||||||||||||||||||||||||||||||||||||||||||
| OR (95%CI); P-value | 1.0 (reference) | 0.61(0.31-1.21); 0.151 | 2.47(0.49-12.45); 0.257 | 0.57(0.29-1.13); 0.104 | |||||||||||||||||||||||||||||||||||||||||||||||||||||||||||||||||||||||||||||||||||||||||||||||
| Tumor node metastasis stage | |||||||||||||||||||||||||||||||||||||||||||||||||||||||||||||||||||||||||||||||||||||||||||||||||||
| T3+T4 / T1+T2 | 320/353 | 67/65 | 4/4 | 71/69 | |||||||||||||||||||||||||||||||||||||||||||||||||||||||||||||||||||||||||||||||||||||||||||||||
| OR (95%CI); P-value | 1.0 (reference) | 1.14(0.78-1.65); 0.500 | 1.10(0.27-4.45); 0.890 | 1.14(0.79-1.63); 0.495 | |||||||||||||||||||||||||||||||||||||||||||||||||||||||||||||||||||||||||||||||||||||||||||||||
| Histology | |||||||||||||||||||||||||||||||||||||||||||||||||||||||||||||||||||||||||||||||||||||||||||||||||||
| Squamous/Not Squamous | 569/104 | 115/17 | 7/1 | 122/18 | |||||||||||||||||||||||||||||||||||||||||||||||||||||||||||||||||||||||||||||||||||||||||||||||
| OR (95%CI); P-value | 1.0 (reference) | 1.24(0.71-2.14); 0.449 | 1.28(0.16-10.51); 0.818 | 1.24(0.72-2.12); 0.434 | |||||||||||||||||||||||||||||||||||||||||||||||||||||||||||||||||||||||||||||||||||||||||||||||
| rs7421861 | CC | CT | TT | CT+TT | |||||||||||||||||||||||||||||||||||||||||||||||||||||||||||||||||||||||||||||||||||||||||||||||
| Pathological grading | |||||||||||||||||||||||||||||||||||||||||||||||||||||||||||||||||||||||||||||||||||||||||||||||||||
| MD/WD | 157/136 | 175/149 | 46/34 | 221/183 | |||||||||||||||||||||||||||||||||||||||||||||||||||||||||||||||||||||||||||||||||||||||||||||||
| OR (95%CI); P-value | 1.0 (reference) | 1.02(0.74-1.40); 0.915 | 1.17(0.71-1.93); 0.533 | 1.05(0.77-1.42); 0.770 | |||||||||||||||||||||||||||||||||||||||||||||||||||||||||||||||||||||||||||||||||||||||||||||||
| Pathological grading | |||||||||||||||||||||||||||||||||||||||||||||||||||||||||||||||||||||||||||||||||||||||||||||||||||
| PD/WD | 50/136 | 46/149 | 20/34 | 66/183 | |||||||||||||||||||||||||||||||||||||||||||||||||||||||||||||||||||||||||||||||||||||||||||||||
| OR (95%CI); P-value | 1.0 (reference) | 0.84(0.53-1.33); 0.459 | 1.60(0.84-3.04); 0.148 | 0.98(0.64-1.51); 0.930 | |||||||||||||||||||||||||||||||||||||||||||||||||||||||||||||||||||||||||||||||||||||||||||||||
| Distant metastasis | |||||||||||||||||||||||||||||||||||||||||||||||||||||||||||||||||||||||||||||||||||||||||||||||||||
| M1/M0 | 44/299 | 41/329 | 6/94 | 47/423 | |||||||||||||||||||||||||||||||||||||||||||||||||||||||||||||||||||||||||||||||||||||||||||||||
| OR (95%CI); P-value | 1.0 (reference) | 0.85(0.54-1.33); 0.472 | 0.43(0.18-1.05); 0.058 | 0.76(0.49-1.17); 0.207 | |||||||||||||||||||||||||||||||||||||||||||||||||||||||||||||||||||||||||||||||||||||||||||||||
| Tumor node metastasis stage | |||||||||||||||||||||||||||||||||||||||||||||||||||||||||||||||||||||||||||||||||||||||||||||||||||
| T3+T4 / T1+T2 | 149/194 | 185/185 | 56/44 | 241/229 | |||||||||||||||||||||||||||||||||||||||||||||||||||||||||||||||||||||||||||||||||||||||||||||||
| OR (95%CI); P-value | 1.0 (reference) | 1.30(0.97-1.75); 0.079 | 1.66(1.06-2.60); 0.027 | 1.37(1.04-1.81); 0.027 | |||||||||||||||||||||||||||||||||||||||||||||||||||||||||||||||||||||||||||||||||||||||||||||||
| Histology | |||||||||||||||||||||||||||||||||||||||||||||||||||||||||||||||||||||||||||||||||||||||||||||||||||
| Squamous/Not Squamous | 296/47 | 314/56 | 81/19 | 395/75 | |||||||||||||||||||||||||||||||||||||||||||||||||||||||||||||||||||||||||||||||||||||||||||||||
| OR (95%CI); P-value | 1.0 (reference) | 0.89(0.59-1.35); 0.587 | 0.68(0.38-1.22); 0.191 | 0.84(0.56-1.24); 0.374 | |||||||||||||||||||||||||||||||||||||||||||||||||||||||||||||||||||||||||||||||||||||||||||||||
| Bold values are statistically significant (P <0.05). PD = Poorly differentiation, MD= Moderately differentiation, WD= Well differentiation | |||||||||||||||||||||||||||||||||||||||||||||||||||||||||||||||||||||||||||||||||||||||||||||||||||
PD-1 polymorphisms are related with PD-1 levels and prognosis among esophageal cancer patients
The PD-1 expression levels were measured by qRT-PCR and ELISA in 150 esophageal cancer patients with different genotypes of rs10204525 and rs7421861 polymorphisms. Results showed PD-1 expression levels are significantly higher in GG genotype versus AA genotype carriers (P = 0.013; Figure 1). Similar findings were obtained for the rs7421861 polymorphism (P = 0.024). Similarly, increased PD-1 plasma levels are shown by Elisa (Figure 2). Moreover, higher PD-1 expressions showed worse overall survival among esophageal cancer patients (Figure 3). Thus, the mutant genotype of rs10204525 or rs7421861 polymorphism might contribute to worse survival of esophageal cancer patients by increasing the PD-1 expression.
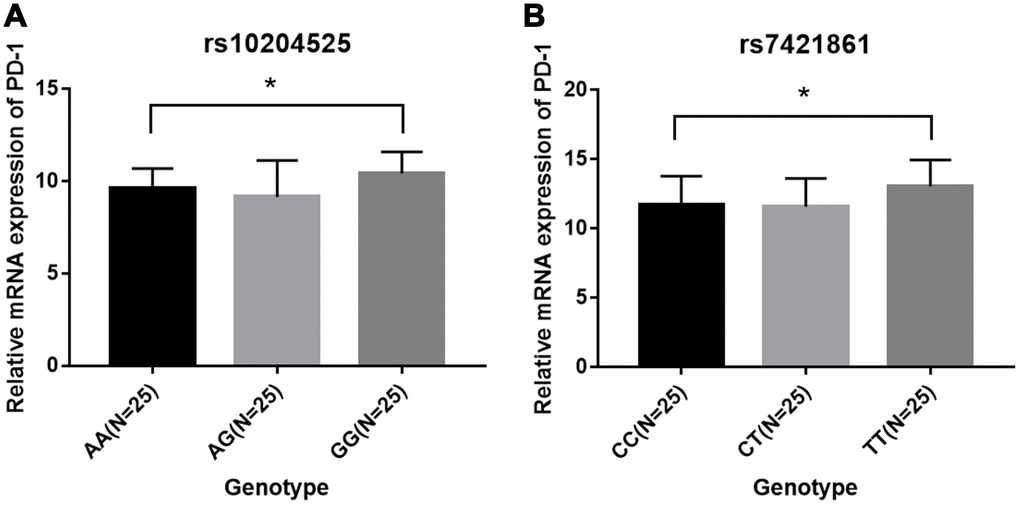
Figure 1. Relative PD-1 mRNA expression among patients in each genotype group. (A) rs10204525; (B) rs7421861.
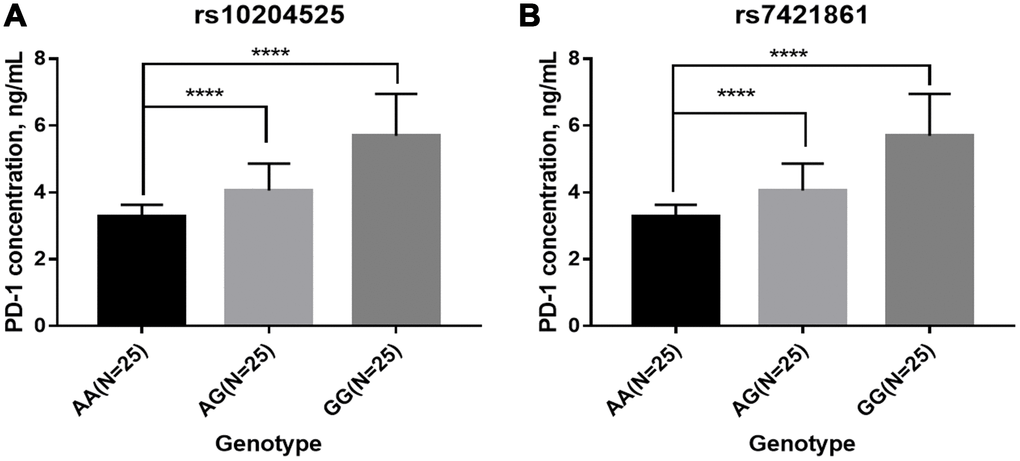
Figure 2. Plasma PD-1 levels among patients in each genotype group. (A) rs10204525; (B) rs7421861.
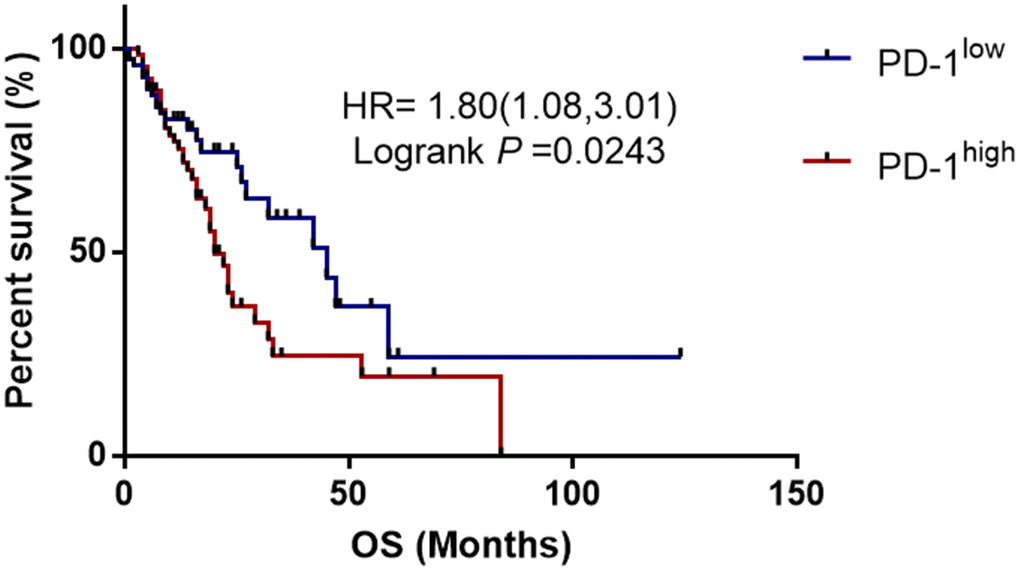
Figure 3. Kaplan-Meier survival curves demonstrating the association between PD-1 expression and overall survival among esophageal cancer patients.
Discussion
In this study, we investigated the relationship between PD-1 gene variants and the risk of esophageal cancer and found PD-1 gene rs7421861 and rs10204525 polymorphisms increased the risk of esophageal cancer in Chinese individuals. The combination of smoking and these genotypes showed a significantly higher risk for esophageal cancer. In addition, genotypes of rs10204525 and rs7421861 polymorphisms were shown to be associated with increased PD-1 gene and protein levels. Furthermore, higher PD-1 expressions were correlated with worse survival of esophageal cancer patients.
Increased expression of programmed death-ligand 1 (PD-L1) has frequently been observed in the brain, gastrointestinal tract, lung, liver, colorectum, kidney, pancreas, ovary, bladder, and esophagus cancers [46–49]. Monoclonal antibodies targeting PD-1 block the interaction with PD-L1 and have demonstrated efficacy in various malignancies [50]. PD-L1 expression was associated with clinical features in esophageal cancer and kidney clear cell carcinoma [51, 52]. Overexpression of PD-1 was also observed in hepatocellular carcinoma and adjacent tissue, and was correlated with the rs10204525 polymorphism in PD-1 [53].
The relationship between PD-1 gene loci and cancer risk has been extensively studied, but the conclusions are inconsistent. As reported, PD-1 gene rs2227982 C>T polymorphism other than rs10204525 A>G or rs7421861 T>C polymorphism was associated with gastric cardia adenocarcinoma [38]. PD-1 was highly expressed on liver cancer tissues and adjacent tissues and the PD-1 level was remarkably associated with PD-1 gene rs10204525 polymorphism [53]. Yeo et al. showed PD-L1 expression was unregulated in lung squamous cell carcinoma [54]. Moreover, the PD-L1 8923 A/C polymorphism [55] and PD-1.5 C/T polymorphism [34] are risky factors of non-small cell lung cancer (NSCLC). Another study observed a significant link between the PD-1 gene rs2227982 polymorphism and breast cancer risk in northwest Chinese women [39]. A meta-analysis concluded the PD-1 gene rs36084323 polymorphism decreased cancer risk among Asians [44].
The AA genotype of rs10204525 in PD-1 gene was previously associated with an increased risk of esophageal cancer and proposed to be a predictive biomarker for ESCC [17]. The rs36084323 T>C polymorphism previously reduced the risk of esophagogastric junction adenocarcinoma (EGJA) while the rs7421861 polymorphism increased the risk of EGJA in Chinese subjects [18]. In addition, the PD-1 Trs10204525Grs2227982Crs36084323Ars7421861 haplotype significantly associated with a decreased risk of EGJA [18]. The rs10204525 polymorphism was not related to ESCC risk in the full cohort. However, a stratified analysis demonstrated that it was associated with a reduced risk of ESCC among male and younger patients [16]. Here we found PD-1 rs10204525 and rs7421861 polymorphisms, but not rs36084323, increased the risk for esophageal cancer, which are obviously inconsistent with the above studies. The conflicting findings may be attributed to some causes, such as clinical heterogeneity. The pathological types were different among these studies, as we studied several pathological types, rather than single cancer types such as EGJA [18] and ESCC [16]. Secondly, the sample sizes of these studies were diverse. Thirdly, living environment and diets may also affect the results.
Furthermore, stratified analyses of age, smoking, sex, and alcohol status were conducted. The rs10204525, rs36084323, rs7421861 polymorphisms increased the risk of esophageal cancer among men in our study. Subgroup analysis revealed that rs10204525 polymorphism elevated the risk of esophageal cancer among patients who consumed alcohol and among patients ≥ 60 years old. Cross-over analysis indicated that smoking in combination with either the rs10204525 or rs7421861 polymorphism significantly contributed to an increased risk of esophageal cancer.
Next, we explored the associations between PD-1 gene polymorphisms and clinical features of esophageal cancer. It was found that rs7421861 and rs10204525 polymorphisms were associated with distant metastasis, and that rs7421861 was also associated with higher TNM stage. However, rs36084323 polymorphism was not associated with esophageal cancer metastasis. Interestingly, both the rs10204525 and rs7421861 polymorphisms were associated with higher PD-1 gene and plasma levels in esophageal cancer patients. Furthermore, Kaplan-Meier survival curves showed higher PD-1 gene expression contributed to worse survival of esophageal cancer patients. These results are in line with those of previous studies, which demonstrated associations between PD-L1 polymorphisms and poor prognosis [54] and survival [56] among lung cancer patients. Thus, we assumed PD-1 gene variants increased the PD-1 gene levels, thereby contributing to esophageal cancer metastasis and worse survival.
This present study did have some potential limitations. First, the limited sample size of this study could not exactly uncover the relationship of the PD-1 gene rs7421861, rs10204525, rs36084323 polymorphisms with esophageal cancer susceptibility. Second, the cases and controls were selected only from Chinese population. Different diet culture, living environment, habits and customs may also contribute to the development of this disorder and selection bias to the whole ethnic groups can still not be ignored. Third, further functional analyses were necessary to uncover how the PD-1 gene polymorphisms affect esophageal cancer. Fourth, we could not perform related experiments to explore the underlying mechanisms by which the PD-1 variants conferred an increased risk to esophageal cancer. Moreover, only three variants of PD-1 gene were explored. Last, potential gene-gene or gene-environment interactions were not obtained.
In summary, the rs7421861 and rs10204525 polymorphisms in PD-1 gene increase the risk of esophageal cancer in a Chinese Han population. These polymorphisms could be potential diagnostic and therapeutic biomarkers. However, the conclusions still need further validation by more studies with large sample sizes in other ethnicities.
Materials and Methods
Subjects
814 patients with newly diagnosed esophageal cancer and 961 cancer-free controls were enrolled from the Affiliated Huai’an No.1 People’s Hospital of Nanjing Medical University. All patients were ≥ 18 years old with no history of other cancers. Patients with history of esophageal disease, a second primary tumor, or tumor of unknown origin were excluded. The controls consisted of individuals who received a comprehensive health examination and had no related history of cancer or autoimmune disease.
Patient demographics and other clinical data were collected using a written questionnaire. Smokers were regarded as smoking more than one cigarette per day for at least 1 year. Drinkers were defined as consumption of alcoholic beverages more than once a week for ≥ 1 year. The Institutional Review Board of Huai’an No.1 People’s Hospital approved this study. Written informed consent was got from all participants. Patient confidentiality was maintained according to the Helsinki declaration.
DNA extraction and genotyping
Peripheral blood (2 mL) was collected from each patient following surgery. Patients were enrolled in the study if post-operative pathological analysis confirmed a diagnosed of esophageal cancer. Using a Puregene DNA Purification Kit, Genomic DNA was obtained from peripheral blood (Gentra, Minneapolis, MN, USA). DNA concentration and purity were analyzed by absorbance and gel electrophoresis, respectively. Genotyping was performed using matrix-assisted laser desorption/ionization time-of-flight mass spectrometry (MALDI-TOFMS) on a MassARRAY system (Sequenom, San Diego, CA, USA). Approximately 5% of the samples were randomly used for repeat assays and a 100% concordance rate was observed.
Quantitative RT-PCR
Total RNA was isolated from peripheral venous blood using the Trizol reagent (Invitrogen, Carlsbad, CA, USA). RNA was reverse-transcribed into cDNA using the SuperScriptTM II Reverse Transcriptase (Invitrogen). Relative PD-1 expression was quantified by real-time PCR using TaqMan® assays. Beta-actin was used as an internal reference. The forward and reverse primers were as follows: 5'-GCACGAGGGACAATAGGA-3', 5'-GAC AATGGTGGCATACT C-3' (PD-1); 5'-AGGTCGGTGT GAACGGATTTG-3', 5'-TGTAGACCATGTAGTTG AGGTCA-3' (GAPDH). Relative gene expression of PD-1 was calculated by the 2-△△CT method.
ELISA
PD-1 levels in plasma were evaluated using a human PD-1 ELISA kit (Sino Biological, Beijing, China). The absorbance was assessed by use of a Tecan Infinite F50 Absorbance Microplate Reader (Tecan, Männedorf, Switzerland). Plasma PD-1 levels were quantified using a standard curve.
Kaplan-Meier survival analysis
The prognostic value of PD-1 mRNA expression in ESCC was assessed using OncoLnc (http://www. oncolnc.org), which contains survival data for 144 patients derived from The Cancer Genome Atlas dataset. Hazard ratios and 95% CIs were obtained using a Cox proportional-hazards model.
Statistical analysis
All statistical analyses were performed using SPSS 13.0 (IBM, Armonk, NY, USA). Graphs were generated using GraphPad Prism 5 (GraphPad Software, La Jolla, CA, USA). The observed genotype frequencies in controls were calculated for Hardy-Weinberg equilibrium test using goodness-of-fit chi-square tests [57]. Categorical variables were assessed using χ2 tests and displayed as frequencies (percentages). Continuous variables in a normal distribution were evaluated using independent samples t-tests or one-way analysis of variance and expressed as the mean ± standard deviation. Logistic regression assuming allelic, dominant, recessive, and co-dominant models was performed to analyze the associations between the polymorphisms and disease risk. P values < 0.05 were considered significant [58, 59].
Author Contributions
Conceived of and designed the study, BZ; Designed the methodology, BZ and CC; Validated the results, JQZ; Performed the analysis, CC and JQZ; Contributed analytical resources, JQZ; Collected the data, CC; Wrote the manuscript, BZ; Edited the manuscript, CC.
Conflicts of Interest
The authors declare that they have no conflicts of interest.
References
- 1. Domper Arnal MJ, Ferrández Arenas Á, Lanas Arbeloa Á. Esophageal cancer: risk factors, screening and endoscopic treatment in Western and Eastern countries. World J Gastroenterol. 2015; 21:7933–43. https://doi.org/10.3748/wjg.v21.i26.7933 [PubMed]
- 2. Spechler SJ. Barrett esophagus and risk of esophageal cancer: a clinical review. JAMA. 2013; 310:627–36. https://doi.org/10.1001/jama.2013.226450 [PubMed]
- 3. Ahmed O, Ajani JA, Lee JH. Endoscopic management of esophageal cancer. World J Gastrointest Oncol. 2019; 11:830–41. https://doi.org/10.4251/wjgo.v11.i10.830 [PubMed]
- 4. Hofstetter W, Swisher SG, Correa AM, Hess K, Putnam JB
Jr , Ajani JA, Dolormente M, Francisco R, Komaki RR, Lara A, Martin F, Rice DC, Sarabia AJ, et al. Treatment outcomes of resected esophageal cancer. Ann Surg. 2002; 236:376–84. https://doi.org/10.1097/00000658-200209000-00014 [PubMed] - 5. Hulscher JB, van Sandick JW, de Boer AG, Wijnhoven BP, Tijssen JG, Fockens P, Stalmeier PF, ten Kate FJ, van Dekken H, Obertop H, Tilanus HW, van Lanschot JJ. Extended transthoracic resection compared with limited transhiatal resection for adenocarcinoma of the esophagus. N Engl J Med. 2002; 347:1662–69. https://doi.org/10.1056/NEJMoa022343 [PubMed]
- 6. Zhao Y, Dai Z, Min W, Sui X, Kang H, Zhang Y, Ren H, Wang XJ. Perioperative versus Preoperative Chemotherapy with Surgery in Patients with Resectable Squamous Cell Carcinoma of Esophagus: A Phase III Randomized Trial. J Thorac Oncol. 2015; 10:1349–56. https://doi.org/10.1097/JTO.0000000000000612 [PubMed]
- 7. Ku GY. Systemic therapy for esophageal cancer: chemotherapy. Linchuang Zhongliuxue Zazhi. 2017; 6:49. https://doi.org/10.21037/cco.2017.07.06 [PubMed]
- 8. Dutton SJ, Ferry DR, Blazeby JM, Abbas H, Dahle-Smith A, Mansoor W, Thompson J, Harrison M, Chatterjee A, Falk S, Garcia-Alonso A, Fyfe DW, Hubner RA, et al. Gefitinib for oesophageal cancer progressing after chemotherapy (COG): a phase 3, multicentre, double-blind, placebo-controlled randomised trial. Lancet Oncol. 2014; 15:894–904. https://doi.org/10.1016/S1470-2045(14)70024-5 [PubMed]
- 9. Conroy T, Galais MP, Raoul JL, Bouché O, Gourgou-Bourgade S, Douillard JY, Etienne PL, Boige V, Martel-Lafay I, Michel P, Llacer-Moscardo C, François E, Créhange G, et al, and Fédération Francophone de Cancérologie Digestive and UNICANCER-GI Group. Definitive chemoradiotherapy with FOLFOX versus fluorouracil and cisplatin in patients with oesophageal cancer (PRODIGE5/ACCORD17): final results of a randomised, phase 2/3 trial. Lancet Oncol. 2014; 15:305–14. https://doi.org/10.1016/S1470-2045(14)70028-2 [PubMed]
- 10. Robb WB, Messager M, Dahan L, Mornex F, Maillard E, D’Journo XB, Triboulet JP, Bedenne L, Seitz JF, Mariette C, and Fédération Francophone de Cancérologie Digestive, and Société Française de Radiothérapie Oncologique, and Union des Centres de Lutte Contre le Cancer, and Groupe Coopérateur Multidisciplinaire en Oncologie, and French EsoGAstric Tumour working group - Fédération de Recherche En Chirurgie. Patterns of recurrence in early-stage oesophageal cancer after chemoradiotherapy and surgery compared with surgery alone. Br J Surg. 2016; 103:117–25. https://doi.org/10.1002/bjs.9959 [PubMed]
- 11. Zhu HD, Guo JH, Mao AW, Lv WF, Ji JS, Wang WH, Lv B, Yang RM, Wu W, Ni CF, Min J, Zhu GY, Chen L, et al. Conventional stents versus stents loaded with (125)iodine seeds for the treatment of unresectable oesophageal cancer: a multicentre, randomised phase 3 trial. Lancet Oncol. 2014; 15:612–19. https://doi.org/10.1016/S1470-2045(14)70131-7 [PubMed]
- 12. Crehange G, Maingon P, Peignaux K, N’guyen TD, Mirabel X, Marchal C, Verrelle P, Roullet B, Bonnetain F, Bedenne L, and Federation Francophone de Cancerologie Digestive 9102. Phase III trial of protracted compared with split-course chemoradiation for esophageal carcinoma: Federation Francophone de Cancerologie Digestive 9102. J Clin Oncol. 2007; 25:4895–901. https://doi.org/10.1200/JCO.2007.12.3471 [PubMed]
- 13. Hu M, Zhang Q, Tian XH, Wang JL, Niu YX, Li G. lncRNA CCAT1 is a biomarker for the proliferation and drug resistance of esophageal cancer via the miR-143/PLK1/BUBR1 axis. Mol Carcinog. 2019; 58:2207–17. https://doi.org/10.1002/mc.23109 [PubMed]
- 14. Wu K, Hu Y, Yan K, Qi Y, Zhang C, Zhu D, Liu D, Zhao S. microRNA-10b confers cisplatin resistance by activating AKT/mTOR/P70S6K signaling via targeting PPARγ in esophageal cancer. J Cell Physiol. 2020; 235:1247–58. https://doi.org/10.1002/jcp.29040 [PubMed]
- 15. Wang J, Che W, Wang W, Su G, Zhen T, Jiang Z. CDKN3 promotes tumor progression and confers cisplatin resistance via RAD51 in esophageal cancer. Cancer Manag Res. 2019; 11:3253–64. https://doi.org/10.2147/CMAR.S193793 [PubMed]
- 16. Qiu H, Zheng L, Tang W, Yin P, Cheng F, Wang L. Programmed death-1 (PD-1) polymorphisms in Chinese patients with esophageal cancer. Clin Biochem. 2014; 47:612–17. https://doi.org/10.1016/j.clinbiochem.2013.12.023 [PubMed]
- 17. Zhou RM, Li Y, Wang N, Huang X, Cao SR, Shan BE. Association of programmed death-1 polymorphisms with the risk and prognosis of esophageal squamous cell carcinoma. Cancer Genet. 2016; 209:365–75. https://doi.org/10.1016/j.cancergen.2016.06.006 [PubMed]
- 18. Tang W, Chen S, Chen Y, Lin J, Lin J, Wang Y, Liu C, Kang M. Programmed death-1 polymorphisms is associated with risk of esophagogastric junction adenocarcinoma in the Chinese Han population: A case-control study involving 2,740 subjects. Oncotarget. 2017; 8:39198–208. https://doi.org/10.18632/oncotarget.17338 [PubMed]
- 19. Ishida Y, Agata Y, Shibahara K, Honjo T. Induced expression of PD-1, a novel member of the immunoglobulin gene superfamily, upon programmed cell death. EMBO J. 1992; 11:3887–95. https://doi.org/10.1002/j.1460-2075.1992.tb05481.x [PubMed]
- 20. Vibhakar R, Juan G, Traganos F, Darzynkiewicz Z, Finger LR. Activation-induced expression of human programmed death-1 gene in T-lymphocytes. Exp Cell Res. 1997; 232:25–28. https://doi.org/10.1006/excr.1997.3493 [PubMed]
- 21. Ceeraz S, Nowak EC, Noelle RJ. B7 family checkpoint regulators in immune regulation and disease. Trends Immunol. 2013; 34:556–63. https://doi.org/10.1016/j.it.2013.07.003 [PubMed]
- 22. Liz J, Esteller M. lncRNAs and microRNAs with a role in cancer development. Biochim Biophys Acta. 2016; 1859:169–76. https://doi.org/10.1016/j.bbagrm.2015.06.015 [PubMed]
- 23. Francisco LM, Sage PT, Sharpe AH. The PD-1 pathway in tolerance and autoimmunity. Immunol Rev. 2010; 236:219–42. https://doi.org/10.1111/j.1600-065X.2010.00923.x [PubMed]
- 24. Brown JA, Dorfman DM, Ma FR, Sullivan EL, Munoz O, Wood CR, Greenfield EA, Freeman GJ. Blockade of programmed death-1 ligands on dendritic cells enhances T cell activation and cytokine production. J Immunol. 2003; 170:1257–66. https://doi.org/10.4049/jimmunol.170.3.1257 [PubMed]
- 25. Ohaegbulam KC, Assal A, Lazar-Molnar E, Yao Y, Zang X. Human cancer immunotherapy with antibodies to the PD-1 and PD-L1 pathway. Trends Mol Med. 2015; 21:24–33. https://doi.org/10.1016/j.molmed.2014.10.009 [PubMed]
- 26. Yi M, Jiao D, Xu H, Liu Q, Zhao W, Han X, Wu K. Biomarkers for predicting efficacy of PD-1/PD-L1 inhibitors. Mol Cancer. 2018; 17:129. https://doi.org/10.1186/s12943-018-0864-3 [PubMed]
- 27. Chen L, Han X. Anti-PD-1/PD-L1 therapy of human cancer: past, present, and future. J Clin Invest. 2015; 125:3384–91. https://doi.org/10.1172/JCI80011 [PubMed]
- 28. Collins TF, Black TN. Effects of FD & C Red No. 40 on rat intrauterine development. Food Cosmet Toxicol. 1980; 18:561–68. https://doi.org/10.1016/S0015-6264(80)80001-0 [PubMed]
- 29. Huang CH, Wong RH, Wei JC, Tsay MD, Chen WC, Chen HY, Shih WT, Chiou SP, Tu YC, Lee HS. Effects of genetic polymorphisms of programmed cell death 1 and its ligands on the development of ankylosing spondylitis. Rheumatology (Oxford). 2011; 50:1809–13. https://doi.org/10.1093/rheumatology/ker211 [PubMed]
- 30. Liu C, Jiang J, Gao L, Hu X, Wang F, Shen Y, Yu G, Zhao Z, Zhang X. A Promoter Region Polymorphism in PDCD-1 Gene Is Associated with Risk of Rheumatoid Arthritis in the Han Chinese Population of Southeastern China. Int J Genomics. 2014; 2014:247637. https://doi.org/10.1155/2014/247637 [PubMed]
- 31. Huang K, Hu E, Li W, Lv J, He Y, Deng G, Xiao J, Yang C, Zhao X, Chen L, Wang X. Association of PD-1 polymorphisms with the risk and prognosis of lung adenocarcinoma in the northeastern Chinese Han population. BMC Med Genet. 2019; 20:177. https://doi.org/10.1186/s12881-019-0914-8 [PubMed]
- 32. Fathi F, Ebrahimi M, Eslami A, Hafezi H, Eskandari N, Motedayyen H. Association of programmed death-1 gene polymorphisms with the risk of basal cell carcinoma. Int J Immunogenet. 2019; 46:444–50. https://doi.org/10.1111/iji.12447 [PubMed]
- 33. Li XF, Jiang XQ, Zhang JW, Jia YJ. Association of the programmed cell death-1 PD1.5 C>T polymorphism with cervical cancer risk in a Chinese population. Genet Mol Res. 2016; 15. https://doi.org/10.4238/gmr.15016357 [PubMed]
- 34. Yin L, Guo H, Zhao L, Wang J. The programmed death-1 gene polymorphism (PD-1.5 C/T) is associated with non-small cell lung cancer risk in a Chinese Han population. Int J Clin Exp Med. 2014; 7:5832–36. [PubMed]
- 35. Savabkar S, Azimzadeh P, Chaleshi V, Nazemalhosseini Mojarad E, Aghdaei HA. Programmed death-1 gene polymorphism (PD-1.5 C/T) is associated with gastric cancer. Gastroenterol Hepatol Bed Bench. 2013; 6:178–82. [PubMed]
- 36. Mojtahedi Z, Mohmedi M, Rahimifar S, Erfani N, Hosseini SV, Ghaderi A. Programmed death-1 gene polymorphism (PD-1.5 C/T) is associated with colon cancer. Gene. 2012; 508:229–32. https://doi.org/10.1016/j.gene.2012.07.059 [PubMed]
- 37. Haghshenas MR, Dabbaghmanesh MH, Miri A, Ghaderi A, Erfani N. Association of PDCD1 gene markers with susceptibility to thyroid cancer. J Endocrinol Invest. 2017; 40:481–86. https://doi.org/10.1007/s40618-016-0579-5 [PubMed]
- 38. Tang W, Chen Y, Chen S, Sun B, Gu H, Kang M. Programmed death-1 (PD-1) polymorphism is associated with gastric cardia adenocarcinoma. Int J Clin Exp Med. 2015; 8:8086–93. [PubMed]
- 39. Ren HT, Li YM, Wang XJ, Kang HF, Jin TB, Ma XB, Liu XH, Wang M, Liu K, Xu P, Yao QL, Dai ZJ. PD-1 rs2227982 Polymorphism Is Associated With the Decreased Risk of Breast Cancer in Northwest Chinese Women: A Hospital-Based Observational Study. Medicine (Baltimore). 2016; 95:e3760. https://doi.org/10.1097/MD.0000000000003760 [PubMed]
- 40. Tan D, Sheng L, Yi QH. Correlation of PD-1/PD-L1 polymorphisms and expressions with clinicopathologic features and prognosis of ovarian cancer. Cancer Biomark. 2018; 21:287–97. https://doi.org/10.3233/CBM-170357 [PubMed]
- 41. Hua Z, Li D, Xiang G, Xu F, Jie G, Fu Z, Jie Z, Da P, Li D. PD-1 polymorphisms are associated with sporadic breast cancer in Chinese Han population of Northeast China. Breast Cancer Res Treat. 2011; 129:195–201. https://doi.org/10.1007/s10549-011-1440-3 [PubMed]
- 42. Haghshenas MR, Naeimi S, Talei A, Ghaderi A, Erfani N. Program death 1 (PD1) haplotyping in patients with breast carcinoma. Mol Biol Rep. 2011; 38:4205–10. https://doi.org/10.1007/s11033-010-0542-z [PubMed]
- 43. Hashemi M, Karami S, Sarabandi S, Moazeni-Roodi A, Małecki A, Ghavami S, Wiechec E. Association between PD-1 and PD-L1 Polymorphisms and the Risk of Cancer: A Meta-Analysis of Case-Control Studies. Cancers (Basel). 2019; 11:E1150. https://doi.org/10.3390/cancers11081150 [PubMed]
- 44. Da LS, Zhang Y, Zhang CJ, Bu LJ, Zhu YZ, Ma T, Gu KS. The PD-1 rs36084323 A > G polymorphism decrease cancer risk in Asian: A meta-analysis. Pathol Res Pract. 2018; 214:1758–64. https://doi.org/10.1016/j.prp.2018.09.015 [PubMed]
- 45. Dong W, Gong M, Shi Z, Xiao J, Zhang J, Peng J. Programmed Cell Death-1 Polymorphisms Decrease the Cancer Risk: A Meta-Analysis Involving Twelve Case-Control Studies. PLoS One. 2016; 11:e0152448. https://doi.org/10.1371/journal.pone.0152448 [PubMed]
- 46. Nomi T, Sho M, Akahori T, Hamada K, Kubo A, Kanehiro H, Nakamura S, Enomoto K, Yagita H, Azuma M, Nakajima Y. Clinical significance and therapeutic potential of the programmed death-1 ligand/ programmed death-1 pathway in human pancreatic cancer. Clin Cancer Res. 2007; 13:2151–57. https://doi.org/10.1158/1078-0432.CCR-06-2746 [PubMed]
- 47. Jacobs JF, Idema AJ, Bol KF, Nierkens S, Grauer OM, Wesseling P, Grotenhuis JA, Hoogerbrugge PM, de Vries IJ, Adema GJ. Regulatory T cells and the PD-L1/PD-1 pathway mediate immune suppression in malignant human brain tumors. Neuro Oncol. 2009; 11:394–402. https://doi.org/10.1215/15228517-2008-104 [PubMed]
- 48. Fay AP, Signoretti S, Callea M, Telό GH, McKay RR, Song J, Carvo I, Lampron ME, Kaymakcalan MD, Poli-de-Figueiredo CE, Bellmunt J, Hodi FS, Freeman GJ, et al. Programmed death ligand-1 expression in adrenocortical carcinoma: an exploratory biomarker study. J Immunother Cancer. 2015; 3:3. https://doi.org/10.1186/s40425-015-0047-3 [PubMed]
- 49. Katsuya Y, Fujita Y, Horinouchi H, Ohe Y, Watanabe S, Tsuta K. Immunohistochemical status of PD-L1 in thymoma and thymic carcinoma. Lung Cancer. 2015; 88:154–59. https://doi.org/10.1016/j.lungcan.2015.03.003 [PubMed]
- 50. McDermott DF, Atkins MB. PD-1 as a potential target in cancer therapy. Cancer Med. 2013; 2:662–73. https://doi.org/10.1002/cam4.106 [PubMed]
- 51. Ohigashi Y, Sho M, Yamada Y, Tsurui Y, Hamada K, Ikeda N, Mizuno T, Yoriki R, Kashizuka H, Yane K, Tsushima F, Otsuki N, Yagita H, et al. Clinical significance of programmed death-1 ligand-1 and programmed death-1 ligand-2 expression in human esophageal cancer. Clin Cancer Res. 2005; 11:2947–53. https://doi.org/10.1158/1078-0432.CCR-04-1469 [PubMed]
- 52. Thompson RH, Dong H, Kwon ED. Implications of B7-H1 expression in clear cell carcinoma of the kidney for prognostication and therapy. Clin Cancer Res. 2007; 13:709s–15s. https://doi.org/10.1158/1078-0432.CCR-06-1868 [PubMed]
- 53. Li Z, Li N, Li F, Zhou Z, Sang J, Chen Y, Han Q, Lv Y, Liu Z. Immune checkpoint proteins PD-1 and TIM-3 are both highly expressed in liver tissues and correlate with their gene polymorphisms in patients with HBV-related hepatocellular carcinoma. Medicine (Baltimore). 2016; 95:e5749. https://doi.org/10.1097/MD.0000000000005749 [PubMed]
- 54. Yeo MK, Choi SY, Seong IO, Suh KS, Kim JM, Kim KH. Association of PD-L1 expression and PD-L1 gene polymorphism with poor prognosis in lung adenocarcinoma and squamous cell carcinoma. Hum Pathol. 2017; 68:103–11. https://doi.org/10.1016/j.humpath.2017.08.016 [PubMed]
- 55. Ma Y, Liu X, Zhu J, Li W, Guo L, Han X, Song B, Cheng S, Jie L. Polymorphisms of co-inhibitory molecules (CTLA-4/PD-1/PD-L1) and the risk of non-small cell lung cancer in a Chinese population. Int J Clin Exp Med. 2015; 8:16585–91. [PubMed]
- 56. Lee SY, Jung DK, Choi JE, Jin CC, Hong MJ, Do SK, Kang HG, Lee WK, Seok Y, Lee EB, Jeong JY, Shin KM, Yoo SS, et al. Functional polymorphisms in PD-L1 gene are associated with the prognosis of patients with early stage non-small cell lung cancer. Gene. 2017; 599:28–35. https://doi.org/10.1016/j.gene.2016.11.007 [PubMed]
- 57. Zhang J, Zhuo Z, Li W, Zhu J, He J, Su J. XRCC1 gene polymorphisms and risk of neuroblastoma in Chinese children. Aging (Albany NY). 2018; 10:2944–53. https://doi.org/10.18632/aging.101601 [PubMed]
- 58. Cheng J, Zhuo Z, Xin Y, Zhao P, Yang W, Zhou H, Zhang J, Gao Y, He J, Li P. Relevance of XPD polymorphisms to neuroblastoma risk in Chinese children: a four-center case-control study. Aging (Albany NY). 2018; 10:1989–2000. https://doi.org/10.18632/aging.101522 [PubMed]
- 59. Zhuo ZJ, Zhang R, Zhang J, Zhu J, Yang T, Zou Y, He J, Xia H. Associations between lncRNA MEG3 polymorphisms and neuroblastoma risk in Chinese children. Aging (Albany NY). 2018; 10:481–91. https://doi.org/10.18632/aging.101406 [PubMed]