Submit an Article
Navigate
Home
Editorial Board
Editorial Policies
Current Volume
Archive
Scientific Integrity
Publication Ethics Statements
Interviews with Outstanding Authors
Newsroom
Sponsored Conferences
Podcast
Contact
Special Collections
Submit an Article
Online ISSN: 1945-4589
Research Paper
|
Volume 12, Issue 4
|
pp. 3771–3790
PD-1 gene rs10204525 and rs7421861 polymorphisms are associated with increased risk and clinical features of esophageal cancer in a Chinese Han population
Back to article
Figure 2
(2 of 3)
−
100%
+
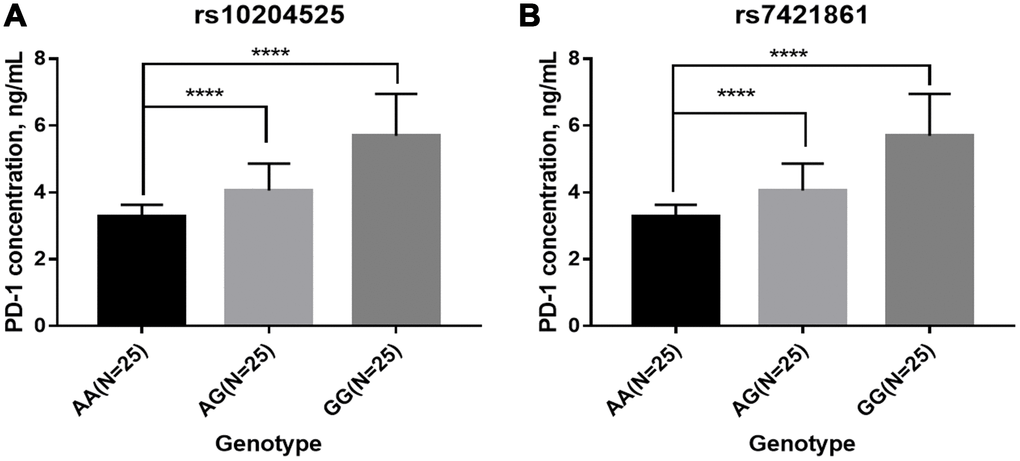
Figure 2.
Plasma PD-1 levels among patients in each genotype group.
(
A
) rs10204525; (
B
) rs7421861.