


Introduction
Lung cancer is the most common tumor worldwide, and carries the highest morbidity and mortality rates [1]. Lung cancer is classified into two major histological subtypes, small cell lung cancer (SCLC; 13% of cases) and non-small cell lung cancer (NSCLC; 83% of cases). Surgical resection is seldom an option for SCLC treatment, owing to typical advanced-stage diagnosis; thus, most SCLC patients receive chemotherapy, but its efficacy is generally limited. On the other hand, only a small number of early-stage NSCLC patients can be treated with surgery, which achieves a 5-year survival rate as high as 70% in patients with stage IA NSCLC [2]. Chemotherapy or radiotherapy are also indicated in patients with more advanced NSCLC, but are associated with a 5-year survival rate of only ~23%. While some success is being achieved with newer immunological and targeted therapies for NSCLC, there are still significant limitations precluding their use in many cases [3]. Notwithstanding, the low 5-year survival rate for patients with lung cancer is largely due to insufficient preventive efforts and generalized late diagnosis [4].
Bioinformatics analysis allows screening of tumor-associated biomarkers from large data repositories to assist early diagnosis and prognostic assessment of cancer [5, 6]. For example, mining of publicly available genomic repositories (i.e. The Gene Expression Omnibus database (GEO) and The Cancer Genome Atlas (TCGA) database) led to identification of a subset of cancer-dysregulated miRNAs, which may allow early detection of pre-cancerous and cancerous oral lesions [7], and of tumor microenvironment-related genes that predict poor outcomes in glioblastoma patients [8].
In our study, a GEO dataset was selected for identification of differentially expressed genes (DEGs) in NSCLC. Gene ontology (GO), Kyoto Encyclopedia of Genes and Genomes (KEGG), and protein-protein interaction (PPI) network analyses were used to link DEGs’ genomic and functional information. In addition, data retrieved from TCGA and GTEx projects was evaluated through Gene Expression Profiling Interactive Analysis (GEPIA) to further assess the presence of relevant DEGs in NSCLC subtypes. Among the most significant DEGs, the TOP2A gene encoding human topoisomerase IIα (TOPIIα) emerged as a potential prognostic biomarker for early-stage lung cancer. Furthermore, its expression was negatively correlated with tumor infiltration of immune cells (especially dendritic cells, DCs) in NSCLC samples. While functional studies are needed to complement our findings, the biomarker dataset provided by our study may serve to improve early diagnosis of NSCLC and help advance new therapeutic strategies.
Results
Identification of DEGs in NSCLC
The GEO dataset GSE103512 was selected for identification of DEGs in 60 human NSCLC specimens against 9 matched normal tissue samples using the GEO2R tool. Genes were defined as DEGs if they had a log2FC > 1.5 or < -1.5 and p < 0.01. A total of 118 genes were identified as DEGs; among these, 11 were upregulated and 107 were downregulated in NSCLC (Figure 1). A full DEG list is shown in Supplementary Table 1.
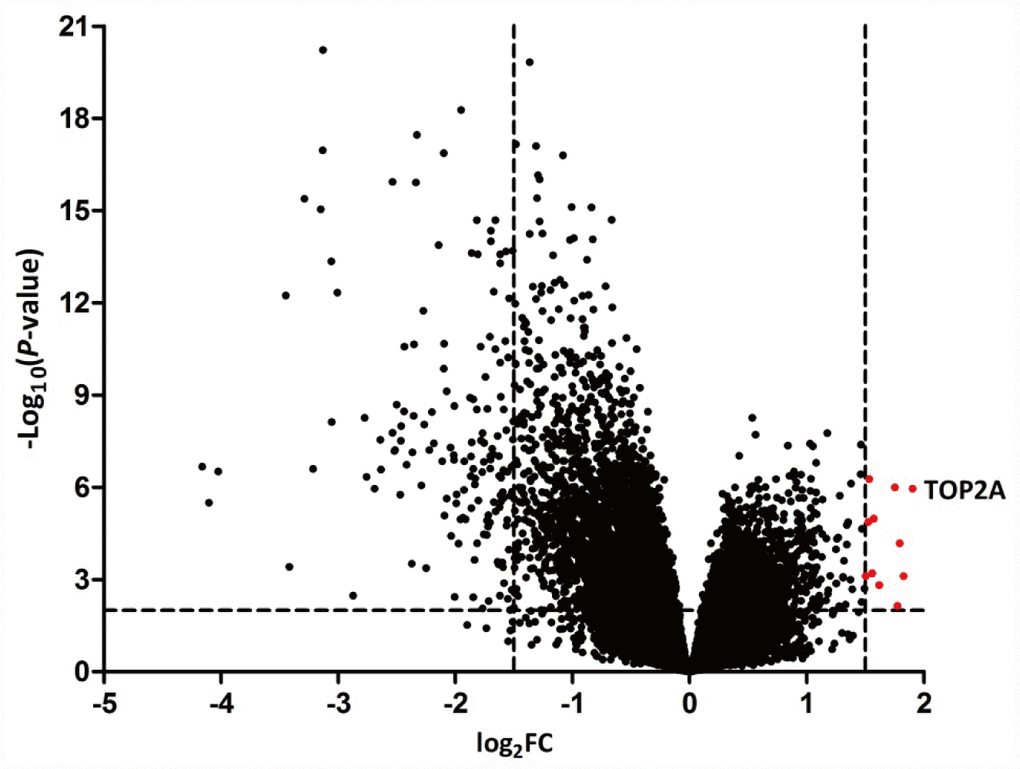
Figure 1. Volcano plots of DEGs in NSCLC. NSCLC samples were analyzed against matched normal lung tissues in the GEO GSE103512 dataset. Data points in red represent upregulated genes. TOP2A was the most significant DEG.
GO enrichment analysis of DEGs
GO enrichment analysis was conducted on the 118 DEGs identified above. For cellular component (CC), the top ten terms were GO: 0005615~extracellular space, GO: 0031012~extracellular matrix, GO: 0044421~extracellular region part, GO: 0005576~extracellular region, GO: 0005578~proteinaceous extracellular matrix, GO: 0031988~membrane-bounded vesicle, GO: 0070062~ extracellular exosome, GO: 1903561~extracellular vesicle, GO: 0043230~extracellular organelle, and GO: 0016323~basolateral plasma membrane (Figure 2A). For molecular function (MF), the top ten terms were GO: 0005539~glycosaminoglycan binding, GO: 0008201~heparin binding, GO: 1901681~sulfur compound binding, GO: 0050840~extracellular matrix binding, GO: 0005509~calcium ion binding, GO: 0005201~extracellular matrix structural constituent, GO: 0030234~enzyme regulator activity, GO: 0016209~antioxidant activity, GO: 0097367~carbohydrate derivative binding, and GO: 0008047~enzyme activator activity (Figure 2B). For biological process (BP), the top ten terms were GO: 1901700~response to oxygen-containing compound, GO: 0042060~wound healing, GO: 0009611~response to wounding, GO: 0072593~reactive oxygen species metabolic process, GO: 0070887~cellular response to chemical stimulus, GO: 0022610~biological adhesion, GO: 0006979~response to oxidative stress, GO: 0010033~response to organic substance, GO: 0009605~response to external stimulus, and GO: 0007155~cell adhesion (Figure 2C).
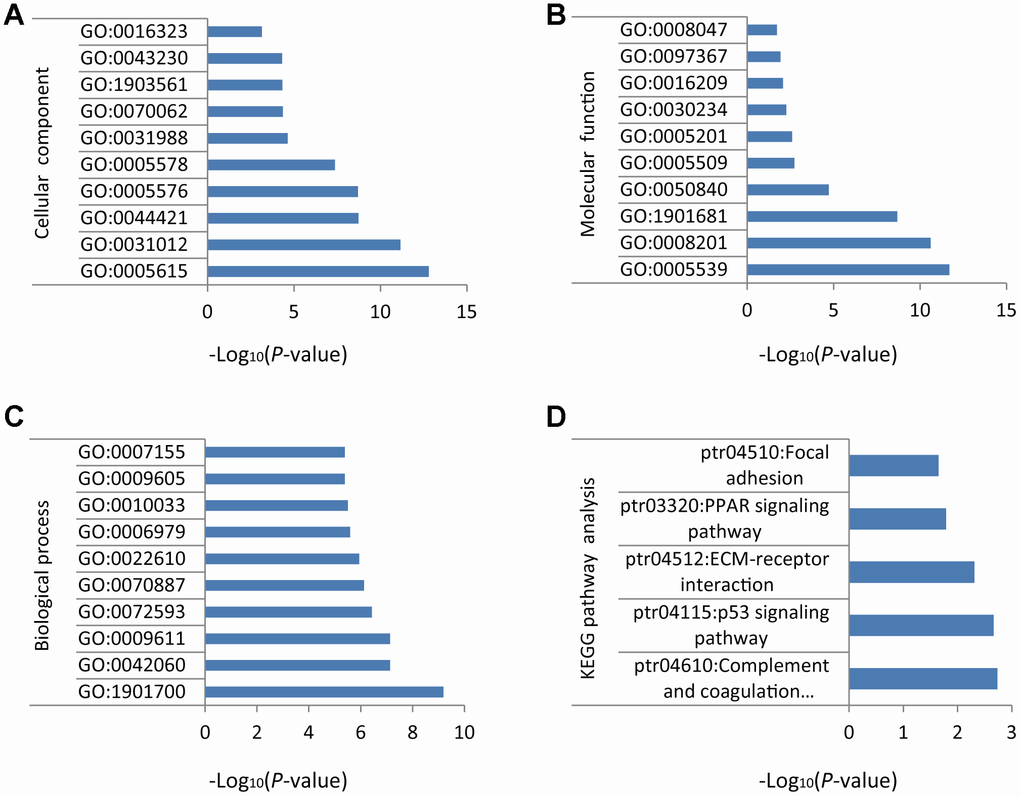
Figure 2. GO and KEGG enrichment analysis of DEGs in NSCLC. (A) Cellular component. (B) Molecular function. (C) Biological process. (D) Biochemical and signal transduction pathways revealed by KEGG pathway analysis.
KEGG pathway analysis of DEGs
KEGG pathway analysis was performed using the Database for Annotation, Visualization and Integrated Discovery (DAVID) v6.8. Results indicated that the DEGs identified in NSCLC samples were mainly related to ‘complement and coagulation cascades’, ‘p53 signaling pathway’, ‘ECM-receptor interaction’, ‘PPAR signaling pathway’, and ‘focal adhesion’ (Figure 2D).
Validation of upregulated DEGs
The DEGs upregulated in NSCLC were selected for validation by quantitative real-time PCR (qPCR) on 17 paired NSCLC/adjacent non-tumor samples collected from surgical patients. The overall trend indicated that all the upregulated DEGs from the GEO database were also overexpressed at the mRNA level in our clinical NSCLC specimens. However, overexpression in NSCLC samples vs normal lung tissues was only significant for TOP2A (P = 0.018), SLC2A1 (P = 0.011), TPX2 (P = 0.016), and ASPM (P = 0.049) (Figure 3A–3K).
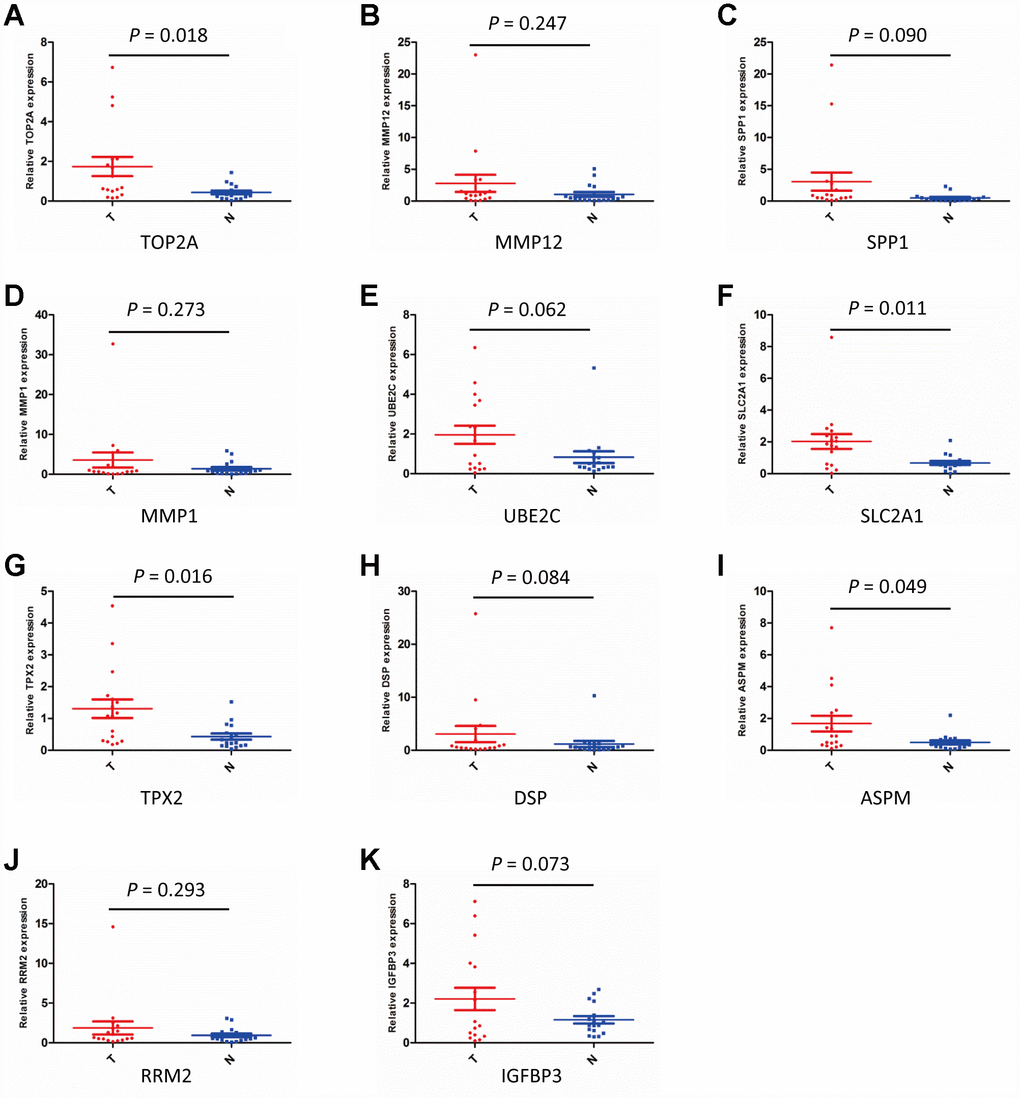
Figure 3. Validation of DEGs expression by qPCR. (A–K) Detection of DEGs expression in NSCLC (T) and adjacent non-tumor lung specimens (N) using qPCR. (n = 17; P < 0.05 indicates significance).
Using Gene Expression Profiling Interactive Analysis (GEPIA), a newly developed interactive web server for analyzing RNA-Seq expression data, we confirmed on NSCLC datasets retrieved from TCGA and GTEx projects that TOP2A (P < 0.05), SLC2A1 (P < 0.05), TPX2 (P < 0.05), and ASPM (P < 0.05) were upregulated in lung adenocarcinoma (LUAD) and lung squamous cell carcinoma (LUSC) specimens, compared to adjacent normal lung samples (Figure 4A–4D).
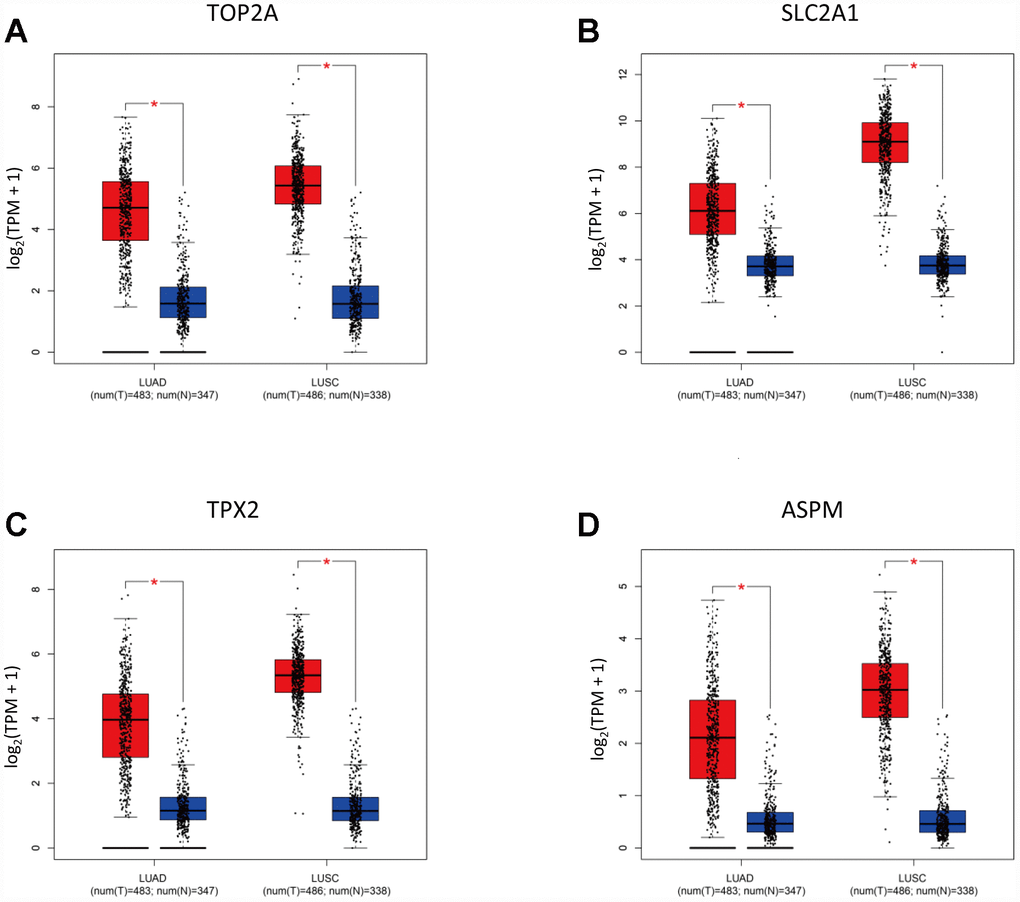
Figure 4. Validation of selected DEGs by GEPIA. (A–D) Expression of TOP2A, SLC2A1, TPX2, and ASPM in NSCLC subtypes (LUAD, n = 483; LUSC, n = 486) and normal lung tissues.
Protein-protein interaction network and correlation analysis of upregulated DEGs
We used the STRING database (https://string-db.org/) to construct protein-protein interaction (PPI) networks for 11 DEGs upregulated in NSCLC (Figure 5A). Results showed that TOP2A, TPX2, and ASPM were interconnected. GEPIA was next used to conduct correlation analysis on these three genes. The correlation coefficients for TOP2A & ASPM, TOP2A & TPX2, and TPX2 & ASPM were 0.63, 0.57, and 0.69 respectively (P = 0.000) (Figure 5B–5D). These data suggest that overexpression of TOP2A, TPX2, and ASPM may significantly impact the development or progression of NSCLC.
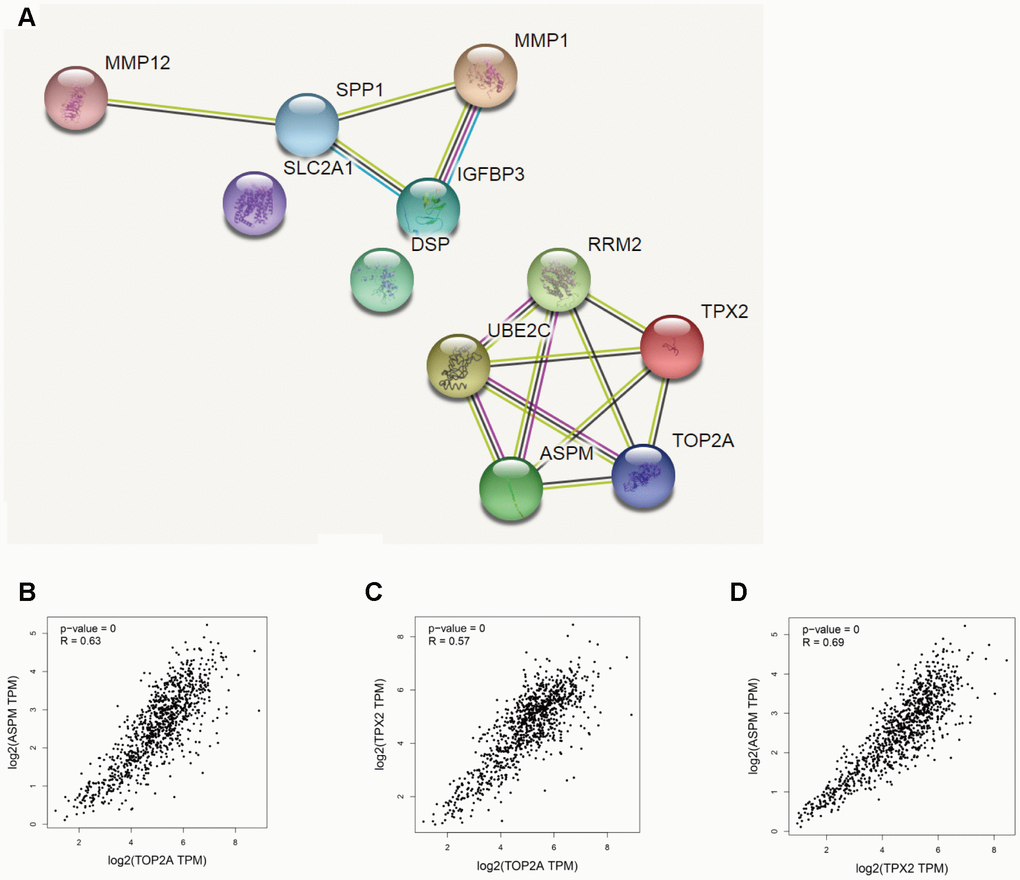
Figure 5. Correlation analysis of DEGs in NSCLC. (A) PPI network of upregulated DEGs. (B–D) Analysis of TOP2A, TPX2, and ASPM by GEPIA’s correlation model. The correlation coefficients for TOP2A & ASPM, TOP2A & TPX2, and TPX2 & ASPM were 0.63, 0.57, and 0.69, respectively (P = 0.000).
Correlations between upregulated DEGs in NSCLC and patient survival
To assess whether upregulation of TOP2A, SLC2A1, TPX2, and ASPM in NSCLC is correlated with patient overall survival (OS), we interrogated NSCLC datasets using the Kaplan Meier plotter platform (http://kmplot.com/analysis/). Results showed that high expression of TOP2A, SLC2A1, TPX2, or ASPM was significantly associated with poor OS (P = 1.6e-11, P < 1e-16, P < 1e-16, and P = 1.4e-11, respectively) (Figure 6A–6D).
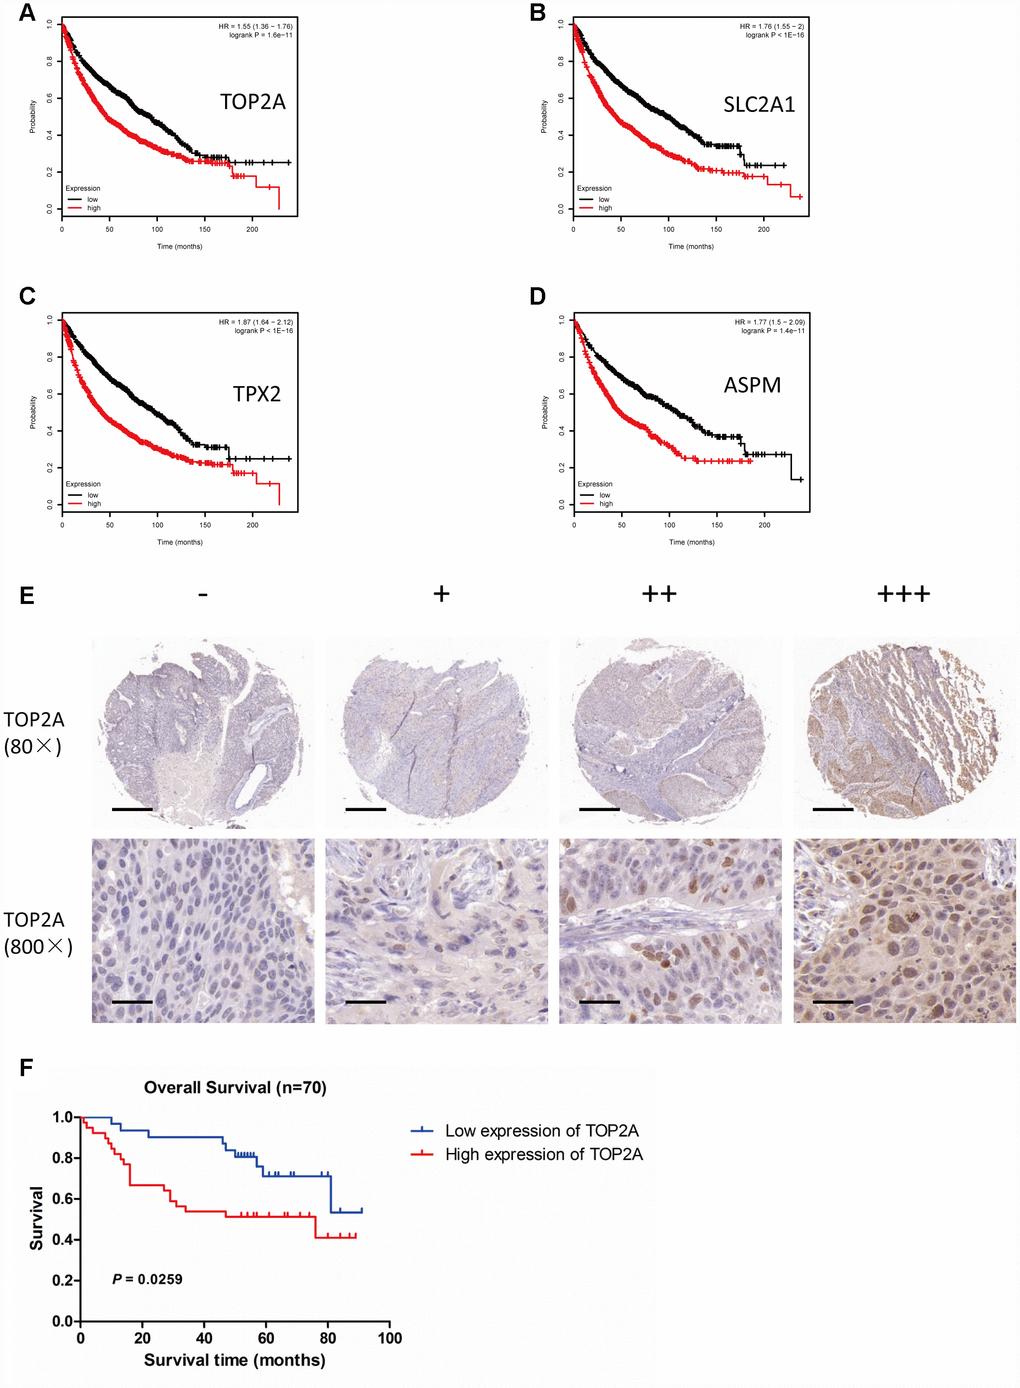
Figure 6. Association of TOP2A, SLC2A1, TPX2, and ASPM with overall survival in patients with lung cancer. Survival analyses were conducted using the Kaplan Meier plotter tool. (A) OS based on high vs low TOP2A expression (P = 1.6e-11). (B) OS based on high vs low SLC2A1 expression (P < 1e-16). (C) OS based on high vs low TPX2 expression (P < 1e-16). (D) OS based on high vs low ASPM expression (P = 1.4e-11). (E) IHC analysis of TOP2A expression in NSCLC (80X and 800X magnifications). (F) OS of NSCLC patients with high or low TOP2A protein expression (P = 0.0259).
To confirm the relationship between TOP2A (the most significantly upregulated DEG) and patient prognosis, we analyzed TOP2A protein expression in a tissue microarray (TMA) of NSCLC samples by immunohistochemistry (IHC). TOP2A signal localized mainly in the nucleus and to a lesser extent in the cytoplasm of tumor cells. TOP2A immunoreactivity was next categorized into four levels, i.e. “-”, “+”, “++”, and “+++”, according to the intensity and density of TOP2A-positive cells in each sample (Figure 6E). Using sample-associated clinical data, Kaplan-Meier analysis confirmed that patients with high TOP2A expression had significantly worse OS (P = 0.0259) (Figure 6F). These results strongly suggest that assessment of TOP2A expression, at the protein and/or mRNA levels, could be a valuable aid for NSCLC prognosis evaluation.
To further investigate the possible impact of TOP2A expression on lung cancer, we analyzed the relationship between TOP2A expression and clinical characteristics of lung cancer patients in the Kaplan-Meier plotter databases (Table 1). High TOP2A expression was significantly associated with poor OS in both female (P = 1.3e-05) and male (P = 5.8e-06) patients. In addition, high TOP2A expression was associated with poor OS in Stage 1 (P = 9.6e-08), Stage T1 (P = 7.6e-05), Stage N0 (P = 3.6e-04), and Stage M0 (P = 3.2e-05) patients. These results indicated that TOP2A expression levels can inform prognosis in early-stage lung cancer patients. Therefore, we propose that TOP2A may serve as an efficient survival biomarker to significantly improve the prediction of NSCLC prognosis.
Table 1. Correlation of TOP2A mRNA expression and clinical prognosis in lung cancer for different clinicopathological factors.
| Clinicopathological characteristic | Overall survival (n = 1926) | ||||||||||||||||||||||||||||||||||||||||||||||||||||||||||||||||||||||||||||||||||||||||||||||||||
| N | Hazard ratio | P | |||||||||||||||||||||||||||||||||||||||||||||||||||||||||||||||||||||||||||||||||||||||||||||||||
| Gender | |||||||||||||||||||||||||||||||||||||||||||||||||||||||||||||||||||||||||||||||||||||||||||||||||||
| Female | 715 | 1.68(1.33-2.13) | 1.3E-05 | ||||||||||||||||||||||||||||||||||||||||||||||||||||||||||||||||||||||||||||||||||||||||||||||||
| Male | 1100 | 1.44(1.23-1.69) | 5.8E-06 | ||||||||||||||||||||||||||||||||||||||||||||||||||||||||||||||||||||||||||||||||||||||||||||||||
| Smoking | |||||||||||||||||||||||||||||||||||||||||||||||||||||||||||||||||||||||||||||||||||||||||||||||||||
| Yes | 820 | 1.37(1.11-1.68) | 0.0031 | ||||||||||||||||||||||||||||||||||||||||||||||||||||||||||||||||||||||||||||||||||||||||||||||||
| No | 205 | 1.38(0.79-2.41) | 0.26 | ||||||||||||||||||||||||||||||||||||||||||||||||||||||||||||||||||||||||||||||||||||||||||||||||
| Grade | |||||||||||||||||||||||||||||||||||||||||||||||||||||||||||||||||||||||||||||||||||||||||||||||||||
| I | 201 | 1.09(0.76-1.56) | 0.63 | ||||||||||||||||||||||||||||||||||||||||||||||||||||||||||||||||||||||||||||||||||||||||||||||||
| II | 310 | 1.23(0.9-1.69) | 0.19 | ||||||||||||||||||||||||||||||||||||||||||||||||||||||||||||||||||||||||||||||||||||||||||||||||
| III | 77 | 1.24(0.64-2.4) | 0.52 | ||||||||||||||||||||||||||||||||||||||||||||||||||||||||||||||||||||||||||||||||||||||||||||||||
| Stage | |||||||||||||||||||||||||||||||||||||||||||||||||||||||||||||||||||||||||||||||||||||||||||||||||||
| 1 | 577 | 2.14(1.61-2.85) | 9.6E-08 | ||||||||||||||||||||||||||||||||||||||||||||||||||||||||||||||||||||||||||||||||||||||||||||||||
| 2 | 244 | 0.97(0.67-1.4) | 0.88 | ||||||||||||||||||||||||||||||||||||||||||||||||||||||||||||||||||||||||||||||||||||||||||||||||
| 3 | 70 | 0.96(0.56-1.66) | 0.89 | ||||||||||||||||||||||||||||||||||||||||||||||||||||||||||||||||||||||||||||||||||||||||||||||||
| 4 | 4 | - | - | ||||||||||||||||||||||||||||||||||||||||||||||||||||||||||||||||||||||||||||||||||||||||||||||||
| AJCC Stage T | |||||||||||||||||||||||||||||||||||||||||||||||||||||||||||||||||||||||||||||||||||||||||||||||||||
| 1 | 437 | 1.78(1.33-2.39) | 7.6E-05 | ||||||||||||||||||||||||||||||||||||||||||||||||||||||||||||||||||||||||||||||||||||||||||||||||
| 2 | 589 | 1.3(1.04-1.63) | 0.02 | ||||||||||||||||||||||||||||||||||||||||||||||||||||||||||||||||||||||||||||||||||||||||||||||||
| 3 | 81 | 1.35(0.82-2.24) | 0.24 | ||||||||||||||||||||||||||||||||||||||||||||||||||||||||||||||||||||||||||||||||||||||||||||||||
| 4 | 46 | 1.02(0.54-1.91) | 0.95 | ||||||||||||||||||||||||||||||||||||||||||||||||||||||||||||||||||||||||||||||||||||||||||||||||
| AJCC Stage N | |||||||||||||||||||||||||||||||||||||||||||||||||||||||||||||||||||||||||||||||||||||||||||||||||||
| 0 | 781 | 1.47(1.19-1.81) | 3.6E-04 | ||||||||||||||||||||||||||||||||||||||||||||||||||||||||||||||||||||||||||||||||||||||||||||||||
| 1 | 252 | 1.34(0.98-1.84) | 0.064 | ||||||||||||||||||||||||||||||||||||||||||||||||||||||||||||||||||||||||||||||||||||||||||||||||
| 2 | 111 | 0.96(0.64-1.44) | 0.84 | ||||||||||||||||||||||||||||||||||||||||||||||||||||||||||||||||||||||||||||||||||||||||||||||||
| AJCC Stage M | |||||||||||||||||||||||||||||||||||||||||||||||||||||||||||||||||||||||||||||||||||||||||||||||||||
| 0 | 681 | 1.55(1.26-1.91) | 3.2E-05 | ||||||||||||||||||||||||||||||||||||||||||||||||||||||||||||||||||||||||||||||||||||||||||||||||
| 1 | 10 | - | - | ||||||||||||||||||||||||||||||||||||||||||||||||||||||||||||||||||||||||||||||||||||||||||||||||
| OS analyses were conducted using the Kaplan-Meier plotter online platform. | |||||||||||||||||||||||||||||||||||||||||||||||||||||||||||||||||||||||||||||||||||||||||||||||||||
TOP2A expression correlates with immune infiltration in NSCLC
Tumor-infiltrating immune cells may restrict or promote tumor growth and thus play a critical role in tumor development. Therefore, we investigated the relationship between TOP2A expression and immune infiltration in NSCLC using Tumor IMmune Estimation Resource (TIMER), which allows systematic analysis of immune infiltrates across diverse cancer types (https://cistrome.shinyapps.io/timer/). Six immune cell types (B cells, CD4+ T cells, CD8+ T cells, neutrophils, macrophages, and DCs) were assessed by TIMER against TCGA lung cancer datasets. Results showed a slight correlation of TOP2A expression with B cells (partial.cor = -0.137, P = 2.48e-03), CD4+ T cells (partial.cor = -0.128, P = 4.65e-03), CD8+ T cells (partial.cor = 0.09, P = 4.65e-02), and neutrophils (partial.cor = 0.105, P = 2.10e-02) in LUAD, and with macrophages (partial.cor = -0.225, P = 7.16e-07) and DCs (partial.cor = -0.1, P = 2.93e-02) in LUSC (Figure 7). The further define the correlation between TOP2A expression and immune infiltrates in lung cancer, gene markers of tumor-infiltrating immune cells were also evaluated. Again, slight correlations with TOP2A levels were determined for gene markers of B cells, CD4+ T cells, CD8+ T cells, neutrophils, macrophages, and DCs (Figure 8A–8F). Especially, we detected a more significant negative correlation between TOP2A expression and gene markers of DCs in LUSC (HLA-DPA1: cor = -0.265, P = 2.08e-09; HLA-DPB1: cor = -0.3, P = 9.02e-12; HLA-DQB1: cor = -0.268, P = 1.23e-09; HLA-DRA: cor = -0.27, P = 1e-09; CD1C: cor = -0.346, P = 1.62e-15; NRP1: cor = -0.281, P = 1.69e-10; ITGAX: cor = -0.27, P = 7.71e-10) (Figure 8F). Therefore, we speculate that TOP2A overexpression might influence antitumor immune responses in the NSCLC microenvironment.
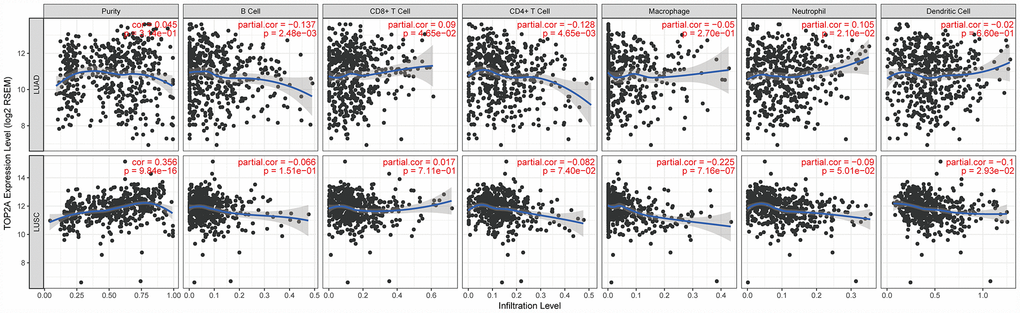
Figure 7. Correlation of TOP2A expression with immune cell infiltration levels in LUAD and LUSC. Tumor-infiltrating immune cells included B cells, CD4+ T cells, CD8+ T cells, neutrophils, macrophages, and DCs. Gene expression levels against tumor purity are displayed in the left-most panel.
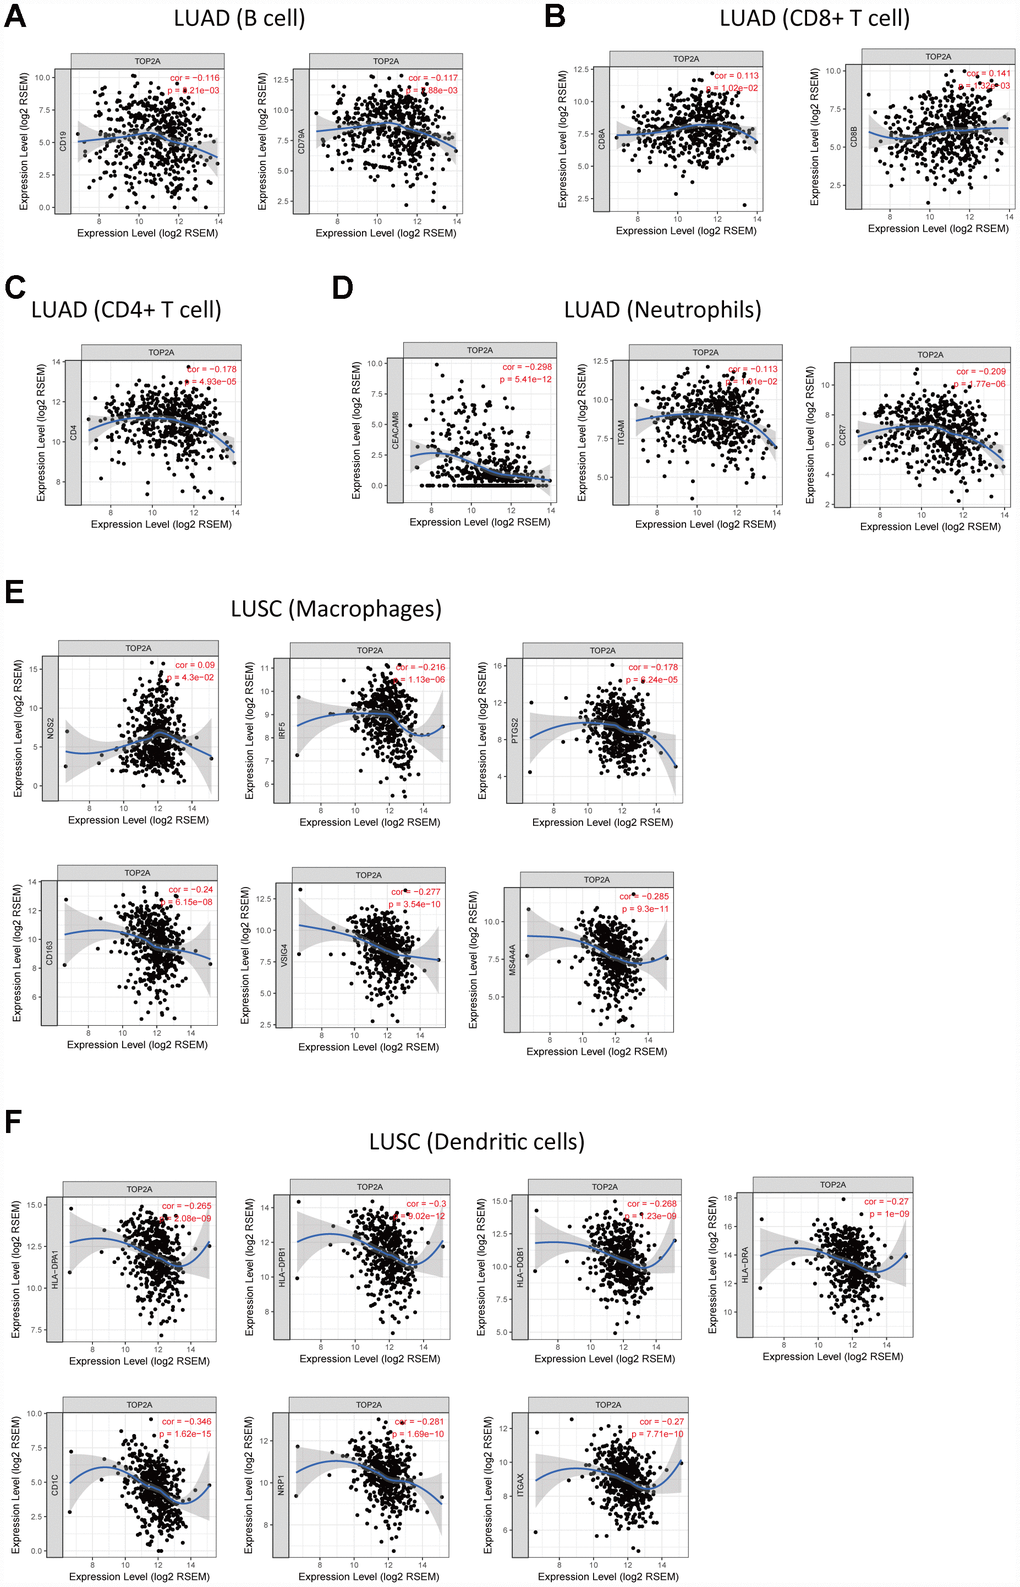
Figure 8. Correlation of TOP2A expression with gene markers of tumor-infiltrating immune cells in NSCLC. (A) Correlation with gene markers of B cells in LUAD. (B) Correlation with gene markers of CD8+ T cells in LUAD. (C) Correlation with gene markers of CD4+ T cells in LUAD. (D) Correlation with gene markers of neutrophils in LUAD. (E) Correlation with gene markers of macrophages in LUSC. (F) Correlation with gene markers of DCs in LUSC.
Discussion
Among all malignant tumors, lung cancer currently carries the highest incidence (11.6%) and mortality rate (18.4%) in the world. [9]. Although it is widely recognized that new cancer cases could be avoided by eliminating or reducing exposure to known lifestyle and environmental risk factors [10], the current burden of lung cancer requires urgent efforts to identify key genes with diagnostic and prognostic significance.
Our study interrogated 60 NSCLC samples and 9 matched normal lung controls in a GEO dataset to identify DEGs in NSCLC. A total of 118 genes (11 upregulated and 107 downregulated) were identified as DEGs. GO analysis showed that most of these DEGs were related to structures or functional processes affecting the extracellular space/matrix, suggestive of diverse roles in the tumor microenvironment. Association with GO ‘glycosaminoglycan binding’ molecular function, as well as GO ‘oxygen-containing compound’ and ‘wound healing’ biological processes indicated the DEGs’ involvement in the anti-inflammatory response. These findings were supported by KEGG pathway analysis, which showed significant correlations with the complement system.
In general, the genes that were highly expressed in tumor tissues had known tumor-promoting effects, while the lowly expressed genes generally mediate tumor-suppressing effects. For validation analysis, we focused on putative tumor-promoting genes, which are more directly targetable and have therefore greater potential clinical applicability. Overall, our qPCR assays on 17 independent NSCLC samples confirmed that all the upregulated DEGs in the GEO dataset were also expressed at higher levels in our NSCLC samples, compared to matched non-tumor controls. However, mRNA overexpression in our NSCLC cohort was only significant for TOP2A, SLC2A1, TPX2, and ASPM. We speculate that increasing sampling size may still lead to validation of more DEGs. In addition, GEPIA analysis demonstrated that TOP2A, SLC2A1, TPX2, and ASPM were upregulated in clinical samples from two major subtypes of NSCLC, i.e. LUAD and LUSC, which stresses the potential relevance of these DEGs in NSCLC development and/or progression. Moreover, these findings are partially supported by a previous gene expression profiling study that identified TOP2A and TPX2 as putative biomarkers of NSCLC [11].
The TOP2A gene is located at 17q12-21 and encodes the human topoisomerase IIα (TOPIIα), which mediates DNA decatenation by rejoining DNA double strand breaks to separate entangled sister chromatides during cell division [12, 13]. TOP2A is highly expressed in dividing cells, and is considered as a proliferation marker in both normal and tumor cells. TOP2A is highly expressed in esophageal, liver, gastric, breast, and colorectal cancers. In breast cancer, high expression of TOP2A is associated with low expression of estrogen receptor (ER) and high expression of Ki-67, and was proposed to be an important prognostic molecular indicator [12, 14–18]. The SLC2A1 gene encodes GLUT1, a glucose transporter that mediates a rate-limiting step for glucose metabolism in cancer cells [19–21]. SLC2A1 is considered an early marker of malignant tumors, overexpressed in esophageal squamous cell carcinoma, gastric carcinoma, and colon cancer, among others, often in association with poor prognosis [22–25]. The TPX2 gene is located at 20q11.2 and encodes a microtubule-associated protein involved in spindle assembly during cell mitosis. TPX2 overexpression is common to many tumor types. In hepatocellular carcinoma, it was correlated with increased proliferation, apoptosis inhibition, and induction of EMT [26]. In breast cancer, TPX2 silencing repressed PI3K/AKT and activated p53 signaling, which inhibited proliferation and promoted apoptosis [27]. The ASPM gene, located at 1q31, encodes a 3477 amino-acid-long protein involved in mitotic spindle regulation and DNA double-strand break repair. ASPM overexpression has been associated with the development of various tumors [28, 29]. In hepatocellular carcinoma, ASPM was suggested to be a novel marker for vascular invasion, early recurrence, and poor prognosis [28]. In prostate cancer, high ASPM expression correlated with tumor progression and predicted poor outcome [29]. Altogether, the above findings from diverse tumor types are consistent with our expression data and our PPI network results, suggesting that TOP2A, TPX2, and ASPM function interconnectedly to increase mitotic rate in tumor cells. In subsequent studies, TOP2A-, TPX2-, and ASPM-specific knockout cell and animal models could be used to validate the contribution of each gene to NSCLC progression and survival.
Our survival analyses on the Kaplan-Meir plotter tool indicated that upregulation of TOP2A, SLC2A1, TPX2, and ASPM independently predicted poor OS in NSCLC patients. Moreover, for TOP2A, high expression was associated with poor OS in Stage 1, Stage T1, Stage N0, and Stage M0 NSCLC patients. An association between TOP2A and poor OS was further confirmed by assessing protein expression by IHC in a NSCLC TMA. These results indicated that TOP2A expression levels may aid prognosis evaluation in early-stage lung cancer patients.
The role of TOP2A in development/progression of NSCLC is still unclear. Since our GO and KEGG enrichment analyses indicated that the identified DEGs were also involved in immune responses, we assessed molecular markers of tumor-infiltrating immune cells, which critically affect early anti-tumor responses and often sustain tumor growth through immuno-suppressive actions. TOP2A expression was slightly correlated with B cells, CD4+ T cells, CD8+ T cells, and neutrophils in LUAD, and with macrophages and DCs in LUSC. In particular, a more significant negative correlation between TOP2A expression and HLA-complex members, CD1C, NRP1, and ITGAX expression in DCs was detected in LUSC. Since DCs are crucial antigen presenting cells (APCs) that trigger T-cell mediated antitumor immunity [30], impaired function of tumor-infiltrating DCs may seriously affect the body's anti-tumor immune response. Although further proof is clearly needed to establish a causal relationship, these data suggest that TOP2A overexpression may impair DC-mediated anti-tumor immune response in NSCLC.
In summary, through bioinformatics analyses we showed that TOP2A, SLC2A1, TPX2, and ASPM are overexpressed in NSCLC and show significant association with poor OS. As cell-cycle dependent proteins with interrelated functions, TOP2A, TPX2, and ASPM play key roles in the mitotic machinery that drives tumor cell replication in NSCLC and other tumor types. Further analysis confirmed that TOP2A expression was correlated with the prognosis of early-stage lung cancer patients and was negatively correlated with immune cell infiltration in NSCLC, especially of DCs. Thus, our study provided a potential biomarker dataset for NSCLC prognosis and suggested that TOP2A, in particular, may be a valuable survival biomarker to improve prognostic efforts and possibly guide new therapeutic developments for NSCLC.
Materials and Methods
GEO dataset
The GEO dataset GSE103512 [31] was selected for our study. The platform for GSE103512 is GPL13158, [HT_HG-U133_Plus_PM] Affymetrix HT HG-U133+ PM Array, which includes 280 formalin-fixed, paraffin embedded normal and tumor samples of four cancer types (breast, colorectal, prostate, and non-small cell lung cancer). The array contains 65 breast cancer samples with 10 matched normal samples; 57 colorectal cancer samples with 12 matched normal samples; 60 NSCLC samples with 9 matched normal samples; and 60 prostate cancer samples with 7 matched normal samples. We only analyzed NSCLC samples and their matched controls for DEG identification.
Identification of DEGs
Gene expression analysis of NSCLC and matched normal tissues was performed with the GEO2R tool (https://www.ncbi.nlm.nih.gov/geo/geo2r/?acc=GSE103512). DEGs were sorted by log2FC > 1.5 or < -1.5 and p < 0.01.
Enrichment analysis
GO enrichment and KEGG pathway analyses were performed using DAVID v6.8 (https://david.ncifcrf.gov/), an online set of functional annotation tools to infer biological activities for large gene lists [32, 33]. P < 0.05 denoted statistical significance.
RNA extraction and qPCR analysis
For qPCR validation of DEGs defined in the GEO dataset GSE103512, 17 paired NSCLC and adjacent non-tumor lung samples were collected from patients who underwent surgery in the Department of Thoracic Surgery (Tangdu Hospital, Fourth Military Medical University). The study was approved by the Ethics Committee of First Affiliated Hospital of Fourth Military Medical University (KY20183327-1). Total RNA was extracted from samples using Total RNA Kit II (Omega Bio-tek, GA, USA) following manufacturer’s instructions, and then reversely transcribed to cDNA using the PrimeScript RT Reagent Kit (TaKaRa, Kusatsu, Japan). qPCR was carried out using the SYBR Premix Ex Taq II Kit (TaKaRa, Kusatsu, Japan). PCR primers are listed in Table 2.
Table 2. Sequences of PCR primers.
| Primer | Sequence |
| TOP2A-Forward Primer | ACCATTGCAGCCTGTAAATGA |
| TOP2A-Reverse Primer | GGGCGGAGCAAAATATGTTCC |
| MMP12-Forward Primer | CATGAACCGTGAGGATGTTGA |
| MMP12-Reverse Primer | GCATGGGCTAGGATTCCACC |
| SPP1-Forward Primer | CTCCATTGACTCGAACGACTC |
| SPP1-Reverse Primer | CAGGTCTGCGAAACTTCTTAGAT |
| MMP1-Forward Primer | AAAATTACACGCCAGATTTGCC |
| MMP1-Reverse Primer | GGTGTGACATTACTCCAGAGTTG |
| UBE2C-Forward Primer | GACCTGAGGTATAAGCTCTCGC |
| UBE2C-Reverse Primer | TTACCCTGGGTGTCCACGTT |
| SLC2A1-Forward Primer | GGCCAAGAGTGTGCTAAAGAA |
| SLC2A1-Reverse Primer | ACAGCGTTGATGCCAGACAG |
| TPX2-Forward Primer | ATGGAACTGGAGGGCTTTTTC |
| TPX2-Reverse Primer | TGTTGTCAACTGGTTTCAAAGGT |
| DSP-Forward Primer | GCAGGATGTACTATTCTCGGC |
| DSP-Reverse Primer | CCTGGATGGTGTTCTGGTTCT |
| ASPM-Forward Primer | GGCCCTAGACAACCCTAACGA |
| ASPM-Reverse Primer | AGCTTGGTGTTTCAGAACATCA |
| RRM2-Forward Primer | CACGGAGCCGAAAACTAAAGC |
| RRM2-Reverse Primer | TCTGCCTTCTTATACATCTGCCA |
| IGFBP3-Forward Primer | AGAGCACAGATACCCAGAACT |
| IGFBP3-Reverse Primer | GGTGATTCAGTGTGTCTTCCATT |
| GAPDH-Forward Primer | GCACCGTCAAGGCTGAGAAC |
| GAPDH-Reverse Primer | TGGTGAAGACGCCAGTGGA |
GEPIA-based analysis of RNA-sequencing expression data
GEPIA [34] is a newly developed interactive web server for analyzing RNA-Seq expression data of 9,736 tumors and 8,587 normal samples from TCGA and GTEx projects using a standard processing pipeline (http://gepia.cancer-pku.cn/index.html). It is developed by Zefang Tang, Chenwei Li, and Boxi Kang (Zhang Lab, Peking University), and provides customizable functions such as differential expression analysis, profiling according to cancer type or pathological stage, patient survival analysis, similar gene detection, and correlation and dimensionality reduction analyses. We selected NSCLC specimens and normal lung tissues for differential expression analysis, and DEGs for correlation analysis. The Spearman method was used to determine significant correlations.
PPI network analysis
PPI network analysis was performed on DEGs using STRING software (https://string-db.org/) [35].
Survival analysis
The Kaplan Meier plotter [36, 37] (http://kmplot.com/analysis/) is an open source software that allows to assess the effect of 54,000 genes on survival in 21 cancer types. TOP2A, SLC2A1, TPX2, and ASPM were the DEGs selected for validation as survival biomarkers by the Kaplan Meier plotter. OS was calculated using Kaplan-Meier analysis and log-rank test.
Immunohistochemistry
A TMA of 90 NSCLC and matched normal samples was purchased from Shanghai Biochip Company (Shanghai, China). Twenty paired samples were excluded from analysis owing to incomplete patient information and/or sample absence. Therefore, IHC was performed as reported previously [4] on 70 matched specimens. Paraffin sections were dewaxed, followed by antigen retrieval with Tris-EDTA buffer (pH 9). Deparaffinized sections were treated with methanol containing 3% hydrogen peroxide for 15 min, washed with PBS, and incubated with blocking serum for 30 min. Then, sections were incubated with anti-TOP2A (66541-1-Ig, Proteintech, USA) diluted 1:100, at 4°C overnight. Immunoperoxidase staining was conducted using a streptavidin-peroxidase kit and 3,3′-diaminobenzidine (Zhongshan Jinqiao Co., Beijing, China). Hematoxylin was used to counterstain the nuclei. Intensity and density of TOP2A-positive cells was evaluated and scored as reported before [4].
TIMER analysis
TIMER (https://cistrome.shinyapps.io/timer/) [38, 39] is a comprehensive resource for systematic analysis of immune infiltrates across diverse cancer types using RNA-Seq expression profiling data. Six immune cell types (B cells, CD4+ T cells, CD8+ T cells, neutrophils, macrophages, and dendritic cells) were assessed by TIMER on NSCLC sample data, and the correlation between TOP2A expression and immune infiltration was determined. In addition, we assessed the correlations between TOP2A expression and gene markers of tumor-infiltrating immune cells [40].
Statistical analysis
Data were analyzed using GraphPad Prism 5.0. Expression levels of DEGs between NSCLC and matched normal tissues were compared by paired two-tailed t-test. OS was calculated using Kaplan-Meier analysis and log-rank test. P < 0.05 was considered significant.
Supplementary Materials
Acknowledgments
We thank Rui-Rui Yao and Wen Wen for providing experimental guidance.
Conflicts of Interest
The authors declare that they have no conflicts of interest to disclose.
Funding
This work was supported by the National Natural Science Foundation of China (81872482).
References
- 1. Li J, Shen C, Wang X, Lai Y, Zhou K, Li P, Liu L, Che G. Prognostic value of TGF-β in lung cancer: systematic review and meta-analysis. BMC Cancer. 2019; 19:691. https://doi.org/10.1186/s12885-019-5917-5 [PubMed]
- 2. Strand TE, Rostad H, Møller B, Norstein J. Survival after resection for primary lung cancer: a population based study of 3211 resected patients. Thorax. 2006; 61:710–15. https://doi.org/10.1136/thx.2005.056481 [PubMed]
- 3. Miller KD, Nogueira L, Mariotto AB, Rowland JH, Yabroff KR, Alfano CM, Jemal A, Kramer JL, Siegel RL. Cancer treatment and survivorship statistics, 2019. CA Cancer J Clin. 2019; 69:363–85. https://doi.org/10.3322/caac.21565 [PubMed]
- 4. Wang K, Li H, Chen R, Zhang Y, Sun XX, Huang W, Bian H, Chen ZN. Combination of CALR and PDIA3 is a potential prognostic biomarker for non-small cell lung cancer. Oncotarget. 2017; 8:96945–57. https://doi.org/10.18632/oncotarget.18547 [PubMed]
- 5. Burotto M, Thomas A, Subramaniam D, Giaccone G, Rajan A. Biomarkers in early-stage non-small-cell lung cancer: current concepts and future directions. J Thorac Oncol. 2014; 9:1609–17. https://doi.org/10.1097/JTO.0000000000000302 [PubMed]
- 6. Keerthikumar S. An Introduction to Proteome Bioinformatics. Methods Mol Biol. 2017; 1549:1–3. https://doi.org/10.1007/978-1-4939-6740-7_1 [PubMed]
- 7. Falzone L, Lupo G, La Rosa GR, Crimi S, Anfuso CD, Salemi R, Rapisarda E, Libra M, Candido S. Identification of Novel MicroRNAs and Their Diagnostic and Prognostic Significance in Oral Cancer. Cancers (Basel). 2019; 11:11. https://doi.org/10.3390/cancers11050610 [PubMed]
- 8. Jia D, Li S, Li D, Xue H, Yang D, Liu Y. Mining TCGA database for genes of prognostic value in glioblastoma microenvironment. Aging (Albany NY). 2018; 10:592–605. https://doi.org/10.18632/aging.101415 [PubMed]
- 9. Bray F, Ferlay J, Soerjomataram I, Siegel RL, Torre LA, Jemal A. Global cancer statistics 2018: GLOBOCAN estimates of incidence and mortality worldwide for 36 cancers in 185 countries. CA Cancer J Clin. 2018; 68:394–424. https://doi.org/10.3322/caac.21492 [PubMed]
- 10. Islami F, Goding Sauer A, Miller KD, Siegel RL, Fedewa SA, Jacobs EJ, McCullough ML, Patel AV, Ma J, Soerjomataram I, Flanders WD, Brawley OW, Gapstur SM, Jemal A. Proportion and number of cancer cases and deaths attributable to potentially modifiable risk factors in the United States. CA Cancer J Clin. 2018; 68:31–54. https://doi.org/10.3322/caac.21440 [PubMed]
- 11. Visser S, Hou J, Bezemer K, de Vogel LL, Hegmans JP, Stricker BH, Philipsen S, Aerts JG. Prediction of response to pemetrexed in non-small-cell lung cancer with immunohistochemical phenotyping based on gene expression profiles. BMC Cancer. 2019; 19:440. https://doi.org/10.1186/s12885-019-5645-x [PubMed]
- 12. Jain CK, Roychoudhury S, Majumder HK. Selective killing of G2 decatenation checkpoint defective colon cancer cells by catalytic topoisomerase II inhibitor. Biochim Biophys Acta. 2015; 1853:1195–204. https://doi.org/10.1016/j.bbamcr.2015.02.021 [PubMed]
- 13. Mirski SE, Bielawski JC, Cole SP. Identification of functional nuclear export sequences in human topoisomerase IIalpha and beta. Biochem Biophys Res Commun. 2003; 306:905–11. https://doi.org/10.1016/S0006-291X(03)01077-5 [PubMed]
- 14. Sudan S, Rupasinghe HP. Quercetin-3-O-glucoside induces human DNA topoisomerase II inhibition, cell cycle arrest and apoptosis in hepatocellular carcinoma cells. Anticancer Res. 2014; 34:1691–99. [PubMed]
- 15. Liu HQ, Zhang SL, Song S. HER-2/neu and TOPIIa expression in gastric cancer reflect disease severity. Hepatogastroenterology. 2012; 59:1290–93. https://doi.org/10.5754/hge11844 [PubMed]
- 16. Hanagiri T, Ono K, Kuwata T, Takenaka M, Oka S, Chikaishi Y, Shigematsu Y, Nagata Y, Shimokawa H, Nakagawa M, Uramoto H, So T, Tanaka F. Evaluation of topoisomerase I/topoisomerase IIalpha status in esophageal cancer. J UOEH. 2011; 33:205–16. https://doi.org/10.7888/juoeh.33.205 [PubMed]
- 17. Tokiniwa H, Horiguchi J, Takata D, Kikuchi M, Rokutanda N, Nagaoka R, Sato A, Odawara H, Tozuka K, Oyama T, Takeyoshi I. Topoisomerase II alpha expression and the Ki-67 labeling index correlate with prognostic factors in estrogen receptor-positive and human epidermal growth factor type-2-negative breast cancer. Breast Cancer. 2012; 19:309–14. https://doi.org/10.1007/s12282-011-0291-4 [PubMed]
- 18. Panvichian R, Tantiwetrueangdet A, Angkathunyakul N, Leelaudomlipi S. TOP2A amplification and overexpression in hepatocellular carcinoma tissues. Biomed Res Int. 2015; 2015:381602. https://doi.org/10.1155/2015/381602 [PubMed]
- 19. Wang J, Ye C, Chen C, Xiong H, Xie B, Zhou J, Chen Y, Zheng S, Wang L. Glucose transporter GLUT1 expression and clinical outcome in solid tumors: a systematic review and meta-analysis. Oncotarget. 2017; 8:16875–86. https://doi.org/10.18632/oncotarget.15171 [PubMed]
- 20. Macheda ML, Rogers S, Best JD. Molecular and cellular regulation of glucose transporter (GLUT) proteins in cancer. J Cell Physiol. 2005; 202:654–62. https://doi.org/10.1002/jcp.20166 [PubMed]
- 21. Szablewski L. Expression of glucose transporters in cancers. Biochim Biophys Acta. 2013; 1835:164–69. https://doi.org/10.1016/j.bbcan.2012.12.004 [PubMed]
- 22. Tohma T, Okazumi S, Makino H, Cho A, Mochizuki R, Shuto K, Kudo H, Matsubara K, Gunji H, Matsubara H, Ochiai T. Overexpression of glucose transporter 1 in esophageal squamous cell carcinomas: a marker for poor prognosis. Dis Esophagus. 2005; 18:185–89. https://doi.org/10.1111/j.1442-2050.2005.00489.x [PubMed]
- 23. Kawamura T, Kusakabe T, Sugino T, Watanabe K, Fukuda T, Nashimoto A, Honma K, Suzuki T. Expression of glucose transporter-1 in human gastric carcinoma: association with tumor aggressiveness, metastasis, and patient survival. Cancer. 2001; 92:634–41. https://doi.org/10.1002/1097-0142(20010801)92:3<634::AID-CNCR1364>3.0.CO;2-X [PubMed]
- 24. Haber RS, Rathan A, Weiser KR, Pritsker A, Itzkowitz SH, Bodian C, Slater G, Weiss A, Burstein DE. GLUT1 glucose transporter expression in colorectal carcinoma: a marker for poor prognosis. Cancer. 1998; 83:34–40. https://doi.org/10.1002/(SICI)1097-0142(19980701)83:1<34::AID-CNCR5>3.0.CO;2-E [PubMed]
- 25. Feng W, Cui G, Tang CW, Zhang XL, Dai C, Xu YQ, Gong H, Xue T, Guo HH, Bao Y. Role of glucose metabolism related gene GLUT1 in the occurrence and prognosis of colorectal cancer. Oncotarget. 2017; 8:56850–57. https://doi.org/10.18632/oncotarget.18090 [PubMed]
- 26. Liang B, Jia C, Huang Y, He H, Li J, Liao H, Liu X, Liu X, Bai X, Yang D. TPX2 Level Correlates with Hepatocellular Carcinoma Cell Proliferation, Apoptosis, and EMT. Dig Dis Sci. 2015; 60:2360–72. https://doi.org/10.1007/s10620-015-3730-9 [PubMed]
- 27. Yang Y, Li DP, Shen N, Yu XC, Li JB, Song Q, Zhang JH. TPX2 promotes migration and invasion of human breast cancer cells. Asian Pac J Trop Med. 2015; 8:1064–70. https://doi.org/10.1016/j.apjtm.2015.11.007 [PubMed]
- 28. Lin SY, Pan HW, Liu SH, Jeng YM, Hu FC, Peng SY, Lai PL, Hsu HC. ASPM is a novel marker for vascular invasion, early recurrence, and poor prognosis of hepatocellular carcinoma. Clin Cancer Res. 2008; 14:4814–20. https://doi.org/10.1158/1078-0432.CCR-07-5262 [PubMed]
- 29. Xie JJ, Zhuo YJ, Zheng Y, Mo RJ, Liu ZZ, Li BW, Cai ZD, Zhu XJ, Liang YX, He HC, Zhong WD. High expression of ASPM correlates with tumor progression and predicts poor outcome in patients with prostate cancer. Int Urol Nephrol. 2017; 49:817–23. https://doi.org/10.1007/s11255-017-1545-7 [PubMed]
- 30. Petersen TR, Dickgreber N, Hermans IF. Tumor antigen presentation by dendritic cells. Crit Rev Immunol. 2010; 30:345–86. https://doi.org/10.1615/CritRevImmunol.v30.i4.30 [PubMed]
- 31. Brouwer-Visser J, Cheng WY, Bauer-Mehren A, Maisel D, Lechner K, Andersson E, Dudley JT, Milletti F. Regulatory T-cell Genes Drive Altered Immune Microenvironment in Adult Solid Cancers and Allow for Immune Contextual Patient Subtyping. Cancer Epidemiol Biomarkers Prev. 2018; 27:103–12. https://doi.org/10.1158/1055-9965.EPI-17-0461 [PubMed]
- 32. Huang W, Sherman BT, Lempicki RA. Systematic and integrative analysis of large gene lists using DAVID bioinformatics resources. Nat Protoc. 2009; 4:44–57. https://doi.org/10.1038/nprot.2008.211 [PubMed]
- 33. Huang W, Sherman BT, Lempicki RA. Bioinformatics enrichment tools: paths toward the comprehensive functional analysis of large gene lists. Nucleic Acids Res. 2009; 37:1–13. https://doi.org/10.1093/nar/gkn923 [PubMed]
- 34. Tang Z, Li C, Kang B, Gao G, Li C, Zhang Z. GEPIA: a web server for cancer and normal gene expression profiling and interactive analyses. Nucleic Acids Res. 2017; 45:W98–102. https://doi.org/10.1093/nar/gkx247 [PubMed]
- 35. Szklarczyk D, Gable AL, Lyon D, Junge A, Wyder S, Huerta-Cepas J, Simonovic M, Doncheva NT, Morris JH, Bork P, Jensen LJ, Mering CV. STRING v11: protein-protein association networks with increased coverage, supporting functional discovery in genome-wide experimental datasets. Nucleic Acids Res. 2019; 47:D607–13. https://doi.org/10.1093/nar/gky1131 [PubMed]
- 36. Nagy Á, Lánczky A, Menyhárt O, Győrffy B. Validation of miRNA prognostic power in hepatocellular carcinoma using expression data of independent datasets. Sci Rep. 2018; 8:9227. https://doi.org/10.1038/s41598-018-27521-y [PubMed]
- 37. Győrffy B, Surowiak P, Budczies J, Lánczky A. Online survival analysis software to assess the prognostic value of biomarkers using transcriptomic data in non-small-cell lung cancer. PLoS One. 2013; 8:e82241. https://doi.org/10.1371/journal.pone.0082241 [PubMed]
- 38. Li T, Fan J, Wang B, Traugh N, Chen Q, Liu JS, Li B, Liu XS. TIMER: A Web Server for Comprehensive Analysis of Tumor-Infiltrating Immune Cells. Cancer Res. 2017; 77:e108–10. https://doi.org/10.1158/0008-5472.CAN-17-0307 [PubMed]
- 39. Li B, Severson E, Pignon JC, Zhao H, Li T, Novak J, Jiang P, Shen H, Aster JC, Rodig S, Signoretti S, Liu JS, Liu XS. Comprehensive analyses of tumor immunity: implications for cancer immunotherapy. Genome Biol. 2016; 17:174. https://doi.org/10.1186/s13059-016-1028-7 [PubMed]
- 40. Pan JH, Zhou H, Cooper L, Huang JL, Zhu SB, Zhao XX, Ding H, Pan YL, Rong L. LAYN Is a Prognostic Biomarker and Correlated With Immune Infiltrates in Gastric and Colon Cancers. Front Immunol. 2019; 10:6. https://doi.org/10.3389/fimmu.2019.00006 [PubMed]