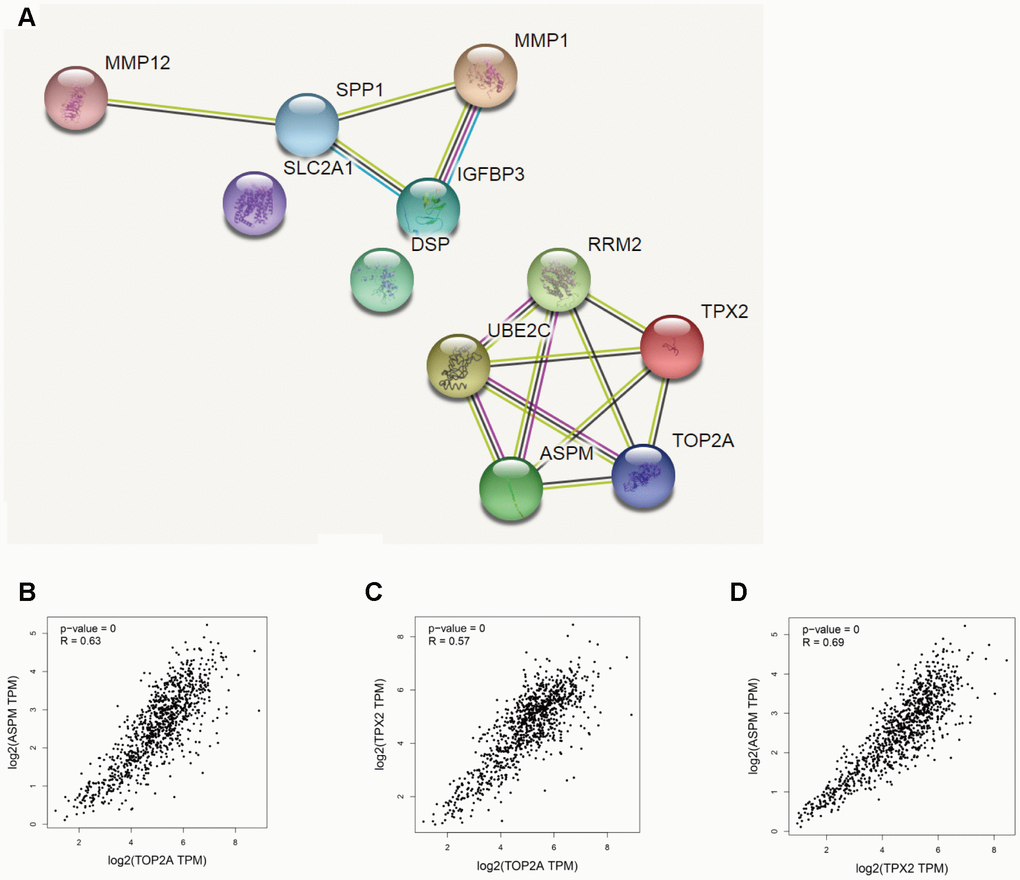
Figure 5.Correlation analysis of DEGs in NSCLC. (A) PPI network of upregulated DEGs. (B–D) Analysis of TOP2A, TPX2, and ASPM by GEPIA’s correlation model. The correlation coefficients for TOP2A & ASPM, TOP2A & TPX2, and TPX2 & ASPM were 0.63, 0.57, and 0.69, respectively (P = 0.000).