Submit an Article
Navigate
Home
Editorial Board
Editorial Policies
Current Volume
Archive
Scientific Integrity
Publication Ethics Statements
Interviews with Outstanding Authors
Newsroom
Sponsored Conferences
Podcast
Contact
Special Collections
Submit an Article
Online ISSN: 1945-4589
Research Paper
|
Volume 11, Issue 23
|
pp. 11170–11185
Identification of differentially expressed genes in non-small cell lung cancer
Back to article
Figure 2
(2 of 8)
−
100%
+
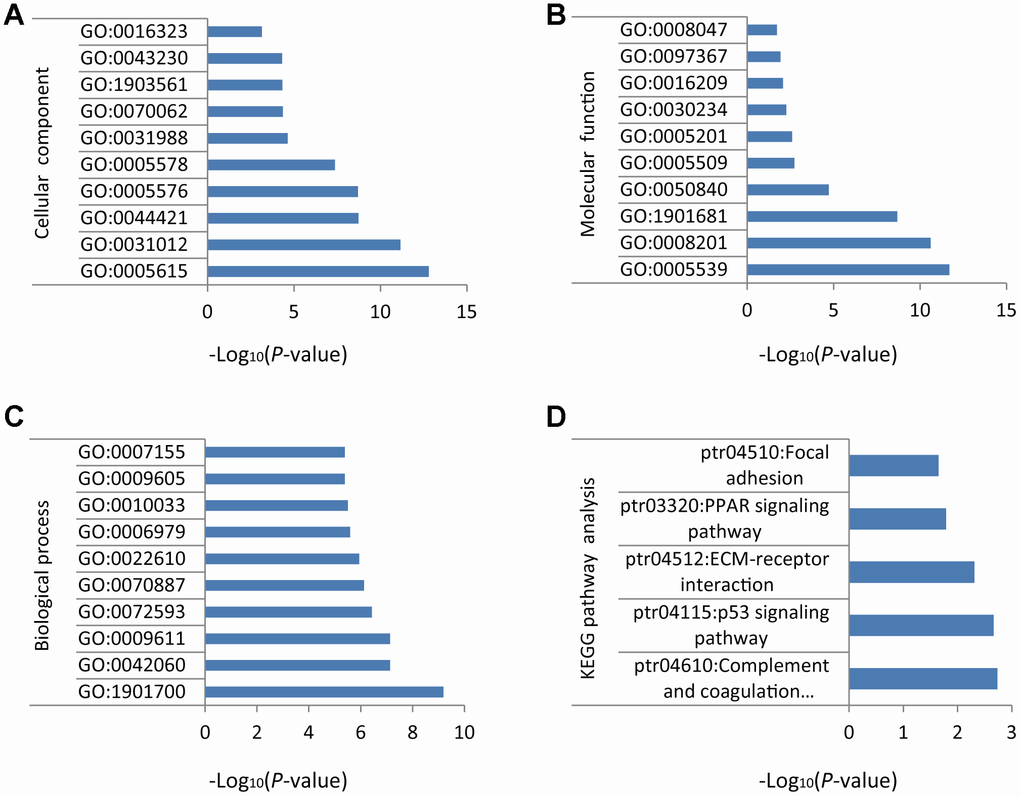
Figure 2.
GO and KEGG enrichment analysis of DEGs in NSCLC.
(
A
) Cellular component. (
B
) Molecular function. (
C
) Biological process. (
D
) Biochemical and signal transduction pathways revealed by KEGG pathway analysis.