


Introduction
Ventricular enlargement occurs in normal elders, patients with some neurodegenerative diseases, such as Alzheimer disease (AD) [1] and Parkinson’s disease (PD) [2], and patients with some psychiatric diseases, such as schizophrenia [3]. The rate of ventricular enlargement was suggested to be a sensitive marker of AD progression [4–6]. And it was increased in the progression from normal cognition to dementia [7]. Moreover, it was increased in PD with mild cognitive impairment (MCI), and it was suggested as a potential marker for PD [8]. Although ventricular enlargement was usually thought as a symbol of brain atrophy, a few studies showed that it was independently heritable [9, 10]. Recently, a large genome-wide association study (GWAS) identified seven genetic loci associated with ventricular volume [11], but no GWAS focused on genetic risk loci associated with the rate of ventricular enlargement.
The GWAS method has been used to discover genetic risk factors. Traditional case-control based GWAS may be confounded by preclinical status before onset of diseases, and the studies focused on genes associated with disease risk rather than with other aspects of diseases such as progression or biomarkers [12]. Endophenotypes are quantitative traits strongly associated with diseases that also share genetic architecture with diseases. Endophenotype-based GWAS can increase statistical power and avoid the limitations of case-control based GWAS [13, 14].
We hypothesized that some genetic loci may be involved in the pathogenesis of neurodegenerative diseases. Thus, to test this hypothesis and based on the role of the rate of ventricular enlargement in neurodegenerative diseases, we conducted a GWAS using the rate of ventricular enlargement as an endophenotype in Alzheimer’s Disease Neuroimaging Initiative (ADNI) cohort to explore more genetic risk loci.
Results
Demographics and the rate of ventricular enlargement
In this study, a total of 507 nondemented non-Hispanic white participants [cognitively normal (CN) = 211, MCI = 339] whose data satisfied all quality control criteria from the ADNI cohort were included after quality control procedures. The details of demographic information and the endophenotype have been shown in Table 1.
Table 1. Demographics and the endophenotype for the GWAS samples.
| CN | MCI | Total | |||||||||||||||||||||||||||||||||||||||||||||||||||||||||||||||||||||||||||||||||||||||||||||||||
| Sample size, n | 196 | 311 | 507 | ||||||||||||||||||||||||||||||||||||||||||||||||||||||||||||||||||||||||||||||||||||||||||||||||
| Age, mean (SD), y | 74.7(5.3) | 72.0(7.3) | 73.0(6.7) | ||||||||||||||||||||||||||||||||||||||||||||||||||||||||||||||||||||||||||||||||||||||||||||||||
| F, n (%) | 99 (51.0) | 115 (37.0) | 214 (42.2) | ||||||||||||||||||||||||||||||||||||||||||||||||||||||||||||||||||||||||||||||||||||||||||||||||
| APOE ε4 carrier, % | 26.5 | 46.3 | 38.7 | ||||||||||||||||||||||||||||||||||||||||||||||||||||||||||||||||||||||||||||||||||||||||||||||||
| Ventricular enlargement rate, mean (SD) | 4.9×10⁻² (3.1×10⁻²) | 6.5×10⁻² (4.9×10⁻²) | 5.9×10⁻² (4.4×10⁻²) | ||||||||||||||||||||||||||||||||||||||||||||||||||||||||||||||||||||||||||||||||||||||||||||||||
| Abbreviations: GWAS: genome-wide association study; CN: cognitively normal; MCI: mild cognitive impairment; SD: standard deviation; F: female. | |||||||||||||||||||||||||||||||||||||||||||||||||||||||||||||||||||||||||||||||||||||||||||||||||||
GWAS results
After adjusting for age, gender, apolipoprotein E (APOE) ε4, total intracranial volume (ICV), magnetic resonance imaging (MRI) scanner type (1.5T versus 3T) at baseline and the first three principal components (PCs), the effect of population stratification was well controlled for (genomic inflation factor λ= 1.00, Supplementary Figure 2). Two single nucleotide polymorphisms (SNPs) (rs11620312, P = 4.04×10⁻⁸; rs79174114, P = 4.28×10⁻⁸) on chromosome 13 were found to have genome-wide significant associations with the rate of ventricular enlargement (Figure 1A and Table 2). Rs11620312 and rs79174114 within the SIAH3 gene are in linkage disequilibrium (LD, r2 = 0.96, D’ = 0.99) (Figure 1B), and after controlling for the rs11620312 genotype, no SNPs showed strong association with the rate of ventricular enlargement (Figure 1C). we regard the rs11620312 was index SNP. Carriers of the minor allele (C) of rs11620312 had increased rates of ventricular enlargement in all subjects (P = 3.26×10⁻⁷), CN group (P =1.23×10⁻⁴) and MCI group (P = 9.08×10⁻⁴) (Figure 2). Although there is no statistical significance, the minor allele (C) of rs11620312 and the minor allele (T) of rs79174114 may be associated with increased trend of SIAH3 expression in brain tissues according to preliminary data from the UKBEC database (Supplementary Figure 3). Suggestive associations of several SNPs with the rate of ventricular enlargement (P < 10-5) were also detected (Figure 1A and Table 2), including two other SNPs in SIAH3, eight intergenic SNPs and six SNPs within NKAIN2, TBC1D2, GALNT18, ABCC1, SRCIN1 genes.
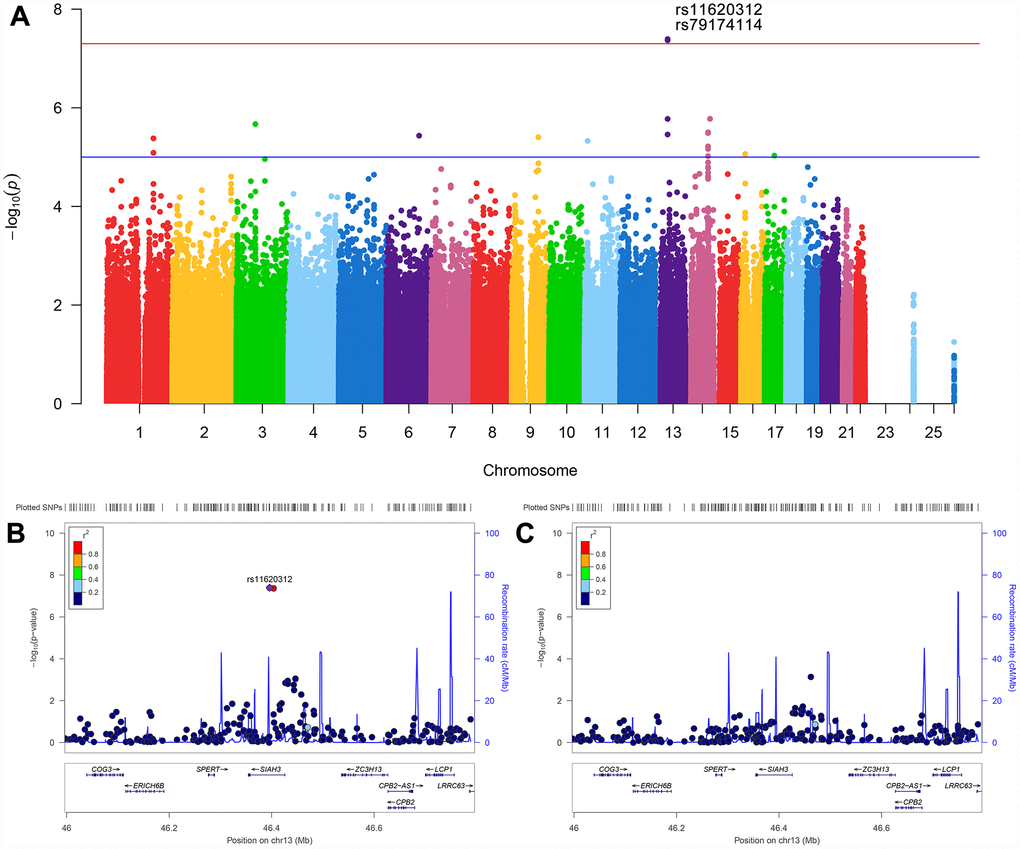
Figure 1. Manhattan plot and regional association plots. (A) Manhattan plot for association with the rate of ventricular enlargement, after adjusting for age, gender, APOE ε4, ICV, MRI scanner type and the first three principal components. The red line is the genome-wide significant threshold at P = 5×10⁻⁸; the blue line is a suggestive threshold at P = 10-5. (B) Regional association plot for rs11620312 in the SIAH3 gene on chromosome 13. (C) Regional association plot for the SIAH3 gene after controlling for rs11620312. No SNPs showed significant association after controlling for rs11620312, suggesting the associations were driven by rs11620312. Abbreviation: ICV = intracranial volume; MRI = magnetic resonance imaging; P = P value.
Table 2. Genome-wide significant and suggestive SNPs associated with the rate of ventricular enlargement.
| CHR | SNP | MA(MAF) | GENE | SNP type | β | P | |||||||||||||||||||||||||||||||||||||||||||||||||||||||||||||||||||||||||||||||||||||||||||||
| 13 | rs11620312 | C (0.12) | SIAH3 | Intron | 0.023 | 4.04×10⁻⁸ | |||||||||||||||||||||||||||||||||||||||||||||||||||||||||||||||||||||||||||||||||||||||||||||
| 13 | rs79174114 | T (0.11) | SIAH3 | Intron | 0.023 | 4.28×10⁻⁸ | |||||||||||||||||||||||||||||||||||||||||||||||||||||||||||||||||||||||||||||||||||||||||||||
| 1 | rs1885646 | A (0.15) | -- | Intergenic | 0.017 | 4.16×10⁻⁶ | |||||||||||||||||||||||||||||||||||||||||||||||||||||||||||||||||||||||||||||||||||||||||||||
| 3 | rs9821691 | G (0.43) | -- | Intergenic | 0.013 | 2.14×10⁻⁶ | |||||||||||||||||||||||||||||||||||||||||||||||||||||||||||||||||||||||||||||||||||||||||||||
| 6 | rs2626129 | C (0.32) | NKAIN2 | Intron | -0.015 | 3.67×10⁻⁶ | |||||||||||||||||||||||||||||||||||||||||||||||||||||||||||||||||||||||||||||||||||||||||||||
| 9 | rs10985425 | G (0.05) | TBC1D2 | Intron | 0.018 | 3.95×10⁻⁶ | |||||||||||||||||||||||||||||||||||||||||||||||||||||||||||||||||||||||||||||||||||||||||||||
| 11 | rs1994399 | G (0.39) | GALNT18 | Intron | 0.012 | 4.69×10⁻⁶ | |||||||||||||||||||||||||||||||||||||||||||||||||||||||||||||||||||||||||||||||||||||||||||||
| 13 | rs11618124 | T (0.33) | SIAH3 | Intron | 0.016 | 1.68×10⁻⁶ | |||||||||||||||||||||||||||||||||||||||||||||||||||||||||||||||||||||||||||||||||||||||||||||
| 13 | rs1998892 | C (0.37) | SIAH3 | Intron | 0.017 | 3.48×10⁻⁶ | |||||||||||||||||||||||||||||||||||||||||||||||||||||||||||||||||||||||||||||||||||||||||||||
| 14 | rs8022233 | T (0.42) | -- | Intergenic | 0.012 | 9.57×10⁻⁶ | |||||||||||||||||||||||||||||||||||||||||||||||||||||||||||||||||||||||||||||||||||||||||||||
| 14 | rs12434273 | C (0.40) | -- | Intergenic | 0.012 | 6.06×10⁻⁶ | |||||||||||||||||||||||||||||||||||||||||||||||||||||||||||||||||||||||||||||||||||||||||||||
| 14 | rs12894449 | G (0.48) | -- | Intergenic | 0.013 | 3.24×10⁻⁶ | |||||||||||||||||||||||||||||||||||||||||||||||||||||||||||||||||||||||||||||||||||||||||||||
| 14 | rs2998298 | A (0.47) | -- | Intergenic | 0.013 | 3.14×10⁻⁶ | |||||||||||||||||||||||||||||||||||||||||||||||||||||||||||||||||||||||||||||||||||||||||||||
| 14 | rs2922629 | T (0.30) | -- | Intergenic | 0.012 | 6.80×10⁻⁶ | |||||||||||||||||||||||||||||||||||||||||||||||||||||||||||||||||||||||||||||||||||||||||||||
| 14 | rs67783323 | G (0.15) | -- | Intergenic | 0.018 | 1.67×10⁻⁶ | |||||||||||||||||||||||||||||||||||||||||||||||||||||||||||||||||||||||||||||||||||||||||||||
| 16 | rs4781701 | C (0.13) | ABCC1 | Intron | 0.015 | 8.67×10⁻⁶ | |||||||||||||||||||||||||||||||||||||||||||||||||||||||||||||||||||||||||||||||||||||||||||||
| 16 | rs12922404 | T (0.12) | ABCC1 | Intron | 0.015 | 8.67×10⁻⁶ | |||||||||||||||||||||||||||||||||||||||||||||||||||||||||||||||||||||||||||||||||||||||||||||
| 17 | rs2075051 | T (0.32) | SRCIN1 | Intron | 0.012 | 9.32×10⁻⁶ | |||||||||||||||||||||||||||||||||||||||||||||||||||||||||||||||||||||||||||||||||||||||||||||
| Note: Two significant SNPs (rs11620312 and rs79174114) were in linkage disequilibrium (r2>0.8). Abbreviation: CHR = chromosome; SNP = single nucleotide polymorphism; MA = minor allele; MAF = minor allele frequency; β = standardized effect size; P = p-value. | |||||||||||||||||||||||||||||||||||||||||||||||||||||||||||||||||||||||||||||||||||||||||||||||||||
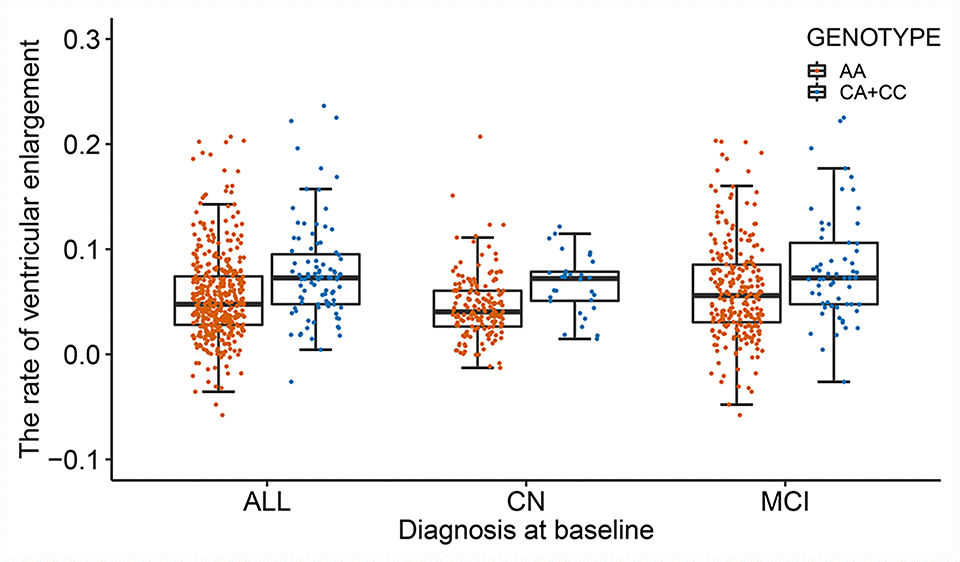
Figure 2. The differences in the rate of ventricular enlargement between the two genotypes in total subjects and each diagnostic group. The minor allele (C) of rs11620312 carriers had increased rates of ventricular enlargement in all subjects (P = 3.26×10⁻⁷), CN group (P =1.23×10⁻⁴) and MCI group (P = 9.08×10⁻⁴). Abbreviations: CN = cognitively normal; MCI = mild cognitive impairment; P = P value.
Association between rs11620312 and other phenotypes
After correcting for multiple comparisons using the Bonferroni procedure, the minor allele (C) of rs11620312 was not associated with memory (MEM) (PBonf = 0.29), executive functioning (EF) (PBonf = 0.32), 18F-fluorodeoxyglucose (FDG) metabolism (PBonf = 0.06) and hippocampus volume (PBonf = 0.26) at baseline (Figure 3). However, it was correlated with accelerated rates of decline in EF (PBonf = 0.037) and FDG (PBonf = 0.029) within 2 years (Figure 4), suggesting that the minor allele (C) of rs11620312 may be associated with accelerated cognitive decline and brain hypometabolism over time.
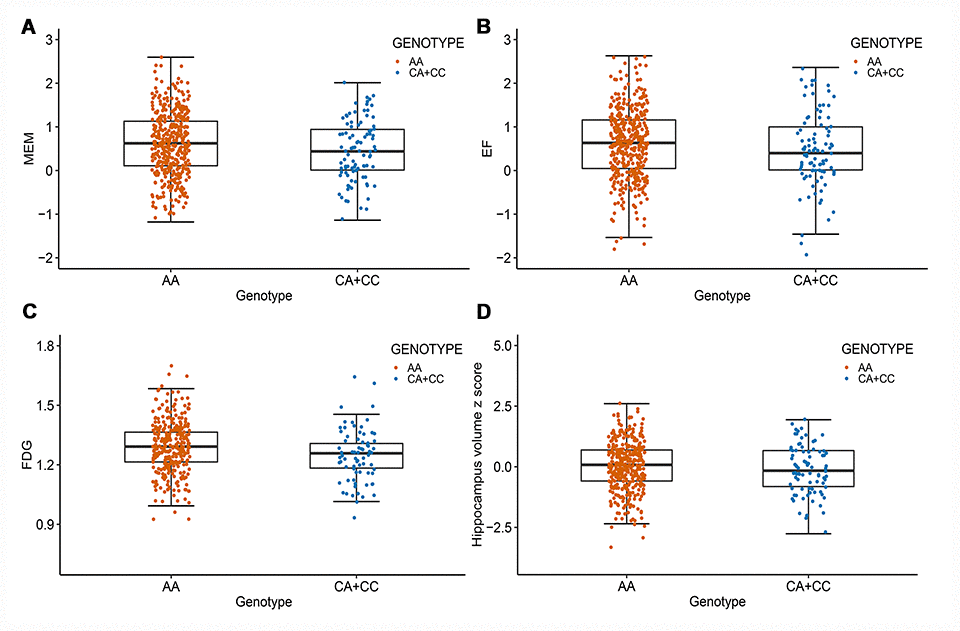
Figure 3. Rs11620312 associated with other phenotypes at baseline. The minor allele (C) of rs11620312 was not associated with MEM (A, PBonf = 0.29), EF (B, PBonf = 0.32), FDG (C, PBonf = 0.06) and hippocampus volume (D, PBonf = 0.26) at baseline. Abbreviation: MEM = cognitive score for memory; EF = cognitive score for executive functioning; FDG = 18F-fluorodeoxyglucose.
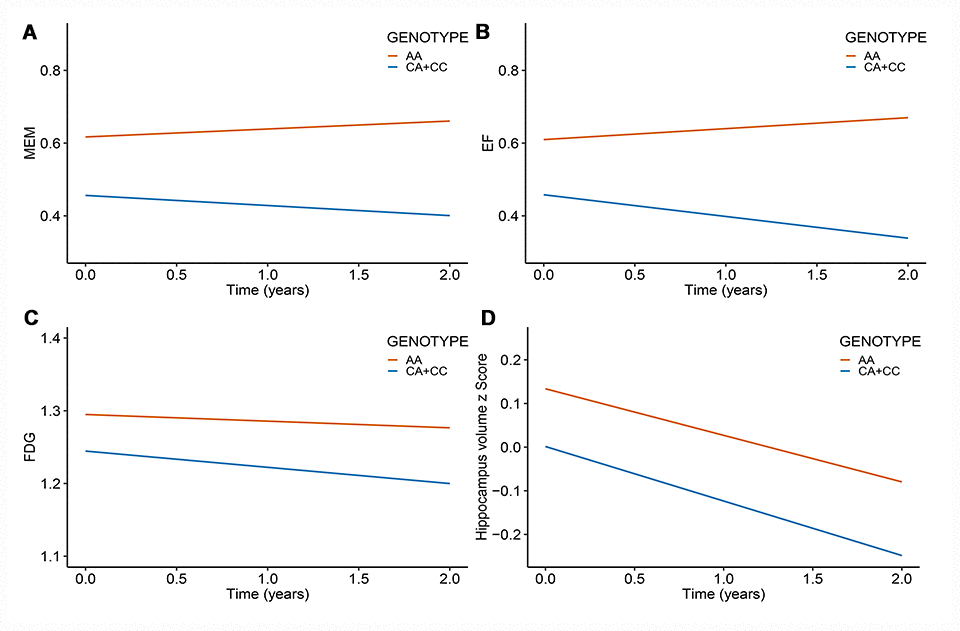
Figure 4. Rs11620312 associated with other phenotypes longitudinally. The minor allele (C) of rs11620312 was associated with the increased rates of EF decline (B, PBonf = 0.037) and FDG hypometabolism (C, PBonf = 0.029), however it was not associated with the change rates of MEM (A, PBonf = 0.18) and hippocampus volume (D, PBonf = 1.16) over time. Abbreviation: MEM = cognitive score for memory; EF = cognitive score for executive functioning; FDG = 18F-fluorodeoxyglucose.
Discussion
We identified two novel genome-wide significant SNPs in LD (rs11620312 and rs79174114, r2 > 0.8) within SIAH3 gene and sixteen other suggestive loci (in NKAIN2, TBC1D2, GALNT18, ABCC1, SRCIN1 genes and intergenic region). Moreover, we found the minor allele (C) of rs11620312 may be associated with accelerated cognitive decline and brain hypometabolism over time. Our findings suggest that SIAH3 gene, as a novel genetic factor, may be involved in the pathogenesis of neurodegenerative diseases.
SIAH3 (siah E3 ubiquitin protein ligase family member 3) gene is located on chromosome 13, encoding a member of the seven in absentia (Sina) protein family [15]. Although its function was not completely clear, there were some reports found that the SIAH3 gene played a role in high Cd placentas [16], metastatic prostate tumors [15] and human gingiva following surgical wounding [17]. A study found that SIAH3 was localized to mitochondria and it could inhibit PINK1 (PTEN-induced putative kinase 1) accumulation as a negative regulator after mitochondrial injury [18]. PINK1 plays an important role in mitochondrial autophagic pathway (mitophagy) by accumulating on the surface of the damaged mitochondrial outer membrane, as well as subsequently recruiting and activating Parkin [19]. It has been confirmed that PINK1/Parkin mitophagy was involved in the pathogenesis of PD [20]. Moreover, it was associated with other neurodegenerative diseases related to mitochondrial dysfunction, such as AD and multiple sclerosis (MS) [21–23].
Mitochondrial dysfunction, reducing intracellular adenosine triphosphate (ATP) levels and increasing reactive oxygen species (ROS) production, has been identified as an important mechanism in multiple neurodegenerative diseases [24]. It can lead to abnormal accumulation of Aβ and tau which are involved in the pathogenesis and pathology of AD [25]. PINK1/Parkin mitophagy is a protective pathway that can eliminate the severely damaged mitochondria to reduce toxic products and provide enough energy [26]. Moreover, according to a recent study, decreased expression of PINK1 is associated with increased Aβ accumulation, mitochondrial dysfunction, and impairments in learning and memory in a mouse model of Alzheimer disease [23]. In our study, we found two genome-wide significant SNPs (rs11620312 and rs79174114) within the SIAH3 gene were associated with an increased rate of ventricular enlargement in 507 nondemented elderly individuals. Thus, we hypothesized that SIAH3 can affect the PINK1/Parkin mitophagy by inhibiting the accumulation of PINK1 in the damaged mitochondria, subsequently leading to mitochondrial dysfunction involved in the pathology and pathogenesis of neurodegenerative diseases.
In addition, we found sixteen suggestive SNPs which may have potential associations with neurodegenerative diseases, including two loci (rs11618124 and rs1998892) in SIAH3, eight intergenic SNPs and six SNPs in other genes, such as NKAIN2 (rs2626129), TBC1D2 (rs10985425), GALNT18 (rs1994399), ABCC1 (rs4781701, rs12922404), and SRCIN1 (rs2075051). NKAIN2 (Na+/K+ transporting ATPase interacting 2) gene, highly expressed in brain tissues, encodes one of transmembrane proteins that interact with β-subunits of Na+/K+-ATPase [27]. Although its function was not clear, a previous study suggested that it may have associations with neurologic phenotypes like severe psychomotor retardation associated with cerebral atrophy [28]. TBC1D2 (TBC1 domain family member 2) encodes a GTPase-activating protein (GAP) for Rab7 GTPase, leading to Rab7 inactivation as well as the regulation of E-cadherin degradation and cell-cell adhesion [29]. The biological function of GALNT18 (polypeptide N-acetylgalactosaminyltransferase 18) gene is unclear. ABCC1 (ATP binding cassette subfamily C member 1) gene encodes a member of ATP-binding cassette (ABC) transporters involved in the multidrug resistance. A few studies found that ABCC1 protein may be associated with Aβ accumulation in the brain [30, 31]. SCRIN1 (SRC kinase signaling inhibitor 1) may be related with dendritic spine morphology and synaptic plasticity [32]. These genes, although not reaching the genome-wide significant level, may play a potential role in the pathogenesis of neurodegenerative diseases.
Our study has several limitations. First, the sample size of this study was moderate, which limited the statistical power of the GWAS and may give rise to false positive results. Moreover, the moderate sample size limited the statistical power of stratified analyses for each diagnostic group. Second, our sample was restricted to non-Hispanic white participants to avoid population stratification across ethnicities, but the rs11620312 in SIAH3 has various frequencies in different races. The contradiction determines the racial limitation of our research and the necessity of replication analysis in other races. Third, post-GWAS analyses about SIAH3 gene, like gene annotation and pathway analysis, were not available and the function of gene needs further exploration. Finally, more independent replication studies with large samples were needed to confirm these results.
In conclusion, we identified two novel loci (rs11620312 and rs79174114) within the SIAH3 gene associated with an increased rate of ventricular enlargement. Our further study demonstrated that rs11620312 was related to poor cognition and brain hypometabolism over time. The biological function of SIAH3 in mitochondrial dysfunction may have relevance for the pathogenesis of neurodegenerative diseases, which merits further investigation.
Materials and Methods
Alzheimer’s Disease Neuroimaging Initiative (ADNI) database
Initial data used in this study were obtained from the ADNI database (http://adni.loni.usc.edu). ADNI database was launched in 2004, led by Principal Investigator Michael W. Weiner, MD. It’s a public, longitudinal and multicenter study to detect clinical, imaging, biochemical and genetic biomarkers of AD [33]. This database includes three cohorts, i.e. ADNI-1, ADNI-GO and ADNI-2. More details of the ADNI database were described in prior publications and on the website of the ADNI database (http://adni.loni.usc.edu/about/).
Ethic
This study was approved by institutional review boards of all contributing research institutions, and informed consent in writing was acquired from all subjects or authorized agents.
Subjects
The initial cohort included 550 nondemented participants with both data on ventricular volume at baseline and 2-year follow-up and genetic information from ADNI database. All participants were restricted to non-Hispanic white participants to reduce the confounding from population stratification in the GWAS. This step excluded 36 participants. Moreover, to detect the confounding from cryptic relatedness and population substructure, we did genomic identity-by-descent (IBD) and multidimensional scaling (MDS) analysis using the PLINK software [34] (Supplementary Figure 1). Four participants who clustered separately from the others were removed, resulting in 510 valid participants.
Endophenotype and quality control
Measurements of ventricular volume in ADNI-1 and ADNI-GO/2 were performed on 1.5T and 3T MRI scanners, respectively, using T1-weighted sequences with the standard ADNI MRI protocols. More details about measurements of ventricular volume were described elsewhere [33, 35, 36] and on the ADNI website (http://adni.loni.usc.edu). The annualized percent change of ventricular volume at 2-year follow-up compared to baseline was used as endophenotype [37]. To reduce the potential for false positives, three extreme outliners (the rate of ventricular enlargement > mean ± four standard deviations) were excluded, resulting in 507 valid participants.
Genotyping and quality control
Samples of ADNI-1 and ADNI-GO/2 cohorts were genotyped using the Illumina Human610-Quad, and HumanOmniExpress microarray chips (Illumina, Inc., San Diego, CA), respectively [14]. Quality control procedures were performed using PLINK software with the following criteria [38, 39]: call rate for SNPs >98%, call rate for individuals >95%, minor allele frequencies >0.05, and Hardy-Weinberg equilibrium test p > 0.001. A total of 1,231,747 SNPs were retained after cleaning. The polymorphisms rs7412 and rs429358, which define the APOE alleles, were genotyped separately by an APOE genotyping kit [40].
Statistical analyses
GWAS was performed using linear regression under an additive genetic model (i.e., dose-dependent effect of the minor allele) in PLINK software. Age, gender, APOE ε4 [41], ICV and MRI scanner type (1.5T versus 3T) at baseline were included as covariates. Principal components analysis (PCA) was derived using genome-wide complex trait analysis (GCTA) software [42], and the first three PCs were included as covariates. Conservative thresholds of P values <5×10⁻⁸ and <10-5 were used to represent genome-wide significant and suggestive associations, respectively [43]. Manhattan plot and Quantile-Quantile (QQ) plot were drawn in R software (version 3.5.2), and regional association plots were visualized by Locus Zoom website [44]. Differences in the endophenotype (the rate of ventricular enlargement) between rs11620312-C carriers and non-carriers in all subjects and two diagnosis groups were examined using multiple linear regression adjusting for age, gender, APOE ε4, ICV and MRI scanner type (1.5T versus 3T) at baseline in R software. The effect of genome-wide significant SNPs on gene expression was detected by accessing data from the UKBEC (www.braineac.org) [45].
Association between the genome-wide significant SNP and other phenotypes
We further detected the relationship between the genome-wide significant SNP and other phenotypes, including composite cognitive scores for EF [46] and MEM [47], FDG metabolism and hippocampus volume in the GWAS cohorts. These data were also obtained from the ADNI database (http://adni.loni.usc.edu). Statistical analyses used multiple linear regression models for cross-sectional studies and mixed-effect models for longitudinal studies in R software (version 3.5.2). Age, gender, and APOE ε4 were used as covariates for all phenotypes, and educational level and ICV were included in the models of cognitive scores and hippocampus, respectively. Adjusted P-values (PBonf) were corrected for multiple comparisons using the Bonferroni procedure.
Supplementary Materials
Conflicts of Interest
The authors have no conflicts of interest to disclose.
Funding
This work was supported by grants from the National Natural Science Foundation of China (81571245).
References
- 1. Chou YY, Leporé N, Avedissian C, Madsen SK, Parikshak N, Hua X, Shaw LM, Trojanowski JQ, Weiner MW, Toga AW, Thompson PM, and Alzheimer’s Disease Neuroimaging Initiative. Mapping correlations between ventricular expansion and CSF amyloid and tau biomarkers in 240 subjects with Alzheimer’s disease, mild cognitive impairment and elderly controls. Neuroimage. 2009; 46:394–410. https://doi.org/10.1016/j.neuroimage.2009.02.015 [PubMed]
- 2. Apostolova L, Alves G, Hwang KS, Babakchanian S, Bronnick KS, Larsen JP, Thompson PM, Chou YY, Tysnes OB, Vefring HK, Beyer MK. Hippocampal and ventricular changes in Parkinson’s disease mild cognitive impairment. Neurobiol Aging. 2012; 33:2113–24. https://doi.org/10.1016/j.neurobiolaging.2011.06.014 [PubMed]
- 3. Milovanović N, Damjanović A, Puškaš L, Milovanović S, Barišić J, Mališ M, Stanković G, Ranković A, Latas M, Filipović BF, Filipović BR. Reliability of the bicaudate parameter in the revealing of the enlarged lateral Ventricles in schizophrenia patients. Psychiatr Danub. 2018; 30:150–56. https://doi.org/10.24869/spsih.2018.150 [PubMed]
- 4. Nestor SM, Rupsingh R, Borrie M, Smith M, Accomazzi V, Wells JL, Fogarty J, Bartha R, and Alzheimer’s Disease Neuroimaging Initiative. Ventricular enlargement as a possible measure of Alzheimer’s disease progression validated using the Alzheimer’s disease neuroimaging initiative database. Brain. 2008; 131:2443–54. https://doi.org/10.1093/brain/awn146 [PubMed]
- 5. Erten-Lyons D, Dodge HH, Woltjer R, Silbert LC, Howieson DB, Kramer P, Kaye JA. Neuropathologic basis of age-associated brain atrophy. JAMA Neurol. 2013; 70:616–22. https://doi.org/10.1001/jamaneurol.2013.1957 [PubMed]
- 6. Ridha BH, Anderson VM, Barnes J, Boyes RG, Price SL, Rossor MN, Whitwell JL, Jenkins L, Black RS, Grundman M, Fox NC. Volumetric MRI and cognitive measures in Alzheimer disease : comparison of markers of progression. J Neurol. 2008; 255:567–74. https://doi.org/10.1007/s00415-008-0750-9 [PubMed]
- 7. Carmichael OT, Kuller LH, Lopez OL, Thompson PM, Dutton RA, Lu A, Lee SE, Lee JY, Aizenstein HJ, Meltzer CC, Liu Y, Toga AW, Becker JT. Cerebral ventricular changes associated with transitions between normal cognitive function, mild cognitive impairment, and dementia. Alzheimer Dis Assoc Disord. 2007; 21:14–24. https://doi.org/10.1097/WAD.0b013e318032d2b1 [PubMed]
- 8. Mak E, Su L, Williams GB, Firbank MJ, Lawson RA, Yarnall AJ, Duncan GW, Mollenhauer B, Owen AM, Khoo TK, Brooks DJ, Rowe JB, Barker RA, et al. Longitudinal whole-brain atrophy and ventricular enlargement in nondemented Parkinson’s disease. Neurobiol Aging. 2017; 55:78–90. https://doi.org/10.1016/j.neurobiolaging.2017.03.012 [PubMed]
- 9. Eyler LT, Prom-Wormley E, Fennema-Notestine C, Panizzon MS, Neale MC, Jernigan TL, Fischl B, Franz CE, Lyons MJ, Stevens A, Pacheco J, Perry ME, Schmitt JE, et al. Genetic patterns of correlation among subcortical volumes in humans: results from a magnetic resonance imaging twin study. Hum Brain Mapp. 2011; 32:641–53. https://doi.org/10.1002/hbm.21054 [PubMed]
- 10. Kremen WS, Panizzon MS, Neale MC, Fennema-Notestine C, Prom-Wormley E, Eyler LT, Stevens A, Franz CE, Lyons MJ, Grant MD, Jak AJ, Jernigan TL, Xian H, et al. Heritability of brain ventricle volume: converging evidence from inconsistent results. Neurobiol Aging. 2012; 33:1–8. https://doi.org/10.1016/j.neurobiolaging.2010.02.007 [PubMed]
- 11. Vojinovic D, Adams HH, Jian X, Yang Q, Smith AV, Bis JC, Teumer A, Scholz M, Armstrong NJ, Hofer E, Saba Y, Luciano M, Bernard M, et al. Genome-wide association study of 23,500 individuals identifies 7 loci associated with brain ventricular volume. Nat Commun. 2018; 9:3945. https://doi.org/10.1038/s41467-018-06234-w [PubMed]
- 12. Deming Y, Li Z, Kapoor M, Harari O, Del-Aguila JL, Black K, Carrell D, Cai Y, Fernandez MV, Budde J, Ma S, Saef B, Howells B, et al, and Alzheimer’s Disease Neuroimaging Initiative (ADNI), and Alzheimer Disease Genetic Consortium (ADGC). Genome-wide association study identifies four novel loci associated with Alzheimer’s endophenotypes and disease modifiers. Acta Neuropathol. 2017; 133:839–56. https://doi.org/10.1007/s00401-017-1685-y [PubMed]
- 13. Kim S, Swaminathan S, Shen L, Risacher SL, Nho K, Foroud T, Shaw LM, Trojanowski JQ, Potkin SG, Huentelman MJ, Craig DW, DeChairo BM, Aisen PS, et al, and Alzheimer’s Disease Neuroimaging Initiative. Genome-wide association study of CSF biomarkers Abeta1-42, t-tau, and p-tau181p in the ADNI cohort. Neurology. 2011; 76:69–79. https://doi.org/10.1212/WNL.0b013e318204a397 [PubMed]
- 14. Chung J, Wang X, Maruyama T, Ma Y, Zhang X, Mez J, Sherva R, Takeyama H, Lunetta KL, Farrer LA, Jun GR, and Alzheimer’s Disease Neuroimaging Initiative. Genome-wide association study of Alzheimer’s disease endophenotypes at prediagnosis stages. Alzheimers Dement. 2018; 14:623–33. https://doi.org/10.1016/j.jalz.2017.11.006 [PubMed]
- 15. Robbins CM, Tembe WA, Baker A, Sinari S, Moses TY, Beckstrom-Sternberg S, Beckstrom-Sternberg J, Barrett M, Long J, Chinnaiyan A, Lowey J, Suh E, Pearson JV, et al. Copy number and targeted mutational analysis reveals novel somatic events in metastatic prostate tumors. Genome Res. 2011; 21:47–55. https://doi.org/10.1101/gr.107961.110 [PubMed]
- 16. Mohanty AF, Farin FM, Bammler TK, MacDonald JW, Afsharinejad Z, Burbacher TM, Siscovick DS, Williams MA, Enquobahrie DA. Infant sex-specific placental cadmium and DNA methylation associations. Environ Res. 2015; 138:74–81. https://doi.org/10.1016/j.envres.2015.02.004 [PubMed]
- 17. Wang Y, Tatakis DN. Human gingiva transcriptome during wound healing. J Clin Periodontol. 2017; 44:394–402. https://doi.org/10.1111/jcpe.12669 [PubMed]
- 18. Hasson SA, Kane LA, Yamano K, Huang CH, Sliter DA, Buehler E, Wang C, Heman-Ackah SM, Hessa T, Guha R, Martin SE, Youle RJ. High-content genome-wide RNAi screens identify regulators of parkin upstream of mitophagy. Nature. 2013; 504:291–95. https://doi.org/10.1038/nature12748 [PubMed]
- 19. Rugarli EI, Langer T. Mitochondrial quality control: a matter of life and death for neurons. EMBO J. 2012; 31:1336–49. https://doi.org/10.1038/emboj.2012.38 [PubMed]
- 20. Pickrell AM, Youle RJ. The roles of PINK1, parkin, and mitochondrial fidelity in Parkinson’s disease. Neuron. 2015; 85:257–73. https://doi.org/10.1016/j.neuron.2014.12.007 [PubMed]
- 21. Wilhelmus MM, van der Pol SM, Jansen Q, Witte ME, van der Valk P, Rozemuller AJ, Drukarch B, de Vries HE, Van Horssen J. Association of Parkinson disease-related protein PINK1 with Alzheimer disease and multiple sclerosis brain lesions. Free Radic Biol Med. 2011; 50:469–76. https://doi.org/10.1016/j.freeradbiomed.2010.11.033 [PubMed]
- 22. Mise A, Yoshino Y, Yamazaki K, Ozaki Y, Sao T, Yoshida T, Mori T, Mori Y, Ochi S, Iga JI, Ueno SI. TOMM40 and APOE Gene Expression and Cognitive Decline in Japanese Alzheimer’s Disease Subjects. J Alzheimers Dis. 2017; 60:1107–17. https://doi.org/10.3233/JAD-170361 [PubMed]
- 23. Du F, Yu Q, Yan S, Hu G, Lue LF, Walker DG, Wu L, Yan SF, Tieu K, Yan SS. PINK1 signalling rescues amyloid pathology and mitochondrial dysfunction in Alzheimer’s disease. Brain. 2017; 140:3233–51. https://doi.org/10.1093/brain/awx258 [PubMed]
- 24. Brielle S, Kaganovich D. Mitochondrial dysfunction in protein conformational disorders. J Genet. 2018; 97:703–13. https://doi.org/10.1007/s12041-018-0958-0 [PubMed]
- 25. Kerr JS, Adriaanse BA, Greig NH, Mattson MP, Cader MZ, Bohr VA, Fang EF. Mitophagy and Alzheimer’s Disease: Cellular and Molecular Mechanisms. Trends Neurosci. 2017; 40:151–66. https://doi.org/10.1016/j.tins.2017.01.002 [PubMed]
- 26. Nguyen TN, Padman BS, Lazarou M. Deciphering the Molecular Signals of PINK1/Parkin Mitophagy. Trends Cell Biol. 2016; 26:733–44. https://doi.org/10.1016/j.tcb.2016.05.008 [PubMed]
- 27. Zhao SC, Zhou BW, Luo F, Mao X, Lu YJ. The structure and function of NKAIN2-a candidate tumor suppressor. Int J Clin Exp Med. 2015; 8:17072–79. [PubMed]
- 28. Bocciardi R, Giorda R, Marigo V, Zordan P, Montanaro D, Gimelli S, Seri M, Lerone M, Ravazzolo R, Gimelli G. Molecular characterization of a t(2;6) balanced translocation that is associated with a complex phenotype and leads to truncation of the TCBA1 gene. Hum Mutat. 2005; 26:426–36. https://doi.org/10.1002/humu.20235 [PubMed]
- 29. Frasa MA, Maximiano FC, Smolarczyk K, Francis RE, Betson ME, Lozano E, Goldenring J, Seabra MC, Rak A, Ahmadian MR, Braga VM. Armus is a Rac1 effector that inactivates Rab7 and regulates E-cadherin degradation. Curr Biol. 2010; 20:198–208. https://doi.org/10.1016/j.cub.2009.12.053 [PubMed]
- 30. Krohn M, Lange C, Hofrichter J, Scheffler K, Stenzel J, Steffen J, Schumacher T, Brüning T, Plath AS, Alfen F, Schmidt A, Winter F, Rateitschak K, et al. Cerebral amyloid-β proteostasis is regulated by the membrane transport protein ABCC1 in mice. J Clin Invest. 2011; 121:3924–31. https://doi.org/10.1172/JCI57867 [PubMed]
- 31. Pahnke J, Fröhlich C, Paarmann K, Krohn M, Bogdanovic N, Årsland D, Winblad B. Cerebral ABC transporter-common mechanisms may modulate neurodegenerative diseases and depression in elderly subjects. Arch Med Res. 2014; 45:738–43. https://doi.org/10.1016/j.arcmed.2014.10.010 [PubMed]
- 32. Jaworski J, Kapitein LC, Gouveia SM, Dortland BR, Wulf PS, Grigoriev I, Camera P, Spangler SA, Di Stefano P, Demmers J, Krugers H, Defilippi P, Akhmanova A, Hoogenraad CC. Dynamic microtubules regulate dendritic spine morphology and synaptic plasticity. Neuron. 2009; 61:85–100. https://doi.org/10.1016/j.neuron.2008.11.013 [PubMed]
- 33. Weiner MW, Veitch DP, Aisen PS, Beckett LA, Cairns NJ, Cedarbaum J, Green RC, Harvey D, Jack CR, Jagust W, Luthman J, Morris JC, Petersen RC, et al, and Alzheimer’s Disease Neuroimaging Initiative. 2014 Update of the Alzheimer’s Disease Neuroimaging Initiative: A review of papers published since its inception. Alzheimers Dement. 2015; 11:e1–120. https://doi.org/10.1016/j.jalz.2014.11.001 [PubMed]
- 34. Purcell S, Neale B, Todd-Brown K, Thomas L, Ferreira MA, Bender D, Maller J, Sklar P, de Bakker PI, Daly MJ, Sham PC. PLINK: a tool set for whole-genome association and population-based linkage analyses. Am J Hum Genet. 2007; 81:559–75. https://doi.org/10.1086/519795 [PubMed]
- 35. Jack CR
Jr , Bernstein MA, Fox NC, Thompson P, Alexander G, Harvey D, Borowski B, Britson PJ, L Whitwell J, Ward C, Dale AM, Felmlee JP, Gunter JL, et al. The Alzheimer’s Disease Neuroimaging Initiative (ADNI): MRI methods. Journal of magnetic resonance imaging. J Magn Reson Imaging. 2008; 27:685–91. https://doi.org/10.1002/jmri.21049 [PubMed] - 36. Wyman BT, Harvey DJ, Crawford K, Bernstein MA, Carmichael O, Cole PE, Crane PK, DeCarli C, Fox NC, Gunter JL, Hill D, Killiany RJ, Pachai C, et al, and Alzheimer’s Disease Neuroimaging Initiative. Standardization of analysis sets for reporting results from ADNI MRI data. Alzheimers Dement. 2013; 9:332–37. https://doi.org/10.1016/j.jalz.2012.06.004 [PubMed]
- 37. Ramanan VK, Risacher SL, Nho K, Kim S, Shen L, McDonald BC, Yoder KK, Hutchins GD, West JD, Tallman EF, Gao S, Foroud TM, Farlow MR, et al, and Alzheimer’s Disease Neuroimaging Initiative (ADNI). GWAS of longitudinal amyloid accumulation on 18F-florbetapir PET in Alzheimer’s disease implicates microglial activation gene IL1RAP. Brain. 2015; 138:3076–88. https://doi.org/10.1093/brain/awv231 [PubMed]
- 38. Anderson CA, Pettersson FH, Clarke GM, Cardon LR, Morris AP, Zondervan KT. Data quality control in genetic case-control association studies. Nat Protoc. 2010; 5:1564–73. https://doi.org/10.1038/nprot.2010.116 [PubMed]
- 39. Marees AT, de Kluiver H, Stringer S, Vorspan F, Curis E, Marie-Claire C, Derks EM. A tutorial on conducting genome-wide association studies: quality control and statistical analysis. Int J Methods Psychiatr Res. 2018; 27:e1608. https://doi.org/10.1002/mpr.1608 [PubMed]
- 40. Saykin AJ, Shen L, Foroud TM, Potkin SG, Swaminathan S, Kim S, Risacher SL, Nho K, Huentelman MJ, Craig DW, Thompson PM, Stein JL, Moore JH, et al, and Alzheimer’s Disease Neuroimaging Initiative. Alzheimer’s Disease Neuroimaging Initiative biomarkers as quantitative phenotypes: genetics core aims, progress, and plans. Alzheimers Dement. 2010; 6:265–73. https://doi.org/10.1016/j.jalz.2010.03.013 [PubMed]
- 41. Roussotte FF, Gutman BA, Madsen SK, Colby JB, Narr KL, Thompson PM, and Alzheimer’s Disease Neuroimaging Initiative (ADNI). Apolipoprotein E epsilon 4 allele is associated with ventricular expansion rate and surface morphology in dementia and normal aging. Neurobiol Aging. 2014; 35:1309–17. https://doi.org/10.1016/j.neurobiolaging.2013.11.030 [PubMed]
- 42. Yang J, Lee SH, Goddard ME, Visscher PM. GCTA: a tool for genome-wide complex trait analysis. Am J Hum Genet. 2011; 88:76–82. https://doi.org/10.1016/j.ajhg.2010.11.011 [PubMed]
- 43. Pe’er I, Yelensky R, Altshuler D, Daly MJ. Estimation of the multiple testing burden for genomewide association studies of nearly all common variants. Genet Epidemiol. 2008; 32:381–85. https://doi.org/10.1002/gepi.20303 [PubMed]
- 44. Pruim RJ, Welch RP, Sanna S, Teslovich TM, Chines PS, Gliedt TP, Boehnke M, Abecasis GR, Willer CJ. LocusZoom: regional visualization of genome-wide association scan results. Bioinformatics. 2010; 26:2336–37. https://doi.org/10.1093/bioinformatics/btq419 [PubMed]
- 45. Ramasamy A, Trabzuni D, Guelfi S, Varghese V, Smith C, Walker R, De T, Coin L, de Silva R, Cookson MR, Singleton AB, Hardy J, Ryten M, Weale ME, and UK Brain Expression Consortium, and North American Brain Expression Consortium. Genetic variability in the regulation of gene expression in ten regions of the human brain. Nat Neurosci. 2014; 17:1418–28. https://doi.org/10.1038/nn.3801 [PubMed]
- 46. Gibbons LE, Carle AC, Mackin RS, Harvey D, Mukherjee S, Insel P, Curtis SM, Mungas D, Crane PK, and Alzheimer’s Disease Neuroimaging Initiative. A composite score for executive functioning, validated in Alzheimer’s Disease Neuroimaging Initiative (ADNI) participants with baseline mild cognitive impairment. Brain Imaging Behav. 2012; 6:517–27. https://doi.org/10.1007/s11682-012-9176-1 [PubMed]
- 47. Crane PK, Carle A, Gibbons LE, Insel P, Mackin RS, Gross A, Jones RN, Mukherjee S, Curtis SM, Harvey D, Weiner M, Mungas D, and Alzheimer’s Disease Neuroimaging Initiative. Development and assessment of a composite score for memory in the Alzheimer’s Disease Neuroimaging Initiative (ADNI). Brain Imaging Behav. 2012; 6:502–16. https://doi.org/10.1007/s11682-012-9186-z [PubMed]