


Introduction
Telomeres are the (TTAGGG)n repeats located at the ends of each chromosome. Their broad function is to prevent genomic instability [1]. Telomeres in adult germ cells [2], bone marrow [3, 4] and embryonic stem cells [5] are largely maintained by telomerase. After birth, however, telomeres in somatic cells gradually shorten because of the repressed activities of telomerase [3–6]. In cultured cells, when telomeres become critically short, the cell reaches replicative senescence [1, 7]. Telomere length (TL) is reported to be shorter in leukocytes of men than women, but this sex difference may depend on the measurement method [8]. In their meta-analysis of data from 36 cohorts with a total of 36,230 participants, Gardner and colleagues found longer telomeres in women only for the terminal restriction fragments (TRF) Southern blot method [8]. By contrast, no sex effect was detected for the other TL measurement methods including the widely used quantitative real-time polymerase chain reaction (qPCR) protocol originally described by Cawthon [9]. TL is also shorter in leukocytes of individuals of European ancestry than individuals of African ancestry [10, 11]. Further, leukocyte telomere length (LTL) is associated with the two disease categories that largely define longevity in contemporary humans—cancer and cardiovascular disease [12–14]
High heritability estimates for LTL have been reported irrespective of the methods used for measuring LTL; reported heritability estimates are between 36% and 82% based on Southern blot [15–18], and between 51% and 76% based on qPCR [19, 20]. Genome-wide association studies (GWAS) conducted in large observational cohorts have identified 11 loci associated with LTL [21–24]. A subset of these loci harbor telomere maintenance genes. These loci, however, explain only a small proportion of the genetic variance in LTL. Similarly, relatively little is known about epigenetic changes and LTL. Here, we focus on the relationship between LTL and DNA methylation levels in leukocytes. Epigenome-wide association studies (EWAS) have emerged as a powerful tool for evaluating genome-wide changes in DNAm for a given phenotype of interest [25]. Previous studies have explored the association between DNAm and LTL [26–28], but these studies were somewhat limited due to moderate sample sizes or the focus on specific regions in the genome. Here, we conduct the largest EWAS of LTL to date in different groups defined by sex and ethnicity.
Results
Epigenome-wide association study of leukocyte telomere length
We considered two sets of adjustments for LTL confounders: 1) partially adjusted LTL for age, sex, and ethnicity and 2) fully adjusted LTL for age, sex, ethnicity, and imputed white blood cell counts (CD4+ naïve, CD8+ naïve and exhausted cytotoxic T cell). We conducted a large-scale multi-ancestry EWAS of the partially and fully adjusted LTL using seven cohorts – the Framingham Heart Study (FHS, n=874), the Jackson Heart Study (JHS, n=1,637), the Women’s Health Initiative (WHI, n=818), the Bogalusa Heart Study (BHS, n=831), the Lothian Birth Cohorts (LBC1921 and LBC1936, n=403 and n=906, respectively), and the Longitudinal Study of Aging Danish Twins (LSADT, n=244). The analysis flow is depicted in Figure 1. We note that adjustment in this script indicates a mixture of data stratification and regression adjustment.
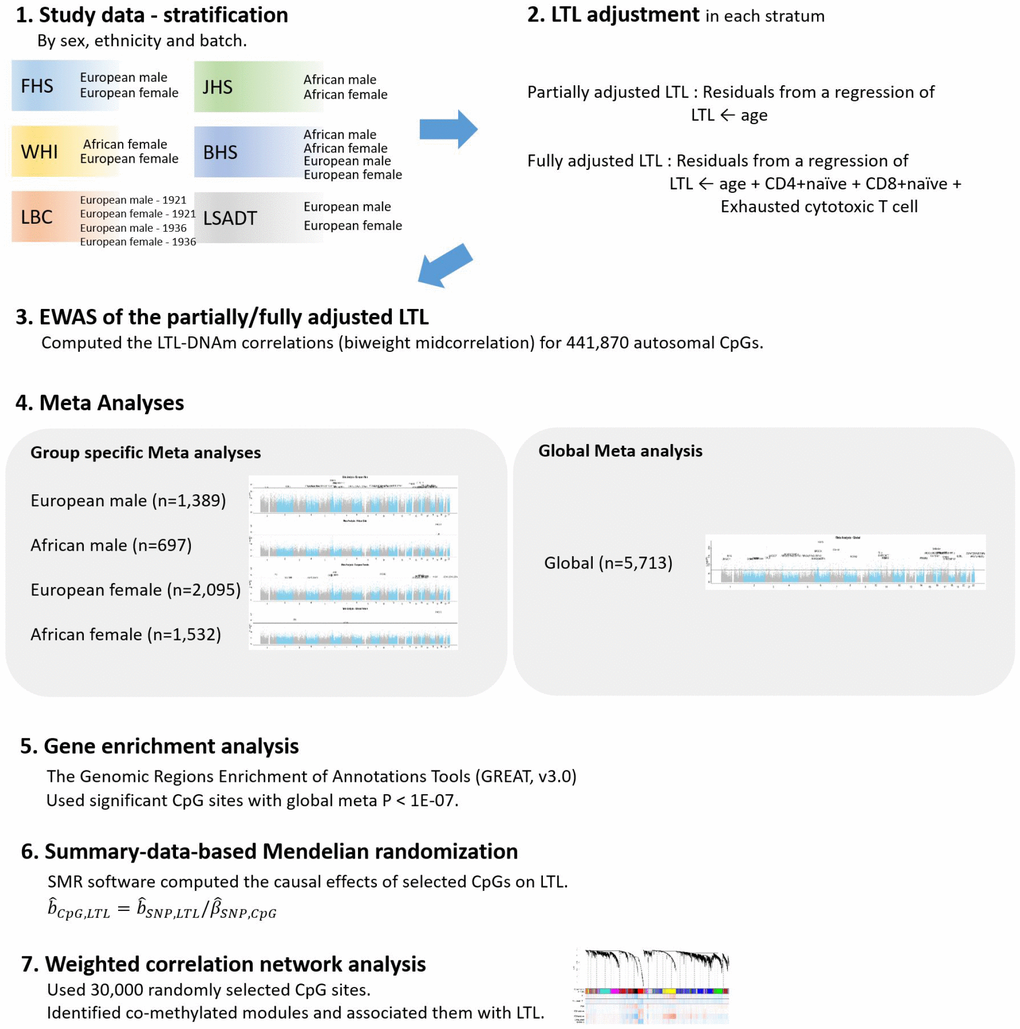
Figure 1. Analysis flow chart.
Overall, 8,716 CpG sites were significantly (P<1E-07) associated with the partially adjusted LTL in the global meta-analysis. The top four genes with the largest number of significant CpGs were VARS (16 CpGs), PRDM16 (15 CpGs), MAGI2 (14 CpGs) and MSI2 (13 CpGs). In the group-specific meta-analyses, we found 87 significant CpGs in men of European ancestry, 14 significant CpGs in men of African ancestry, 298 significant CpGs in women of European ancestry, and 20 significant CpGs in women of African ancestry (Supplementary File 1).
We identified 823 significant (P<1E-07) CpG sites associated with the fully adjusted LTL through the global meta-analysis. Our statistical significance threshold (1E-07) corresponds to a 5% family-wise error for 450K array studies [29]. Table 1 presents the top 30 CpGs among the 823 significant CpGs and groups them by their annotated gene names. Among the top 30 CpGs, six were in VARS, two were in YPEL2 and two were in XRCC3. The CpGs highlighted by an asterisk in Table 2 were more strongly associated with LTL in one or two sex and ethnicity-specific groups than in the rest of the groups. Specifically, the LTL-DNAm correlations at cg27343900 (in ERGIC1) and cg12798040 (in XRCC3) were stronger in men of European ancestry than in women of African ancestry. The LTL-DNAm correlation at cg27106909 near YPEL3 was stronger in men of European ancestry than in women of European ancestry.
Table 1. The top 30 most significant CpG sites associated with the fully adjusted LTL.
| CpG | Gene | Chr | Relation to UCSC CpG island | UCSC RefGene group | Meta-Analysis | ||||||||||||||||||||||||||||||||||||||||||||||||||||||||||||||||||||||||||||||||||||||||||||||
| Global meta Z (P) n=5,713 | European male Z (P) n=1,389 | African male Z (P) n=697 | European female Z (P) n=2,095 | African female Z (P) n=1,532 | |||||||||||||||||||||||||||||||||||||||||||||||||||||||||||||||||||||||||||||||||||||||||||||||
| cg08899667 | VARS | 6 | N_Shelf | Body | -10.1 (4E-24) | -5.2 (3E-07) | -6.0 (2E-09) | -5.1 (4E-07) | -4.2 (3E-05) | ||||||||||||||||||||||||||||||||||||||||||||||||||||||||||||||||||||||||||||||||||||||||||
| cg02980249 | VARS | 6 | N_Shelf | Body | -8.7 (2E-18) | -5.8 (5E-09) | -4.0 (6E-05) | -4.8 (2E-06) | -3.4 (7E-04) | ||||||||||||||||||||||||||||||||||||||||||||||||||||||||||||||||||||||||||||||||||||||||||
| cg02597894 | VARS | 6 | N_Shelf | Body | -8.1 (4E-16) | -4.8 (2E-06) | -4.2 (3E-05) | -5.2 (2E-07) | -2.7 (6E-03) | ||||||||||||||||||||||||||||||||||||||||||||||||||||||||||||||||||||||||||||||||||||||||||
| cg04368724 | VARS | 6 | N_Shelf | Body | -8.0 (9E-16) | -3.0 (2E-03) | -5.0 (5E-07) | -4.2 (3E-05) | -4.0 (8E-05) | ||||||||||||||||||||||||||||||||||||||||||||||||||||||||||||||||||||||||||||||||||||||||||
| cg04018738 | VARS | 6 | N_Shelf | Body | -8.0 (2E-15) | -3.6 (3E-04) | -4.6 (4E-06) | -4.4 (1E-05) | -3.5 (4E-04) | ||||||||||||||||||||||||||||||||||||||||||||||||||||||||||||||||||||||||||||||||||||||||||
| cg24771152 | VARS | 6 | N_Shelf | Body | -7.8 (6E-15) | -3.8 (2E-04) | -4.3 (2E-05) | -4.0 (6E-05) | -3.7 (2E-04) | ||||||||||||||||||||||||||||||||||||||||||||||||||||||||||||||||||||||||||||||||||||||||||
| cg20507228 | MAN2A2 | 15 | - | Body | -9.2 (5E-20) | -5.4 (8E-08) | -5.7 (2E-08) | -3.6 (3E-04) | -3.5 (4E-04) | ||||||||||||||||||||||||||||||||||||||||||||||||||||||||||||||||||||||||||||||||||||||||||
| cg08972170 | C7orf41 | 7 | - | Body | -9.0 (2E-19) | -3.7 (2E-04) | -4.9 (8E-07) | -4.1 (5E-05) | -5.4 (7E-08) | ||||||||||||||||||||||||||||||||||||||||||||||||||||||||||||||||||||||||||||||||||||||||||
| cg27343900* | ERGIC1 | 5 | - | Body | -8.8 (1E-18) | -6.1 (8E-10)* | -5.1 (3E-07) | -4.2 (2E-05) | -2.4 (2E-02) | ||||||||||||||||||||||||||||||||||||||||||||||||||||||||||||||||||||||||||||||||||||||||||
| cg10549018 | TLL2 | 10 | - | Body | -8.6 (1E-17) | -5.3 (1E-07) | -3.9 (1E-04) | -4.5 (8E-06) | -4.0 (7E-05) | ||||||||||||||||||||||||||||||||||||||||||||||||||||||||||||||||||||||||||||||||||||||||||
| cg26709300* | YPEL3 | 16 | N_Shore | 1stExon;Body | -8.6 (1E-17) | -3.9 (8E-05) | -5.4 (6E-08)* | -2.4 (2E-02) | -4.8 (1E-06) | ||||||||||||||||||||||||||||||||||||||||||||||||||||||||||||||||||||||||||||||||||||||||||
| cg27106909* | YPEL3 | 16 | N_Shore | 1stExon;5′UTR;5′UTR | -8.5 (2E-17) | -5.6 (2E-08)* | -5.1 (3E-07) | -2.5 (1E-02) | -3.4 (6E-04) | ||||||||||||||||||||||||||||||||||||||||||||||||||||||||||||||||||||||||||||||||||||||||||
| cg12798040* | XRCC3 | 14 | - | Body | -8.5 (2E-17) | -5.4 (8E-08)* | -5.4 (8E-08)* | -4.1 (4E-05) | -2.2 (2E-02) | ||||||||||||||||||||||||||||||||||||||||||||||||||||||||||||||||||||||||||||||||||||||||||
| cg02194129 | XRCC3 | 14 | - | Body | -8.3 (1E-16) | -4.9 (1E-06) | -5.0 (5E-07) | -4.3 (2E-05) | -2.6 (9E-03) | ||||||||||||||||||||||||||||||||||||||||||||||||||||||||||||||||||||||||||||||||||||||||||
| cg19841423* | ZGPAT;LIME1 | 20 | S_Shore | Body;TSS1500 | -8.4 (3E-17) | -5.0 (6E-07) | -5.5 (5E-08)* | -3.7 (2E-04) | -2.7 (8E-03) | ||||||||||||||||||||||||||||||||||||||||||||||||||||||||||||||||||||||||||||||||||||||||||
| cg02810967 | NCAPG;DCAF16 | 4 | S_Shore | Body;TSS1500 | 8.3 (9E-17) | 4.4 (1E-05) | 5.4 (9E-08) | 4.1 (4E-05) | 2.8 (5E-03) | ||||||||||||||||||||||||||||||||||||||||||||||||||||||||||||||||||||||||||||||||||||||||||
| cg19935065 | DNTT | 10 | - | TSS1500 | -8.1 (4E-16) | -3.5 (4E-04) | -4.9 (1E-06) | -5.0 (5E-07) | -3.2 (1E-03) | ||||||||||||||||||||||||||||||||||||||||||||||||||||||||||||||||||||||||||||||||||||||||||
| cg11093760 | CILP | 15 | - | 5′UTR;1stExon | -8.1 (5E-16) | -5.9 (4E-09) | -4.1 (5E-05) | -3.3 (1E-03) | -3.1 (2E-03) | ||||||||||||||||||||||||||||||||||||||||||||||||||||||||||||||||||||||||||||||||||||||||||
| cg19097500 | NFIA | 1 | N_Shore | TSS1500 | -8.1 (6E-16) | -5.4 (7E-08) | -3.7 (2E-04) | -3.7 (2E-04) | -3.6 (3E-04) | ||||||||||||||||||||||||||||||||||||||||||||||||||||||||||||||||||||||||||||||||||||||||||
| cg09626867 | EXOSC7 | 3 | - | Body | -8.1 (7E-16) | -5.2 (2E-07) | -4.1 (3E-05) | -4.5 (6E-06) | -2.8 (5E-03) | ||||||||||||||||||||||||||||||||||||||||||||||||||||||||||||||||||||||||||||||||||||||||||
| cg04509882 | EIF4G1 | 3 | - | Body;1stExon;5′UTR | -8.1 (8E-16) | -5.5 (4E-08) | -4.3 (2E-05) | -3.3 (1E-03) | -3.1 (2E-03) | ||||||||||||||||||||||||||||||||||||||||||||||||||||||||||||||||||||||||||||||||||||||||||
| cg23661483 | ILVBL | 19 | S_Shelf | Body | -8.0 (9E-16) | -3.7 (2E-04) | -4.3 (2E-05) | -5.4 (7E-08) | -3.3 (1E-03) | ||||||||||||||||||||||||||||||||||||||||||||||||||||||||||||||||||||||||||||||||||||||||||
| cg01012082 | NCOA2 | 8 | - | 3′UTR | -8.0 (1E-15) | -4.7 (3E-06) | -4.0 (7E-05) | -4.4 (1E-05) | -3.4 (8E-04) | ||||||||||||||||||||||||||||||||||||||||||||||||||||||||||||||||||||||||||||||||||||||||||
| cg21461082 | PRMT2 | 21 | Island | Body | 8.0 (2E-15) | 2.9 (4E-03) | 4.4 (9E-06) | 4.5 (6E-06) | 4.4 (1E-05) | ||||||||||||||||||||||||||||||||||||||||||||||||||||||||||||||||||||||||||||||||||||||||||
| cg25921609 | MYH10 | 17 | N_Shore | Body | -7.9 (3E-15) | -5.2 (3E-07) | -3.6 (3E-04) | -4.5 (6E-06) | -3.1 (2E-03) | ||||||||||||||||||||||||||||||||||||||||||||||||||||||||||||||||||||||||||||||||||||||||||
| cg24420089* | PTDSS2 | 11 | N_Shore | Body | -7.8 (8E-15) | -3.4 (7E-04) | -5.8 (7E-09)* | -2.3 (2E-02) | -3.5 (5E-04) | ||||||||||||||||||||||||||||||||||||||||||||||||||||||||||||||||||||||||||||||||||||||||||
| cg07414525 | CHL1 | 3 | - | Body | -7.8 (9E-15) | -3.5 (4E-04) | -3.0 (3E-03) | -3.5 (5E-04) | -5.8 (6E-09) | ||||||||||||||||||||||||||||||||||||||||||||||||||||||||||||||||||||||||||||||||||||||||||
| cg14817906 | CNNM4 | 2 | - | Body | -7.7 (1E-14) | -4.4 (1E-05) | -4.1 (4E-05) | -3.9 (8E-05) | -3.2 (1E-03) | ||||||||||||||||||||||||||||||||||||||||||||||||||||||||||||||||||||||||||||||||||||||||||
| cg04860432* | PTGER2 | 14 | S_Shore | Body | -7.7 (2E-14) | -5.8 (7E-09)* | -4.3 (1E-05) | -2.3 (2E-02) | -2.7 (7E-03) | ||||||||||||||||||||||||||||||||||||||||||||||||||||||||||||||||||||||||||||||||||||||||||
| cg23570810 | IFITM1 | 11 | N_Shore | Body | 7.7 (2E-14) | 4.2 (3E-05) | 4.2 (2E-05) | 4.2 (2E-05) | 3.0 (2E-03) | ||||||||||||||||||||||||||||||||||||||||||||||||||||||||||||||||||||||||||||||||||||||||||
| * The CpGs were more strongly associated with LTL in one or two sex and ethnicity specific groups than in the rest of the groups. | |||||||||||||||||||||||||||||||||||||||||||||||||||||||||||||||||||||||||||||||||||||||||||||||||||
Figure 2 displays regional test statistics of LTL-associated CpGs on top of the local DNAm correlation structure for the top four genes listed in Table 1. VARS showed a cluster of CpGs above and right below the threshold of significance, while MAN2A2, C7orf41 (current name, MTURN) and ERGIC1 had one or two significant CpGs. The clusters detected in VARS might be because of the high probe density on the array and the strong inter-CpG correlations.
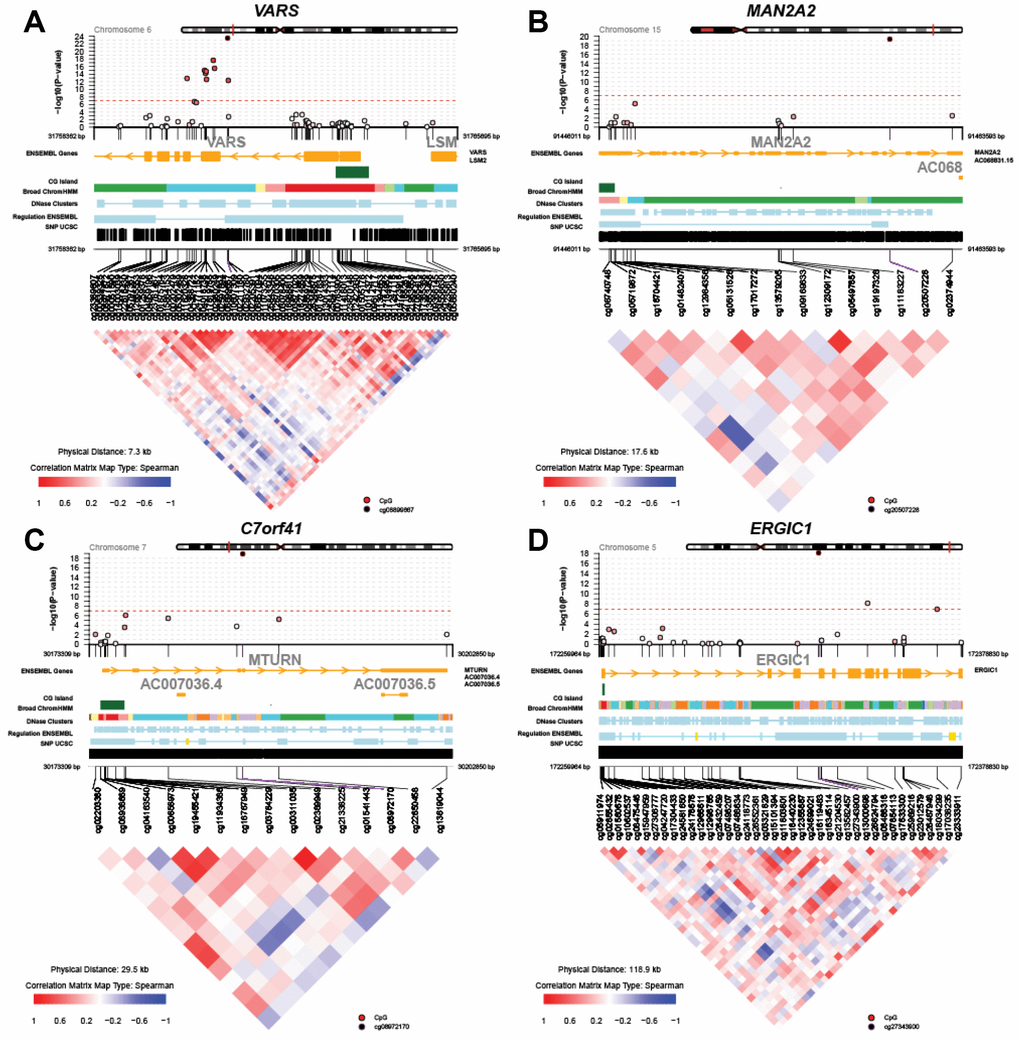
Figure 2. Regional Manhattan plots and inter-CpG correlations for the top four genes identified in the global meta-analysis. (A) VARS; (B) MAN2A2; (C) C7orf41 (MTURN); (D) ERGIC1.
The group-specific meta-analyses also detected several significant (P<1E-07) CpGs associated with the fully adjusted LTL. Figure 3 shows that 25 CpGs were significant in men of European ancestry, three CpGs in men of African ancestry, 19 CpGs in women of European ancestry, and four CpGs in women of African ancestry. Figure 4 displays scatter plots across the four group-specific meta-analyses. The correlation coefficient of each scatter plot was lowest between African American females and European males (r=-0.02) and highest between European females and European males (r=0.40). Population and sample size differences between strata may influence the correlations. The black dots in the panels refer to the top 30 CpG sites detected through the global meta-analysis. Across the 30 CpGs, we did observe high correlations (r≈0.92).
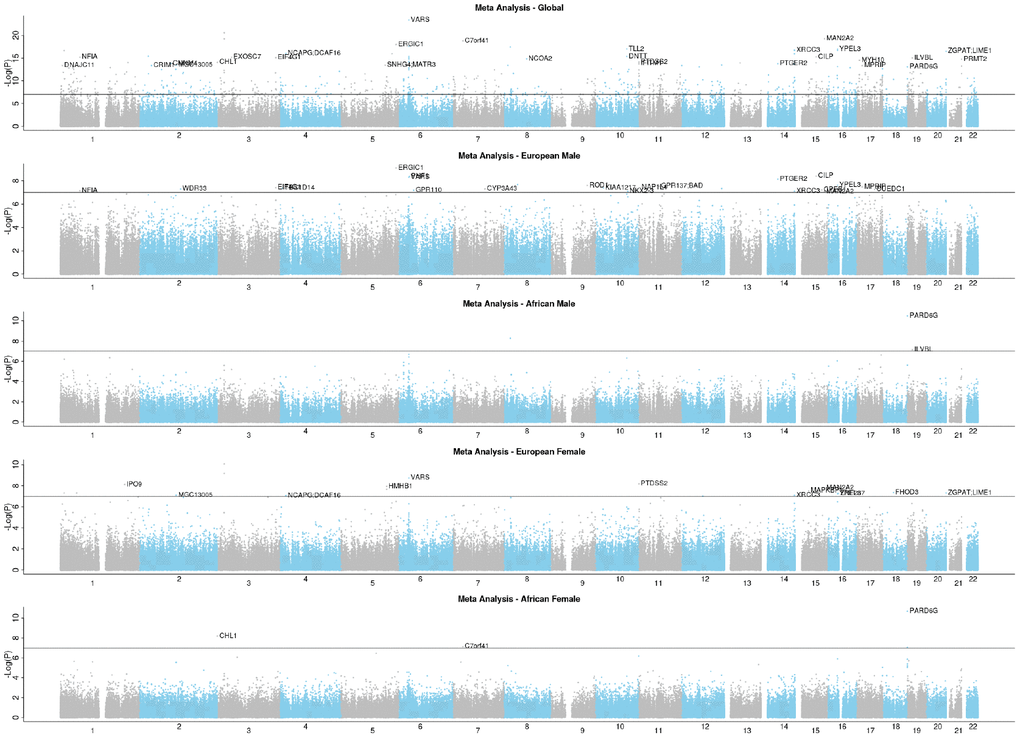
Figure 3. EWAS Manhattan plots of the fully adjusted LTL.
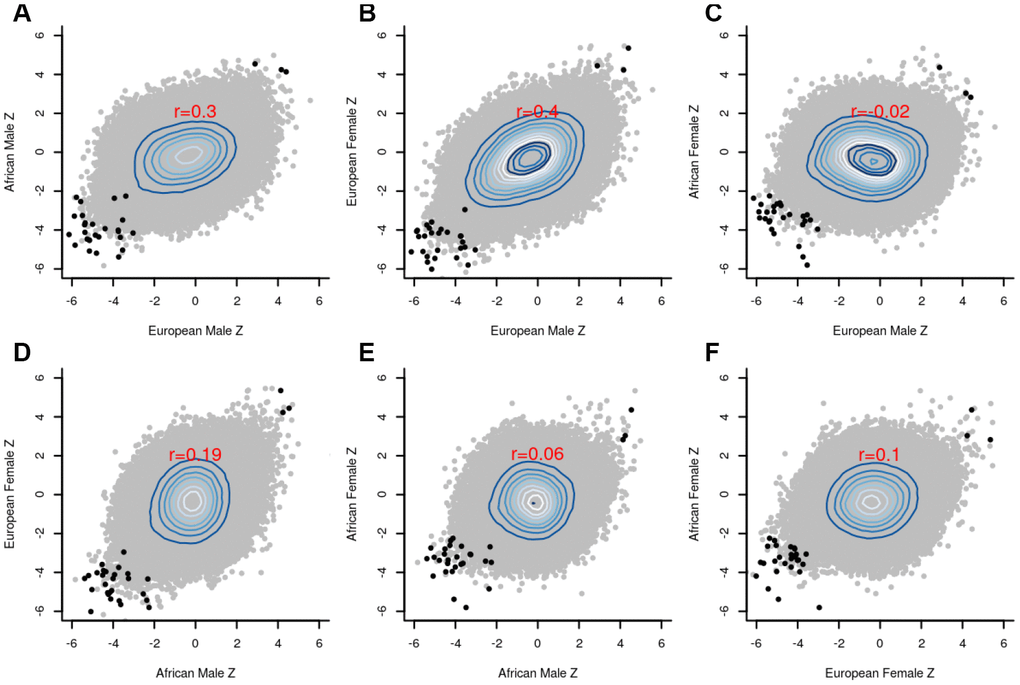
Figure 4. Scatter plots between the group-specific meta-Z scores. (A) European male vs African male; (B) European male vs European female; (C) European male vs African female; (D) African male vs European female; (E) African male vs African female; (F) African female vs European female; The black dots in the panels refer to the top 30 CpG sites detected by the global meta-analysis, whereas the grey dots indicate the remaining CpG sites. Pearson correlation coefficients (red font) reveal strong agreement (r=0.4) between males and females of European ancestry.
Functional enrichment analysis of LTL-associated CpG sites
To infer the biological meaning underlying LTL-associated CpG sites, the Genomic Regions Enrichment of Annotations Tool (GREAT) was used to associate differentially methylated probes (DMPs) with nearby genes of known pathway annotations. We performed both a gene-based and a region-based enrichment analysis for (1) all DMPs (n=850), (2) hypermethylated probes (n=95), and (3) hypomethylated probes (n=755). Analyzing all DMPs, we found 11 biological annotations to be significantly enriched with both the gene-based as well as the region-based test (Supplementary File 2, Figure S1, Table S1). Of these, five annotations showed a region-fold enrichment > 1.5; the circadian clock (3.9x), blood coagulation (1.9x), hemostasis (1.9x), wound healing (1.8x), and response to wounding (1.7x). Other annotations also related to circadian rhythm, blood coagulation and wound healing, further strengthening the main observations (Supplementary File 2, Tables S1, S2).
Next, analyzing hypomethylated probes only, we found that CpGs negatively correlated with LTL mainly explain the above-mentioned functional enrichment. In contrast, hypermethylated probes led to less significant enrichment p values, a finding likely due to the lower number of CpGs (Supplementary File 3). We observed an enrichment of genes involved in mitogen-activated protein kinase phosphatase activity and immune regulation (Supplementary File 2, Figure S1). As part of a robustness/sensitivity analysis, we repeated the enrichment study after excluding CpGs with single-nucleotide polymorphisms (SNPs) in the extension base (global minor allele frequency > 1%) or probes prone to mapping to multiple regions in the genome. Across overlapping annotations (n=1,590), we found high concordance with our initial findings (r=0.97, P<2.2E-16), indicating that our results are highly robust against potentially faulty probes. Details can be found in Supplementary File 3.
DNA methylation in subtelomeric regions
We observed a higher proportion of the positive LTL-DNAm correlations in subtelomeric regions than in non-subtelomeric regions when we focused on the 823 significant CpGs that were associated with the fully adjusted LTL. The proportion of the positive LTL-DNAm correlations was 17.1% in the subtelomeric regions and 9.9% in the non-subtelomeric bodies (Chi-squared test, P=0.01; Supplementary File 2, Table S3). The subtelomeric regions were defined as each chromosome’s head and tail, each of which was 5% of each chromosome’s length. However, this approach may not be optimal for the following reasons: 1) the inter-CpG correlations may differ between the non-subtelomeric and subtelomeric regions; 2) one cannot clearly dichotomize genomic loci into non-subtelomeric and subtelomeric regions; and 3) the LTL measurements were not chromosome-specific but averaged across all chromosomes.
Summary-data-based Mendelian randomization
We calculated the causal effects of the 823 CpGs (significantly associated with the fully adjusted LTL) on LTL using summary-data-based Mendelian randomization (SMR) [30] and found that 16 CpGs had a significant (P<0.05) causal effect on LTL (Supplementary File 2, Table S5). The causal effect of cg00622799 near RTEL1 led to the lowest p-value (P= 6E-4) among the 823 CpGs when SNP rs909334 was used as an instrumental variable. A non-significant p-value (P=0.21) for the test for heterogeneity in independence instruments (HEIDI) is desirable because it indicates that rs909334 (instrumental variable) is the only SNP that influences LTL through the DNAm level at cg00622799. A GWAS of LTL [21] and cis methylation quantitative trait locus (cis-mQTL, a reduced GWAS of DNAm) [31] were used to obtain the SMR causal effects (betas), p-values and HEIDI p-values. The SMR p-value identifies possible methylation sites via which genetic variants (SNPs) might be influencing LTL. The HEIDI p-value then indicates the evidence that there is (1) a single causal SNP whose effect on LTL is mediated through the methylation CpG site (HEIDI P>0.05) or (2) different SNPs linked to the methylation level and LTL (HEIDI P<0.05).
Additionally, we examined whether the 823 CpGs overlapped significantly with 54,942 known cis-methylation QTLs. Strikingly, a highly significant number of CpGs (188 CpGs out of 823 CpGs) were known cis-mQTLs (hypergeometric test P= 1.02E-16). To carry out this overlap analysis, we retrieved 188 SNPs each of which corresponded to the 188 CpGs from the cis-mQTL summary statistics. Next, we looked up each of the 188 SNPs in the most recent GWAS catalogue database (v1.02, https://www.ebi.ac.uk/gwas/docs/file-downloads). 22 SNPs were associated with complex traits (Supplementary File 2, Table S6). Among these 22 SNPs, rs2540949 in CEP68 was associated with atrial fibrillation, and rs17708984 in TPM4 (GWAS P=6E-16) was associated with platelet count (Supplementary File 2, Table S6). Platelet count is related to blood coagulation and wound healing, which were identified through the functional gene enrichment analysis of the LTL-associated CpGs described above.
Weighted correlation network analysis (WGCNA)
Weighted correlation network analysis (WGCNA) identified four important co-methylated modules (labeled black, red, ivory and yellow in Figure 5) using FHS, JHS and WHI (n=3,329). Hypermethylation in the black module was associated with increased age, shortened LTL, decreased CD8+ naïve T cell counts, and increased exhausted cytotoxic T cell counts, whereas hypermethylation in the red module showed opposite correlations. Elevated methylation levels in the yellow module were correlated with longer LTL and higher CD8+ naïve T cell counts. The ivory module had a pattern similar to the one in the black module. None of the modules revealed any strong correlation with the fully adjusted LTL, which is not surprising as this measure of LTL is adjusted for age and white blood cell type composition. The relationships between co-methylated module representatives and traits of interest (LTL, the partially adjusted LTL, fully adjusted LTL, age, and white blood cell counts) are displayed in Figure 6.
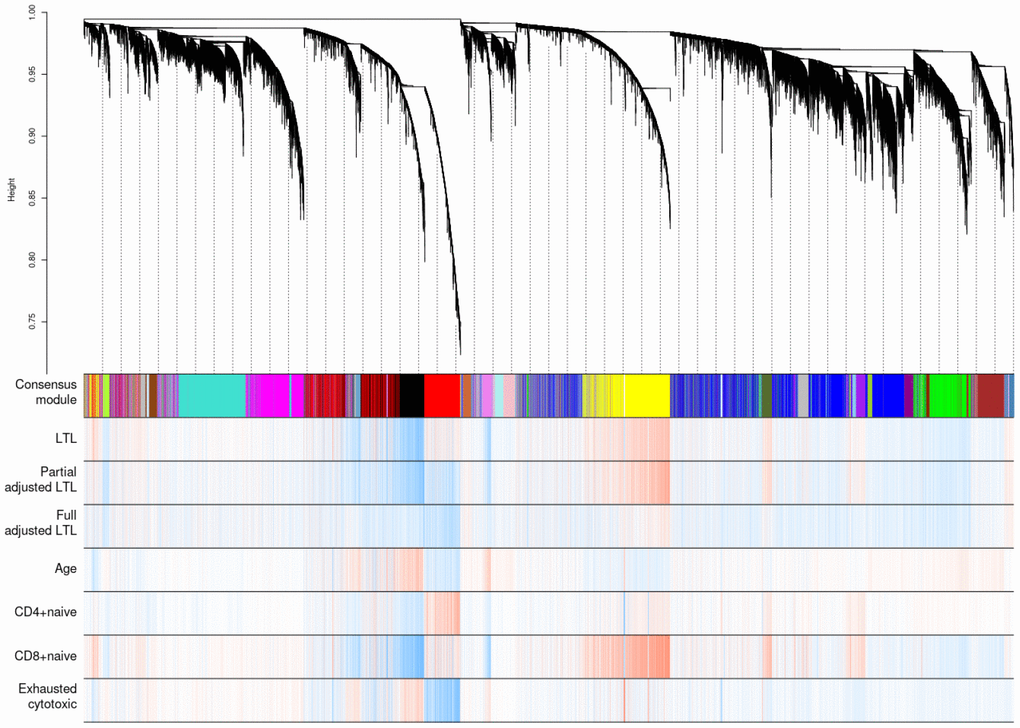
Figure 5. Hierarchical clustering of CpG sites by weighted gene co-expression network analysis (WGCNA). Each data point on the x-axis of the dendrogram refers to an individual CpG site. The color band ‘Consensus module’ displays co-methylated modules (clusters) in different colors. The other color bands highlight the degree of correlations between DNA methylation of CpG sites and traits of interest. Red represents a positive correlation, whereas blue represents a negative correlation.
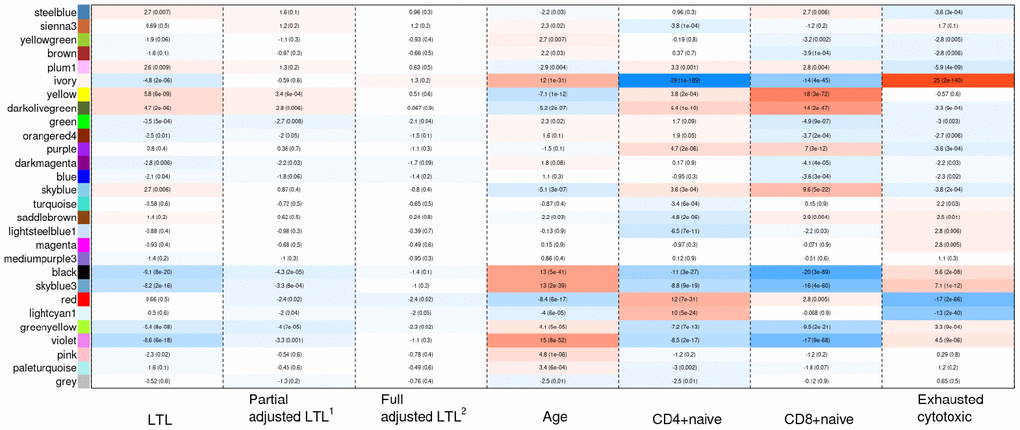
Figure 6. Heat map of correlations between the co-methylated module representatives and LTL, the partially adjusted LTL, the fully adjusted LTL, age, and blood cell counts. The numbers in the cells refer to meta-Z scores and their corresponding p-values. Meta-Z scores were calculated based on biweight midcorrelations between DNAm and a trait of interest in the six strata. 1Partially adjusted LTL for age, sex and ethnicity. 2Fully adjusted LTL for age, sex, ethnicity, CD4+ naïve, CD8+ naïve and exhausted cytotoxic T cell.
Discussion
This multi-ethnic EWAS of LTL is the largest to date and revealed strong associations between LTL and DNAm levels in all groups defined by sex and ancestry. Our stratified analysis showed that the EWAS findings for women of African ancestry are distinct from those of three other groups: males of African ancestry, males and females of European ancestry. A detailed analysis reveals that this difference does not reflect differences in sample size, age distribution, or LTL. We analyzed 1,532 blood samples from women of African ancestry, 697 from men of African ancestry, 1,389 from men of European ancestry, and 2,095 from women of European ancestry. Although men of African ancestry had the smallest sample size, their EWAS results were consistent with those from the two European groups.
Our unadjusted meta-analysis across the groups revealed profound relationships between TL and global DNA methylation levels, which largely reflect confounding by blood cell composition. However, one can observe genome-wide significant relationships between methylation levels and LTL even after adjusting for differences in blood cell composition. In particular, we report 823 CpGs (close to or within 557 genes) that are significantly correlated with the fully adjusted LTL. More than 88 percent (730 CpGs) of these 823 significant CpG sites exhibit a negative correlation with LTL, meaning that higher methylation levels are associated with shorter LTL at these CpG sites.
Among the 823 CpGs, the top 10 CpGs were linked to seven genes/loci (VARS, MAN2A2, C7orf41, ERGIC1, TLL2, YPEL3 and XRCC3). VARS encodes the enzyme Valyl-tRNA synthetase that is critical in eukaryotic translation [32]. Mutations in VARS cause neurodevelopmental disorders, such as microcephaly, cortical dysgenesis, seizures, and progressive cerebral atrophy [32, 33]. MAN2A2 encodes alpha-mannosidase 2x that is active in N-glycan biosynthesis [34]. MAN2A2 null males were largely infertile in mouse studies [35]. C7orf41 (current official name, MTURN), encodes Maturin, a protein that controls neurogenesis in the early nervous systems [36]. ERGIC1 encodes a cycling membrane protein that contributes to membrane trafficking and selective cargo transport between intermediate compartments [37, 38]. TLL2 encodes Tolloid-like protein 2 [39] and is associated with attention-deficit/hyperactivity disorder [40]. YPEL3 codes for Yippee-like 3, a protein that suppresses tumor growth, proliferation and metastasis in several types of cancer [41, 42]. XRCC3 encodes a RecA/Rad51-related protein that maintains chromosome stability and repairs DNA damage [43, 44].
Functional enrichment studies demonstrate that the significant CpG sites were located near genes that play a role in circadian clock, blood coagulation, and wound healing, respectively. A rich literature links TL to circadian rhythm. For example, cellular senescence impairs circadian rhythmicity both in vitro and in vivo [45]. Sleep disorders and shorter sleep duration are associated with shorter telomeres [46, 47]. Telomerase and TERT mRNA expression are furthermore under the control of CLOCK-BMAL1 regulation (a core component of the circadian clock) and exhibit endogenous circadian rhythms [48]. CLOCK-deficient mice display shortened TL and abnormal oscillations of telomerase activity [48]. Our results are in line with these findings and support a relationship between LTL and circadian rhythm.
TL has also been associated with wound healing and blood coagulation. For example, mice with longer telomeres show higher wound healing rates of the skin [49]. Furthermore, exogenous delivery of the human TERT gene significantly improved wound healing in an aged rabbit model [50]. In humans, poor wound healing has been reported in individuals with dyskeratosis congenita, a rare congenital disorder caused by a defect in telomere maintenance [51]. While assigning causality remains a challenge, our findings do provide evidence that telomere functioning is associated with the circadian clock, wound healing and blood coagulation through the DNA methylome in a population-based sample. Future work is needed to further understand the mechanisms by which this is regulated and how it impacts human health and diseases.
Our findings were based on a considerably larger sample size (n=5,713) than previous studies. Buxton et al. (2014) used 24 blood and 36 Epstein-Barr virus cell-line samples of 44 to 45 years old males and identified 65 and 36 TL-associated gene promoters, respectively [27]. Gadalla et al. (2012) was based on a sample of 40 cases with dyskeratosis congenita and 51 controls [28], and the authors reported a positive correlation between LTL and methylation at LINE-1 and subtelomeric sites only among the cases. Bell and colleagues performed an EWAS of age, TL and other age-related phenotypes using 172 samples of female twins [26]. Due to the small sample size, the authors could not find genome-wide significant associations between DNAm levels and TL.
We adjusted LTL for imputed blood cell composition in addition to age, sex, and ethnicity, because blood cell composition confounds the relationship between DNAm [52, 53] and LTL [54]. Consistent with previous findings, our WGCNA analyses in Figure 5 also showed that the black, red, and yellow modules were highly related to both blood cell counts and LTL. One concern was that blood cell counts might be causally influenced by DNAm and LTL (i.e., blood cell counts might be a collider between DNAm and LTL), which may introduce bias in LTL-DNAm correlations. Thus, we ran another EWAS without considering blood cell counts and compared LTL-DNAm correlations before and after adjustment for blood cell counts (Supplementary File 1). The correlations listed in Table 1 became slightly weaker after adjustment for blood cell counts but remained significant nonetheless. However, the number of associated CpG sites was greatly reduced after adjustment for blood cell counts. Cell type heterogeneity is thus an important variable to consider in studies of telomere length. Future work should be extended to cell type-specific analysis as well as to tissues beyond whole blood.
We did not adjust LTL for cigarette smoking in our main analyses because smoking had a non-significant effect on LTL (FHS: P=0.83 for never vs former smoker and P=0.76 for never vs current smoker; WHI: P=0.20 for never vs former smoker and P=0.24 for never vs current smoker), though suggestive associations could be found in JHS (P=0.08 for never vs former smoker and P=0.02 for never vs current smoker). These results pointing to a very weak effect of smoking are consistent with those from Astuti and colleagues [55] who reported that 50 of 84 studies found no association between smoking and TL, although their meta-analysis concluded that smokers may have shorter TL. Our sensitivity analyses also revealed that all the 823 CpGs remained significant regardless of smoking variables. Our EWAS summary statistics includes this sensitivity analysis with additional adjustment for smoking (see the names of columns starting with “aaa_” in Supplementary File 1).
One limitation of our study is that it does not elucidate the biological pathways or mechanisms linking DNAm and LTL. In other words, our findings do not explain whether DNAm shortens or lengthens LTL, or whether LTL regulates DNAm. Second, we did not include genotypic information in our analyses. Other studies have suggested that genomic variants might regulate DNAm [31] and LTL [21–24, 56]. Third, LTL measurement is sensitive to the methods used for DNA extraction and LTL estimation [57]. Fourth, we only used EWAS and WGCNA to analyze the data. A supervised machine-learning approach for predicting TL based on DNAm levels will be described in a separate article [58].
This study represents the largest EWAS analysis of DNA methylation and LTL to date. We identified over 800 genome-wide significant CpG sites that are located in or near genes with links to circadian rhythm, blood coagulation and wound healing. These findings link two hallmarks of aging: epigenetic changes and telomere biology.
Materials and Methods
Study population
The FHS Offspring Cohort started in 1971 to inaugurate epidemiological studies of young adults in Framingham, Massachusetts, USA. The FHS recruited 5,124 individuals and invited them to examinations at the FHS facilities [59]. The JHS recruited 5,306 African Americans from 2000 to 2004 in the Jackson metropolitan area, Mississippi, USA, to investigate risk factors for cardiovascular disease [60]. Participants provided medical history, social records and whole-blood samples. The WHI started in 1992 and enrolled 64,500 postmenopausal women aged between 50 and 79 years into either clinical trials or observational studies [61]. Among many sub-studies, WHI “Broad Agency Award 23” has provided both blood-based LTL and DNAm array data. The BHS started in 1972 and has recruited multiple waves of participants from childhood, adolescence and adulthood in Louisiana, USA [62]. The LBC1921 and LBC1936 are longitudinal studies of 550 individuals born in Scotland in 1921 and of 1091 individuals born in Scotland in 1936. The studies were set up in 1999 and 2004, respectively, with the aim of studying cognitive aging [63, 64]. The LSADT was initiated in 1995 and is a cohort-sequential study of Danish twins aged 70 years or more [65, 66]. Surviving twins were surveyed every second year until 2005. In 1997, whole blood samples were collected from 689 same-sex twins and the present study included all twin pairs who participated in the 1997 wave and for whom LTL measurements were available.
The sample size of each cohort used in this study as follows: FHS (n=874), JHS (n=1,637), WHI (n=818), BHS (n=831), LBC1921 (n=403), LBC1936 (n=906), and LSADT (n=244).
Measurement of LTL
LTL was measured by either of two methods: Southern blot [67] or qPCR [9]. All cohorts used Southern blot, except for LBC1921 and LBC1936 that used qPCR. LTL measurement by Southern blot provides the mean of TRFs, whereas qPCR provides the ratio of telomeric template to glyceraldehyde 3-phosphate dehydrogenase. The average inter-assay coefficients of variation were 2.4% in FHS, 2.0% in JHS, 2.0% in WHI, 1.4% in BHS, 5.1% in LBC (LBC1921 and LBC1936 combined), and 2.5% in LSADT. Further details on the measurement of LTL in each cohort are provided in Supplementary File 2.
Measurement of DNA methylation
DNAm data were generated on either of two different Illumina array platforms: the Illumina Infinium HumanMehtylation450 Bead-Chip (Illumina, San Diego, CA, USA) or the Illumina Infinium MethylationEPIC Bead-Chip (Illumina, San Diego, CA, USA). Beta values were computed, which quantify methylation levels between 0 and 1, with 0 being unmethylated and 1 being fully methylated. Further details on normalization and quality control of the data can be found in Supplementary File 2.
Statistical analysis
We stratified the seven cohorts (FHS, JHS, WHI, BHS, LBC1921, LBC1936 and LSADT) by sex, ethnicity and batch, which resulted in 16 strata (Table 2).
Table 2. Sample size of the 16 strata used in the meta-analyses.
| Cohort | Stratum | Sample size | Mean age (range) | Mean LTL2 (range) | Age-LTL correlation3 | ||||||||||||||||||||||||||||||||||||||||||||||||||||||||||||||||||||||||||||||||||||||||||||||
| FHS | European female | 442 | 57 (33-81) | 7.07 (5.51-8.7) | -0.29 | ||||||||||||||||||||||||||||||||||||||||||||||||||||||||||||||||||||||||||||||||||||||||||||||
| European male | 432 | 58 (36-82) | 6.92 (5.59-8.52) | -0.34 | |||||||||||||||||||||||||||||||||||||||||||||||||||||||||||||||||||||||||||||||||||||||||||||||
| JHS | African female | 1034 | 56 (23-92) | 7.22 (4.93-10.03) | -0.39 | ||||||||||||||||||||||||||||||||||||||||||||||||||||||||||||||||||||||||||||||||||||||||||||||
| African male | 603 | 55 (22-93) | 7.06 (5.12-9.24) | -0.45 | |||||||||||||||||||||||||||||||||||||||||||||||||||||||||||||||||||||||||||||||||||||||||||||||
| WHI | African female | 342 | 63 (50-80) | 7.12 (5.57-9.06) | -0.24 | ||||||||||||||||||||||||||||||||||||||||||||||||||||||||||||||||||||||||||||||||||||||||||||||
| European female | 476 | 68 (51-80) | 6.77 (5.24-8.49) | -0.27 | |||||||||||||||||||||||||||||||||||||||||||||||||||||||||||||||||||||||||||||||||||||||||||||||
| BHS | African female | 156 | 44 (30-54) | 7.34 (5.35-9.22) | -0.08 | ||||||||||||||||||||||||||||||||||||||||||||||||||||||||||||||||||||||||||||||||||||||||||||||
| African male | 94 | 44 (33-49) | 7.21 (5.60-9.47) | -0.17 | |||||||||||||||||||||||||||||||||||||||||||||||||||||||||||||||||||||||||||||||||||||||||||||||
| European female | 315 | 43 (29-55) | 6.82 (5.02-9.17) | -0.08 | |||||||||||||||||||||||||||||||||||||||||||||||||||||||||||||||||||||||||||||||||||||||||||||||
| European male | 266 | 43 (28-52) | 6.75 (5.27-8.54) | -0.18 | |||||||||||||||||||||||||||||||||||||||||||||||||||||||||||||||||||||||||||||||||||||||||||||||
| LBC19211 | European female | 242 | 79 (78-80) | 3.99 (3.00-4.72) | -0.29 | ||||||||||||||||||||||||||||||||||||||||||||||||||||||||||||||||||||||||||||||||||||||||||||||
| European male | 161 | 79 (78-81) | 4.26 (3.46-5.31) | -0.29 | |||||||||||||||||||||||||||||||||||||||||||||||||||||||||||||||||||||||||||||||||||||||||||||||
| LBC19361 | European female | 448 | 70 (68-71) | 4.05 (2.69-6.00) | 0.01 | ||||||||||||||||||||||||||||||||||||||||||||||||||||||||||||||||||||||||||||||||||||||||||||||
| European male | 458 | 70 (68-71) | 4.33 (2.99-7.12) | 0.17 | |||||||||||||||||||||||||||||||||||||||||||||||||||||||||||||||||||||||||||||||||||||||||||||||
| LSADT | European female | 172 | 79 (73-90) | 5.79 (3.94-7.38) | -0.25 | ||||||||||||||||||||||||||||||||||||||||||||||||||||||||||||||||||||||||||||||||||||||||||||||
| European male | 72 | 79 (74-87) | 5.60 (4.53-6.78) | -0.17 | |||||||||||||||||||||||||||||||||||||||||||||||||||||||||||||||||||||||||||||||||||||||||||||||
| 1 LBC recruited adults living in and around Edinburgh and who were born in 1921 and 1936. | |||||||||||||||||||||||||||||||||||||||||||||||||||||||||||||||||||||||||||||||||||||||||||||||||||
| 2 In kilobases; LTL measurement in TRF (Southern blot): FHS, JHS, WHI, BHS and LSADT; LTL measurement in T/S (qPCR): LBC1921 and LBC1936. | |||||||||||||||||||||||||||||||||||||||||||||||||||||||||||||||||||||||||||||||||||||||||||||||||||
| 3 Pearson correlation coefficients. | |||||||||||||||||||||||||||||||||||||||||||||||||||||||||||||||||||||||||||||||||||||||||||||||||||
In each of the 16 strata, we applied two sets of adjustments on LTL using a regression: 1) partially adjusted for age alone, and 2) fully adjusted for age and DNAm-based estimated cell type proportions (CD4+ naïve, CD8+ naïve T cell and exhausted cytotoxic T cell). In FHS and LSADT, we used a linear mixed model to regress LTL on the adjusting variable(s) (fixed effect) and family structure (random effect). In JHS, WHI, BHS, LBC1921 and LBC1936, an ordinary linear regression was used. The blood cell type proportions were estimated using Horvath’s DNAm age calculator (https://dnamage.genetics.ucla.edu/home), with the exception of LSADT where the blood cell counts were estimated using Houseman et al. (2012)’s method [68].
The R package for weighted gene co-expression network analysis (WGCNA; [69]) was used to compute epigenome-wide biweight midcorrelations between DNAm levels and adjusted LTL in each of the 16 strata. The biweight midcorrelation is an attractive method for computing correlation coefficients because 1) it is more robust than Pearson correlation and 2) unlike the Spearman correlation, it preserves the biological signal as shown in large empirical studies [70]. We focused on 441,870 autosomal probes that were shared between the 450K and the EPIC array. We combined the 16 sets of EWAS summary statistics into four group-specific or one global meta summary statistics as described in Figure 1. Meta Z values and the corresponding p-values were computed as
Genomic Regions Enrichment of Annotations Tools (GREAT, v3.0) was used to predict the biological function of DMPs by associating both proximal and distal genomic CpG sites with their putative target genes [71]. GREAT implements both a gene-based test and a region-based test using the hypergeometric and binomial test, respectively, to assess enrichment of genomic regions in biological annotations. DMPs were uploaded to the GREAT web portal (http://great.stanford.edu/public/html/) and analyses were run using the hg19 reference annotation and the whole genome as background. Genomic regions were assigned to genes if they are between 5 Kb upstream and 1 Kb downstream of the TSS, plus up to 1 Mb distal. Pathway annotations from GO Biological Processes, GO Cellular Component, GO Molecular Function, MSigDB, and PANTHER were used to infer the biological meanings behind the DMPs that were associated with LTL. GREAT outputs statistics of the gene-based and region-based tests, which were subsequently adjusted for multiple testing using the Bonferroni correction.
The SMR executable software (https://cnsgenomics.com/software/smr/#Download) was used to calculate the causal effects of the selected CpGs on LTL [30]. The SMR obtains a causal effect estimate
WGCNA performed a consensus network analysis using FHS, JHS and WHI. 30,000 randomly selected CpG sites were used to improve readability (resulting in a single cluster tree) and offset computational limitations. WGCNA hierarchically clustered the 30,000 CpGs based on their similarities. The merging threshold of clusters (modules) was 0.15. All the statistical analyses were performed using R version 3.5.1.
Abbreviations
LTL: leukocyte telomere length; TL: telomere length; DNAm: DNA methylation; TRF: terminal restriction fragment; qPCR: quantitative real-time polymerase chain reaction; GWAS: Genome-wide association study; EWAS: epigenome-wide association study; FHS: the Framingham Heart Study; JHS: the Jackson Heart Study; WHI: the Women’s Health Initiative; BHS: the Bogalusa Heart Study; LBC: the Lothian Birth Cohorts; LSADT: the Longitudinal Study of Aging Danish Twins; DMP: differentially methylated probe; SNP: single-nucleotide polymorphism; SMR: summary-data-based Mendelian randomization; HEIDI: heterogeneity in independence instruments; mQTL: methylation quantitative trait locus; WGCNA: Weighted correlation network analysis; DC: dyskeratosis congenita; qPCR: quantitative real-time polymerase chain reaction; GREAT: Genomic Regions Enrichment of Annotations Tools.
Author Contributions
YL and SH conducted EWAS of LTL using FHS, JHS and WHI and wrote the manuscript. DS, AS and MS conducted EWAS of LTL using BHS, LBC and LSADT, respectively. AO conducted gene enrichment analyses and wrote the biological interpretations. The remaining authors contributed data, helped with manuscript preparation, and interpreted the results.
Conflicts of Interest
The authors have no conflicts of interest.
Funding
This work was partly supported by a grant from the Norwegian Research Council (NRC) to AJ (project number 262043), additional funding from NRC through a Personal Overseas Research Grant to YL (project number 262043/F20) and a grant from NIH to AA (R01HL134840-01).
SH and ATL acknowledge support from 1U01AG060908-01.
FHS is funded by the National Institute of Health (NIH) contract N01-HC-25195 and HHSN268201500001I. The laboratory work for this investigation was funded by the Division of Intramural Research, National Heart, Lung, and Blood Institute, NIH. The analytical component of this project was funded by the Division of Intramural Research, National Heart, Lung, and Blood Institute, and the Center for Information Technology, NIH, Bethesda, MD. JMM and KLL were supported by R01AG029451.
JHS is supported and conducted in collaboration with Jackson State University (HHSN268201800013I), Tougaloo College (HHSN268201800014I), the Mississippi State Department of Health (HHSN268201800015I/HHSN26800001) and the University of Mississippi Medical Center (HHSN268201800010I, HHSN268201800011I and HHSN268201800012I) contracts from the National Heart, Lung, and Blood Institute and the National Institute for Minority Health and Health Disparities. The authors also wish to thank the staff and participants of the JHS. JGW is supported by U54GM115428 from the National Institute of General Medical Sciences.
WHI program is funded by the National Heart, Lung, and Blood Institute, NIH, and the U.S. Department of Health and Human Services through contracts HHSN268201600018C, HHSN268201600001C, HHSN268201600002C, HHSN268201600003C, and HHSN268201600004C. The authors thank the WHI investigators and staff for their dedication, and the study participants for making the program possible. A full listing of WHI investigators can be found at: http://www.whi.org/researchers/Documents%20%20Write%20a%20Paper/WHI%20Investigator%20Long%20List.pdf
BHS was supported by grants R01AG016592 and R03AG060619 from National Institute of Aging. We thank the participants and investigators and staff members of the BHS for their outstanding commitment and cooperation.
LBC1921 was supported by the UK’s Biotechnology and Biological Sciences Research Council (BBSRC), a Royal Society–Wolfson Research Merit Award to IJD, and the Chief Scientist Office (CSO) of the Scottish Government’s Health Directorates. LBC1936 is supported by Age UK (Disconnected Mind program) and the Medical Research Council (MR/M01311/1). Methylation typing was supported by Centre for Cognitive Ageing and Cognitive Epidemiology (Pilot Fund award), Age UK, The Wellcome Trust Institutional Strategic Support Fund, The University of Edinburgh, and The University of Queensland. This work was in part conducted in the Centre for Cognitive Ageing and Cognitive Epidemiology, which is supported by the Medical Research Council and Biotechnology and Biological Sciences Research Council (MR/K026992/1). AS is supported by a Medical Research Council PhD Studentship in Precision Medicine with funding by the Medical Research Council Doctoral Training Program and the University of Edinburgh College of Medicine and Veterinary Medicine. REM is supported by the Alzheimer’s Research UK major project grant ARUK-PG2017B-10. The authors thank LBC study participants and research team members who have contributed, and continue to contribute, to ongoing LBC studies.
LSADT was funded by The Danish Council for Independent Research – Medical Sciences (DFF-6110-00016), NIH (NIH-NIA P01 AG08761) and the European Union’s Seventh Framework Program (FP7/2007-2011) under grant agreement number 259679.
References
- 1. Blackburn EH. Telomeres and telomerase: their mechanisms of action and the effects of altering their functions. FEBS Lett. 2005; 579:859–62. https://doi.org/10.1016/j.febslet.2004.11.036 [PubMed]
- 2. Wright WE, Piatyszek MA, Rainey WE, Byrd W, Shay JW. Telomerase activity in human germline and embryonic tissues and cells. Dev Genet. 1996; 18:173–79. https://doi.org/10.1002/(SICI)1520-6408(1996)18:2<173::AID-DVG10>3.0.CO;2-3 [PubMed]
- 3. Chiu CP, Dragowska W, Kim NW, Vaziri H, Yui J, Thomas TE, Harley CB, Lansdorp PM. Differential expression of telomerase activity in hematopoietic progenitors from adult human bone marrow. Stem Cells. 1996; 14:239–48. https://doi.org/10.1002/stem.140239 [PubMed]
- 4. Yui J, Chiu CP, Lansdorp PM. Telomerase activity in candidate stem cells from fetal liver and adult bone marrow. Blood. 1998; 91:3255–62. [PubMed]
- 5. Shay JW, Wright WE. The reactivation of telomerase activity in cancer progression. Trends Genet. 1996; 12:129–31. https://doi.org/10.1016/0168-9525(96)30018-8 [PubMed]
- 6. Gomes NM, Ryder OA, Houck ML, Charter SJ, Walker W, Forsyth NR, Austad SN, Venditti C, Pagel M, Shay JW, Wright WE. Comparative biology of mammalian telomeres: hypotheses on ancestral states and the roles of telomeres in longevity determination. Aging Cell. 2011; 10:761–68. https://doi.org/10.1111/j.1474-9726.2011.00718.x [PubMed]
- 7. Allsopp RC, Vaziri H, Patterson C, Goldstein S, Younglai EV, Futcher AB, Greider CW, Harley CB. Telomere length predicts replicative capacity of human fibroblasts. Proc Natl Acad Sci USA. 1992; 89:10114–18. https://doi.org/10.1073/pnas.89.21.10114 [PubMed]
- 8. Gardner M, Bann D, Wiley L, Cooper R, Hardy R, Nitsch D, Martin-Ruiz C, Shiels P, Sayer AA, Barbieri M, Bekaert S, Bischoff C, Brooks-Wilson A, et al, and Halcyon study team. Gender and telomere length: systematic review and meta-analysis. Exp Gerontol. 2014; 51:15–27. https://doi.org/10.1016/j.exger.2013.12.004 [PubMed]
- 9. Cawthon RM. Telomere measurement by quantitative PCR. Nucleic Acids Res. 2002; 30:e47. https://doi.org/10.1093/nar/30.10.e47 [PubMed]
- 10. Hunt SC, Chen W, Gardner JP, Kimura M, Srinivasan SR, Eckfeldt JH, Berenson GS, Aviv A. Leukocyte telomeres are longer in African Americans than in whites: the National Heart, Lung, and Blood Institute Family Heart Study and the Bogalusa Heart Study. Aging Cell. 2008; 7:451–58. https://doi.org/10.1111/j.1474-9726.2008.00397.x [PubMed]
- 11. Elbers CC, Garcia ME, Kimura M, Cummings SR, Nalls MA, Newman AB, Park V, Sanders JL, Tranah GJ, Tishkoff SA, Harris TB, Aviv A. Comparison between southern blots and qPCR analysis of leukocyte telomere length in the health ABC study. J Gerontol A Biol Sci Med Sci. 2014; 69:527–31. https://doi.org/10.1093/gerona/glt121 [PubMed]
- 12. Aviv A, Shay JW. Reflections on telomere dynamics and ageing-related diseases in humans. Philos Trans R Soc Lond B Biol Sci. 2018; 373:373. https://doi.org/10.1098/rstb.2016.0436 [PubMed]
- 13. Stone RC, Horvath K, Kark JD, Susser E, Tishkoff SA, Aviv A. Telomere Length and the Cancer-Atherosclerosis Trade-Off. PLoS Genet. 2016; 12:e1006144. https://doi.org/10.1371/journal.pgen.1006144 [PubMed]
- 14. Samavat H, Xun X, Jin A, Wang R, Koh WP, Yuan JM. Association between prediagnostic leukocyte telomere length and breast cancer risk: the Singapore Chinese Health Study. Breast Cancer Res. 2019; 21:50. https://doi.org/10.1186/s13058-019-1133-0 [PubMed]
- 15. Andrew T, Aviv A, Falchi M, Surdulescu GL, Gardner JP, Lu X, Kimura M, Kato BS, Valdes AM, Spector TD. Mapping genetic loci that determine leukocyte telomere length in a large sample of unselected female sibling pairs. Am J Hum Genet. 2006; 78:480–86. https://doi.org/10.1086/500052 [PubMed]
- 16. Hjelmborg JB, Dalgård C, Möller S, Steenstrup T, Kimura M, Christensen K, Kyvik KO, Aviv A. The heritability of leucocyte telomere length dynamics. J Med Genet. 2015; 52:297–302. https://doi.org/10.1136/jmedgenet-2014-102736 [PubMed]
- 17. Slagboom PE, Droog S, Boomsma DI. Genetic determination of telomere size in humans: a twin study of three age groups. Am J Hum Genet. 1994; 55:876–82. [PubMed]
- 18. Vasa-Nicotera M, Brouilette S, Mangino M, Thompson JR, Braund P, Clemitson JR, Mason A, Bodycote CL, Raleigh SM, Louis E, Samani NJ. Mapping of a major locus that determines telomere length in humans. Am J Hum Genet. 2005; 76:147–51. https://doi.org/10.1086/426734 [PubMed]
- 19. Broer L, Codd V, Nyholt DR, Deelen J, Mangino M, Willemsen G, Albrecht E, Amin N, Beekman M, de Geus EJ, Henders A, Nelson CP, Steves CJ, et al. Meta-analysis of telomere length in 19,713 subjects reveals high heritability, stronger maternal inheritance and a paternal age effect. Eur J Hum Genet. 2013; 21:1163–68. https://doi.org/10.1038/ejhg.2012.303 [PubMed]
- 20. Zhu Y, Voruganti VS, Lin J, Matsuguchi T, Blackburn E, Best LG, Lee ET, MacCluer JW, Cole SA, Zhao J. QTL mapping of leukocyte telomere length in American Indians: the Strong Heart Family Study. Aging (Albany NY). 2013; 5:704–16. https://doi.org/10.18632/aging.100600 [PubMed]
- 21. Codd V, Nelson CP, Albrecht E, Mangino M, Deelen J, Buxton JL, Hottenga JJ, Fischer K, Esko T, Surakka I, Broer L, Nyholt DR, Mateo Leach I, et al, and CARDIoGRAM consortium. Identification of seven loci affecting mean telomere length and their association with disease. Nat Genet. 2013; 45:422–7, 427e1–2. https://doi.org/10.1038/ng.2528 [PubMed]
- 22. Levy D, Neuhausen SL, Hunt SC, Kimura M, Hwang SJ, Chen W, Bis JC, Fitzpatrick AL, Smith E, Johnson AD, Gardner JP, Srinivasan SR, Schork N, et al. Genome-wide association identifies OBFC1 as a locus involved in human leukocyte telomere biology. Proc Natl Acad Sci USA. 2010; 107:9293–98. https://doi.org/10.1073/pnas.0911494107 [PubMed]
- 23. Mangino M, Christiansen L, Stone R, Hunt SC, Horvath K, Eisenberg DT, Kimura M, Petersen I, Kark JD, Herbig U, Reiner AP, Benetos A, Codd V, et al. DCAF4, a novel gene associated with leucocyte telomere length. J Med Genet. 2015; 52:157–62. https://doi.org/10.1136/jmedgenet-2014-102681 [PubMed]
- 24. Mangino M, Hwang SJ, Spector TD, Hunt SC, Kimura M, Fitzpatrick AL, Christiansen L, Petersen I, Elbers CC, Harris T, Chen W, Srinivasan SR, Kark JD, et al. Genome-wide meta-analysis points to CTC1 and ZNF676 as genes regulating telomere homeostasis in humans. Hum Mol Genet. 2012; 21:5385–94. https://doi.org/10.1093/hmg/dds382 [PubMed]
- 25. Rakyan VK, Down TA, Balding DJ, Beck S. Epigenome-wide association studies for common human diseases. Nat Rev Genet. 2011; 12:529–41. https://doi.org/10.1038/nrg3000 [PubMed]
- 26. Bell JT, Tsai PC, Yang TP, Pidsley R, Nisbet J, Glass D, Mangino M, Zhai G, Zhang F, Valdes A, Shin SY, Dempster EL, Murray RM, et al, and MuTHER Consortium. Epigenome-wide scans identify differentially methylated regions for age and age-related phenotypes in a healthy ageing population. PLoS Genet. 2012; 8:e1002629. https://doi.org/10.1371/journal.pgen.1002629 [PubMed]
- 27. Buxton JL, Suderman M, Pappas JJ, Borghol N, McArdle W, Blakemore AI, Hertzman C, Power C, Szyf M, Pembrey M. Human leukocyte telomere length is associated with DNA methylation levels in multiple subtelomeric and imprinted loci. Sci Rep. 2014; 4:4954. https://doi.org/10.1038/srep04954 [PubMed]
- 28. Gadalla SM, Katki HA, Shebl FM, Giri N, Alter BP, Savage SA. The relationship between DNA methylation and telomere length in dyskeratosis congenita. Aging Cell. 2012; 11:24–28. https://doi.org/10.1111/j.1474-9726.2011.00755.x [PubMed]
- 29. Mansell G, Gorrie-Stone TJ, Bao Y, Kumari M, Schalkwyk LS, Mill J, Hannon E. Guidance for DNA methylation studies: statistical insights from the Illumina EPIC array. BMC Genomics. 2019; 20:366. https://doi.org/10.1186/s12864-019-5761-7 [PubMed]
- 30. Zhu Z, Zhang F, Hu H, Bakshi A, Robinson MR, Powell JE, Montgomery GW, Goddard ME, Wray NR, Visscher PM, Yang J. Integration of summary data from GWAS and eQTL studies predicts complex trait gene targets. Nat Genet. 2016; 48:481–87. https://doi.org/10.1038/ng.3538 [PubMed]
- 31. McRae AF, Marioni RE, Shah S, Yang J, Powell JE, Harris SE, Gibson J, Henders AK, Bowdler L, Painter JN, Murphy L, Martin NG, Starr JM, et al. Identification of 55,000 Replicated DNA Methylation QTL. Sci Rep. 2018; 8:17605. https://doi.org/10.1038/s41598-018-35871-w [PubMed]
- 32. Stephen J, Nampoothiri S, Banerjee A, Tolman NJ, Penninger JM, Elling U, Agu CA, Burke JD, Devadathan K, Kannan R, Huang Y, Steinbach PJ, Martinis SA, et al. Loss of function mutations in VARS encoding cytoplasmic valyl-tRNA synthetase cause microcephaly, seizures, and progressive cerebral atrophy. Hum Genet. 2018; 137:293–303. https://doi.org/10.1007/s00439-018-1882-3 [PubMed]
- 33. Karaca E, Harel T, Pehlivan D, Jhangiani SN, Gambin T, Coban Akdemir Z, Gonzaga-Jauregui C, Erdin S, Bayram Y, Campbell IM, Hunter JV, Atik MM, Van Esch H, et al. Genes that Affect Brain Structure and Function Identified by Rare Variant Analyses of Mendelian Neurologic Disease. Neuron. 2015; 88:499–513. https://doi.org/10.1016/j.neuron.2015.09.048 [PubMed]
- 34. Misago M, Liao YF, Kudo S, Eto S, Mattei MG, Moremen KW, Fukuda MN. Molecular cloning and expression of cDNAs encoding human alpha-mannosidase II and a previously unrecognized alpha-mannosidase IIx isozyme. Proc Natl Acad Sci USA. 1995; 92:11766–70. https://doi.org/10.1073/pnas.92.25.11766 [PubMed]
- 35. Akama TO, Nakagawa H, Sugihara K, Narisawa S, Ohyama C, Nishimura S, O’Brien DA, Moremen KW, Millan JL, Fukuda MN. Germ cell survival through carbohydrate-mediated interaction with Sertoli cells. Science. 2002; 295:124–27. https://doi.org/10.1126/science.1065570 [PubMed]
- 36. Martinez-De Luna RI, Ku RY, Lyou Y, Zuber ME. Maturin is a novel protein required for differentiation during primary neurogenesis. Dev Biol. 2013; 384:26–40. https://doi.org/10.1016/j.ydbio.2013.09.028 [PubMed]
- 37. Breuza L, Halbeisen R, Jenö P, Otte S, Barlowe C, Hong W, Hauri HP. Proteomics of endoplasmic reticulum-Golgi intermediate compartment (ERGIC) membranes from brefeldin A-treated HepG2 cells identifies ERGIC-32, a new cycling protein that interacts with human Erv46. J Biol Chem. 2004; 279:47242–53. https://doi.org/10.1074/jbc.M406644200 [PubMed]
- 38. Vainio P, Mpindi JP, Kohonen P, Fey V, Mirtti T, Alanen KA, Perälä M, Kallioniemi O, Iljin K. High-throughput transcriptomic and RNAi analysis identifies AIM1, ERGIC1, TMED3 and TPX2 as potential drug targets in prostate cancer. PLoS One. 2012; 7:e39801. https://doi.org/10.1371/journal.pone.0039801 [PubMed]
- 39. Scott IC, Clark TG, Takahara K, Hoffman GG, Eddy RL, Haley LL, Shows TB, Greenspan DS. Assignment of TLL1 and TLL2, which encode human BMP-1/Tolloid-related metalloproteases, to chromosomes 4q32—>q33 and 10q23—>q24 and assignment of murine Tll2 to chromosome 19. Cytogenet Cell Genet. 1999; 86:64–65. https://doi.org/10.1159/000015412 [PubMed]
- 40. Lesch KP, Timmesfeld N, Renner TJ, Halperin R, Röser C, Nguyen TT, Craig DW, Romanos J, Heine M, Meyer J, Freitag C, Warnke A, Romanos M, et al. Molecular genetics of adult ADHD: converging evidence from genome-wide association and extended pedigree linkage studies. J Neural Transm (Vienna). 2008; 115:1573–85. https://doi.org/10.1007/s00702-008-0119-3 [PubMed]
- 41. Tuttle R, Miller KR, Maiorano JN, Termuhlen PM, Gao Y, Berberich SJ. Novel senescence associated gene, YPEL3, is repressed by estrogen in ER+ mammary tumor cells and required for tamoxifen-induced cellular senescence. Int J Cancer. 2012; 130:2291–99. https://doi.org/10.1002/ijc.26239 [PubMed]
- 42. Tuttle R, Simon M, Hitch DC, Maiorano JN, Hellan M, Ouellette J, Termuhlen P, Berberich SJ. Senescence-associated gene YPEL3 is downregulated in human colon tumors. Ann Surg Oncol. 2011; 18:1791–96. https://doi.org/10.1245/s10434-011-1558-x [PubMed]
- 43. Pierce AJ, Johnson RD, Thompson LH, Jasin M. XRCC3 promotes homology-directed repair of DNA damage in mammalian cells. Genes Dev. 1999; 13:2633–38. https://doi.org/10.1101/gad.13.20.2633 [PubMed]
- 44. Tebbs RS, Zhao Y, Tucker JD, Scheerer JB, Siciliano MJ, Hwang M, Liu N, Legerski RJ, Thompson LH. Correction of chromosomal instability and sensitivity to diverse mutagens by a cloned cDNA of the XRCC3 DNA repair gene. Proc Natl Acad Sci USA. 1995; 92:6354–58. https://doi.org/10.1073/pnas.92.14.6354 [PubMed]
- 45. Kunieda T, Minamino T, Katsuno T, Tateno K, Nishi J, Miyauchi H, Orimo M, Okada S, Komuro I. Cellular senescence impairs circadian expression of clock genes in vitro and in vivo. Circ Res. 2006; 98:532–39. https://doi.org/10.1161/01.RES.0000204504.25798.a8 [PubMed]
- 46. Gaspar LS, Álvaro AR, Moita J, Cavadas C. Obstructive Sleep Apnea and Hallmarks of Aging. Trends Mol Med. 2017; 23:675–92. https://doi.org/10.1016/j.molmed.2017.06.006 [PubMed]
- 47. James S, McLanahan S, Brooks-Gunn J, Mitchell C, Schneper L, Wagner B, Notterman DA. Sleep Duration and Telomere Length in Children. J Pediatr. 2017; 187:247–52.e1. https://doi.org/10.1016/j.jpeds.2017.05.014 [PubMed]
- 48. Chen WD, Wen MS, Shie SS, Lo YL, Wo HT, Wang CC, Hsieh IC, Lee TH, Wang CY. The circadian rhythm controls telomeres and telomerase activity. Biochem Biophys Res Commun. 2014; 451:408–14. https://doi.org/10.1016/j.bbrc.2014.07.138 [PubMed]
- 49. Varela E, Muñoz-Lorente MA, Tejera AM, Ortega S, Blasco MA. Generation of mice with longer and better preserved telomeres in the absence of genetic manipulations. Nat Commun. 2016; 7:11739. https://doi.org/10.1038/ncomms11739 [PubMed]
- 50. Mogford JE, Liu WR, Reid R, Chiu CP, Said H, Chen SJ, Harley CB, Mustoe TA. Adenoviral human telomerase reverse transcriptase dramatically improves ischemic wound healing without detrimental immune response in an aged rabbit model. Hum Gene Ther. 2006; 17:651–60. https://doi.org/10.1089/hum.2006.17.651 [PubMed]
- 51. Marciniak RA, Johnson FB, Guarente L. Dyskeratosis congenita, telomeres and human ageing. Trends Genet. 2000; 16:193–95. https://doi.org/10.1016/S0168-9525(00)01984-3 [PubMed]
- 52. Horvath S. DNA methylation age of human tissues and cell types. Genome Biol. 2013; 14:R115. https://doi.org/10.1186/gb-2013-14-10-r115 [PubMed]
- 53. Horvath S. Erratum to: DNA methylation age of human tissues and cell types. Genome Biol. 2015; 16:96. https://doi.org/10.1186/s13059-015-0649-6 [PubMed]
- 54. Weng NP, Levine BL, June CH, Hodes RJ. Human naive and memory T lymphocytes differ in telomeric length and replicative potential. Proc Natl Acad Sci USA. 1995; 92:11091–94. https://doi.org/10.1073/pnas.92.24.11091 [PubMed]
- 55. Astuti Y, Wardhana A, Watkins J, Wulaningsih W, Network PR, and PILAR Research Network. Cigarette smoking and telomere length: A systematic review of 84 studies and meta-analysis. Environ Res. 2017; 158:480–89. https://doi.org/10.1016/j.envres.2017.06.038 [PubMed]
- 56. Lu AT, Xue L, Salfati EL, Chen BH, Ferrucci L, Levy D, Joehanes R, Murabito JM, Kiel DP, Tsai PC, Yet I, Bell JT, Mangino M, et al. GWAS of epigenetic aging rates in blood reveals a critical role for TERT. Nat Commun. 2018; 9:387. https://doi.org/10.1038/s41467-017-02697-5 [PubMed]
- 57. Barrett JH, Iles MM, Dunning AM, Pooley KA. Telomere length and common disease: study design and analytical challenges. Hum Genet. 2015; 134:679–89. https://doi.org/10.1007/s00439-015-1563-4 [PubMed]
- 58. Lu AT, Seeboth A, Tsai PC, Sun D, Quach A, Reiner AP, Kooperberg C, Ferrucci L, Hou L, Baccarelli A, Li Y, Harris SE, Corley J, et al. DNA methylation-based estimator of telomere length. Aging (Albany NY). 2019. [Epub ahead of print]. https://doi.org/10.18632/aging.102173 [PubMed]
- 59. Kannel WB, Feinleib M, McNamara PM, Garrison RJ, Castelli WP. An investigation of coronary heart disease in families. The Framingham offspring study. Am J Epidemiol. 1979; 110:281–90. https://doi.org/10.1093/oxfordjournals.aje.a112813 [PubMed]
- 60. Taylor HA
Jr , Wilson JG, Jones DW, Sarpong DF, Srinivasan A, Garrison RJ, Nelson C, Wyatt SB. Toward resolution of cardiovascular health disparities in African Americans: design and methods of the Jackson Heart Study. Ethn Dis. 2005; 15:S6-4-17. [PubMed] - 61. Anderson G, Cummings S, Freedman LS, Furberg C, Henderson M, Johnson SR, Kuller L, Manson J, Oberman A, Prentice RL, Rossouw JE. Design of the Women's Health Initiative clinical trial and observational study. The Women's Health Initiative Study Group. Control Clin Trials. 1998; 19:61–109. https://doi.org/10.1016/S0197-2456(97)00078-0 [PubMed]
- 62. Berenson GS. Bogalusa Heart Study: a long-term community study of a rural biracial (black/white) population. Am J Med Sci. 2001; 322:267–74. https://doi.org/10.1097/00000441-200111000-00007 [PubMed]
- 63. Deary IJ, Gow AJ, Pattie A, Starr JM. Cohort profile: the Lothian Birth Cohorts of 1921 and 1936. Int J Epidemiol. 2012; 41:1576–84. https://doi.org/10.1093/ije/dyr197 [PubMed]
- 64. Taylor AM, Pattie A, Deary IJ. Cohort Profile Update: The Lothian Birth Cohorts of 1921 and 1936. Int J Epidemiol. 2018; 47:1042–1042-r. https://doi.org/10.1093/ije/dyy022 [PubMed]
- 65. Christensen K, Holm NV, McGue M, Corder L, Vaupel JW. A Danish population-based twin study on general health in the elderly. J Aging Health. 1999; 11:49–64. https://doi.org/10.1177/089826439901100103 [PubMed]
- 66. McGue M, Christensen K. Social activity and healthy aging: a study of aging Danish twins. Twin Res Hum Genet. 2007; 10:255–65. https://doi.org/10.1375/twin.10.2.255 [PubMed]
- 67. Kimura M, Stone RC, Hunt SC, Skurnick J, Lu X, Cao X, Harley CB, Aviv A. Measurement of telomere length by the Southern blot analysis of terminal restriction fragment lengths. Nat Protoc. 2010; 5:1596–607. https://doi.org/10.1038/nprot.2010.124 [PubMed]
- 68. Houseman EA, Accomando WP, Koestler DC, Christensen BC, Marsit CJ, Nelson HH, Wiencke JK, Kelsey KT. DNA methylation arrays as surrogate measures of cell mixture distribution. BMC Bioinformatics. 2012; 13:86. https://doi.org/10.1186/1471-2105-13-86 [PubMed]
- 69. Langfelder P, Horvath S. WGCNA: an R package for weighted correlation network analysis. BMC Bioinformatics. 2008; 9:559. https://doi.org/10.1186/1471-2105-9-559 [PubMed]
- 70. Song L, Langfelder P, Horvath S. Comparison of co-expression measures: mutual information, correlation, and model based indices. BMC Bioinformatics. 2012; 13:328. https://doi.org/10.1186/1471-2105-13-328 [PubMed]
- 71. McLean CY, Bristor D, Hiller M, Clarke SL, Schaar BT, Lowe CB, Wenger AM, Bejerano G. GREAT improves functional interpretation of cis-regulatory regions. Nat Biotechnol. 2010; 28:495–501. https://doi.org/10.1038/nbt.1630 [PubMed]