Submit an Article
Navigate
Home
Editorial Board
Editorial Policies
Current Volume
Archive
Scientific Integrity
Publication Ethics Statements
Interviews with Outstanding Authors
Newsroom
Sponsored Conferences
Podcast
Contact
Special Collections
Submit an Article
Online ISSN: 1945-4589
Research Paper
|
Volume 11, Issue 16
|
pp. 5876–5894
Epigenome-wide association study of leukocyte telomere length
Back to article
Figure 2
(2 of 6)
−
100%
+
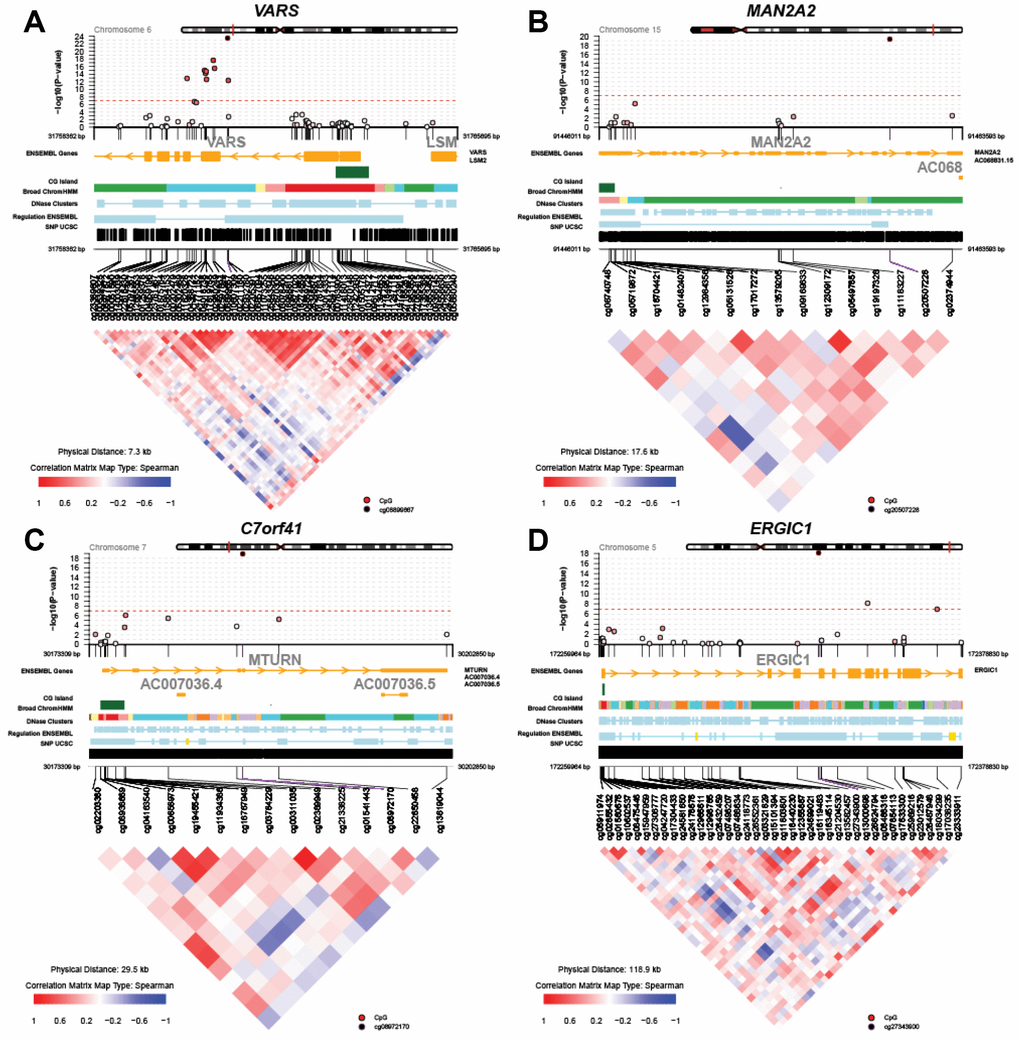
Figure 2.
Regional Manhattan plots and inter-CpG correlations for the top four genes identified in the global meta-analysis.
(
A
)
VARS
; (
B
)
MAN2A2
; (
C
)
C7orf41 (MTURN)
; (
D
)
ERGIC1
.