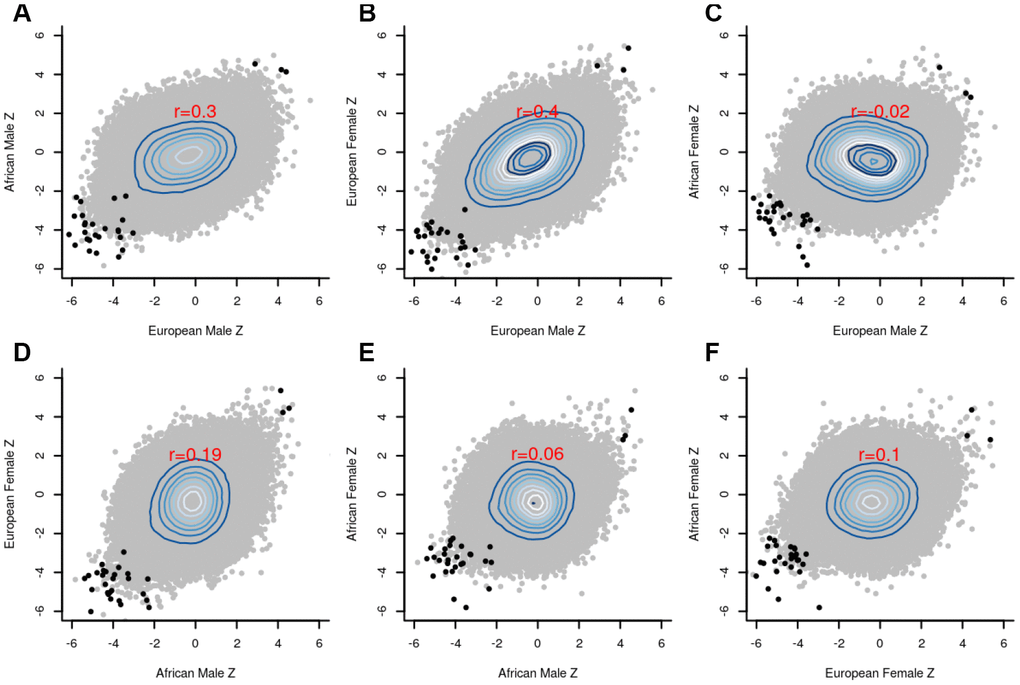
Figure 4.Scatter plots between the group-specific meta-Z scores. (A) European male vs African male; (B) European male vs European female; (C) European male vs African female; (D) African male vs European female; (E) African male vs African female; (F) African female vs European female; The black dots in the panels refer to the top 30 CpG sites detected by the global meta-analysis, whereas the grey dots indicate the remaining CpG sites. Pearson correlation coefficients (red font) reveal strong agreement (r=0.4) between males and females of European ancestry.