


Introduction
The constant rate of increase in global life expectancy and the consequent rise in the average age of the population have been accompanied by a significant surge in the incidence of the most common age-related diseases (ARDs), including neurodegenerative diseases [1]. The economic costs and social burden associated with neurodegenerative diseases have motivated efforts to identify innovative biomarkers for accurate and timely diagnosis and effective treatments. Neurodegenerative diseases include Alzheimer's disease (AD), the most common form of dementia, and non-Alzheimer’s diseases (NAD), a group of disorders that account for approximately 30-40 per cent of dementias worldwide [2]. Among NAD, Lewy Bodies (DLB), vascular (VD) and frontotemporal dementia (FTD) are the most prevalent types of dementia.
AD diagnosis is currently based on clinical evaluation, neuropsychological testing, neuro-imaging techniques, and cerebrospinal fluid (CSF) classical biomarkers [3–6]. Three core CSF biomarkers, e.g. Amyloid-ß42 (Aß42), total tau (t-tau) and phosphorylated tau (p-tau) proteins, have been included in the diagnostic criteria of AD, and could be relevant for differential diagnosis [3]. A recent Cochrane review suggested that they have a better sensitivity than specificity, performing best in ruling out AD [5].
Tau is a microtubule-associated protein involved in microtubule assembly and stabilization that can form filamentous deposits that are hallmarks of several neurodegenerative diseases collectively referred to as tauopathies (TP). TPs include AD and non-AD diseases, such as FTD and progressive supranuclear palsy (PSP) [6].
The onset of clinical symptoms and signs is a late occurrence in the natural history of dementia since the neurodegenerative processes start decades before the characteristic clinical manifestations [7,8]. To date, there is no single test that can diagnose the different types of dementia and the identification of innovative diagnostic biomarkers that can contribute to distinguish AD from NAD is needed.
New molecules, such as neurofilament light (NF-light) and microRNAs, have been proposed as promising biomarkers for neurodegenerative diseases. Neurofilaments are the major cytoskeletal constituents of neuronal cells, involved in axonal caliber maintenance and morpho-functional integrity [8–10]. NF-light levels are correlated with axonal degeneration, suggesting a potential diagnostic relevance for AD [11,12]. Increased NF-light levels have been observed in a large number of neurodegenerative diseases and conditions, including multiple sclerosis (MS) [13,14], amyotrophic lateral sclerosis (ALS) [15], AD [12], subcortical vascular disease [16], FTD [17,18], various central nervous system infections [19], and chronic experimental autoimmune encephalomyelitis [20].
Circulating microRNAs (miRNAs), which are short single-strand RNA molecules that are involved in gene expression modulation, have been linked to a number of ARDs, including neurodegenerative diseases. Four miRNAs, miR-21, miR-125b, miR-146a, and miR-222, were previously associated with AD diagnosis [21–23]. Moreover, two of them, miR-21 and miR-146a, were found to be involved in the modulation of the inflammatory process, which in turn is currently believed to underlie the neurodegeneration processes [24]. These miRNAs were defined as “inflammamiRs” [25].
The aim of this study was to compare the diagnostic performance of classical and novel CSF biomarkers across patients affected by AD and NAD, such as TP and VD, and cognitively normal subjects (CNS).
Results
The biochemical, clinical and anthropometric characteristics of the studied subjects are reported in Table 1. The proportion between genders among groups was not significantly different. TP patients have mean age similar to that of CNS, whereas AD and VD patients were significantly older than CNS.
Table 1. Clinical and anthropometric characteristics of the studied subjects.
| CNS (n. 43) | AD (n. 70) | TP (n. 23) | VD (n. 17) | ||||||||||||||||||||||||||||||||||||||||||||||||||||||||||||||||||||||||||||||||||||||||||||||||
| Age (yrs) | 66.9±12.0 | 77.0±7.7* | 68.6±8.3 | 79.4±6.2* | |||||||||||||||||||||||||||||||||||||||||||||||||||||||||||||||||||||||||||||||||||||||||||||||
| Gender Male N (%) | 21 (48.8%) | 26 (37.1%) | 12 (52.2%) | 8 (47.1%) | |||||||||||||||||||||||||||||||||||||||||||||||||||||||||||||||||||||||||||||||||||||||||||||||
| Aß42 (pg/ml) | 657.0 (143.0-1238.0) | 384.5 (113.0-877.0) * | 713.0 (194.0-1006.0) | 645.0 (394.0-1107.0) | |||||||||||||||||||||||||||||||||||||||||||||||||||||||||||||||||||||||||||||||||||||||||||||||
| T-tau (pg/ml) | 178.0 (57.0-2358.0) | 447.0 (117.0-2693.0) * | 247.0 (90.0-774.0) | 305.0 (66.0-673.0) | |||||||||||||||||||||||||||||||||||||||||||||||||||||||||||||||||||||||||||||||||||||||||||||||
| P-tau (pg/ml) | 35.0 (6.0-81.0) | 64.0 (21.0-194.0) * | 48 (2.0-112.0) | 44.0 (25.0-91.0) | |||||||||||||||||||||||||||||||||||||||||||||||||||||||||||||||||||||||||||||||||||||||||||||||
| MMSE | 25.3±3.1 | 14.9±6.3 * | 18.2±7.7 * | 20.3±7.8 * | |||||||||||||||||||||||||||||||||||||||||||||||||||||||||||||||||||||||||||||||||||||||||||||||
| IATI | 1.4 (0.3-3.1) | 0.5 (0.1-1.7) * | 1.1 (0.3-2.1) * | 1.3 (0.5-2.2) | |||||||||||||||||||||||||||||||||||||||||||||||||||||||||||||||||||||||||||||||||||||||||||||||
| NF-light (pg/ml) | 796.7 (81.3-1584.3) | 1332.7 (424.7-5730.1) ** | 2071.0 (400.5-7864.9) ** | 1603.2 (370.1-6295.7) ++ | |||||||||||||||||||||||||||||||||||||||||||||||||||||||||||||||||||||||||||||||||||||||||||||||
| MiR-21 | 324.7±215.1 | 369.7±236.9 | 304.9±139.3 | 286.1±177.5 | |||||||||||||||||||||||||||||||||||||||||||||||||||||||||||||||||||||||||||||||||||||||||||||||
| MiR-125b | 171.8±165.5 | 166.6±151.2 | 129.1±122.1 | 167.0±199.9 | |||||||||||||||||||||||||||||||||||||||||||||||||||||||||||||||||||||||||||||||||||||||||||||||
| MiR-146a | 14.8±15.1 | 14.4±11.2 | 16.5±19.5 | 16.4±18.9 | |||||||||||||||||||||||||||||||||||||||||||||||||||||||||||||||||||||||||||||||||||||||||||||||
| MiR-222 | 11.2±12.1 | 13.8±13.8 | 23. ±58.8 | 40.6±64.0++ | |||||||||||||||||||||||||||||||||||||||||||||||||||||||||||||||||||||||||||||||||||||||||||||||
| Data are reported as mean ± SD or as median (Interquartile Range) as appropriate. Aß42: beta-amyloid (1-42) peptide. T-tau: Tau protein. P-tau: threonine-181 hyperphosphorylated tau protein. MMSE: Mini Mental State Evaluation. IATI: Innotest Amyloid Tau Index. CNS: cognitively normal subjects. AD: Alzheimer’s diseases. TP: the TP group was composed of 3 patients with progressive supranuclear palsy (PSP), 19 patients with frontotemporal dementia (FTD) and 3 patients with corticobasal degeneration (CBD). VD: vascular dementia. *p<0.05 vs. CNS group; ++p<0.01 vs. CNS and AD group; ** p< 0.01 vs. CNS. | |||||||||||||||||||||||||||||||||||||||||||||||||||||||||||||||||||||||||||||||||||||||||||||||||||
With respect to classical AD CSF biomarkers, AD patients showed the characteristic profiles characterized by low levels of Aß42 and high levels of t- and p-tau, whereas the CNS group had high levels of Aß42 and low levels of t- and p- tau. NAD patients showed intermediate profiles.
A significant increasing trend from CNS to AD and NAD was observed for NF-light concentration levels. Specifically, the TP group was characterized by the highest NF-light value (Table 1 and Fig. 1A).

Figure 1. CSF NF-light concentration levels. (A) in CNS, AD, VD and TP and (B) in CNS, AD, VD and TP grouped by gender. Data are presented as median (Interquartile Range). *p<0.05; **p<0.01.
When gender-stratified analyses were performed, NF-light levels were significantly higher in males than in females in both AD and NAD (TP and VD groups) (Fig. 1B).
Among the four selected miRNAs, miR-222 CSF levels were significantly increased in VD compared to both AD and CNS (Fig. 2).
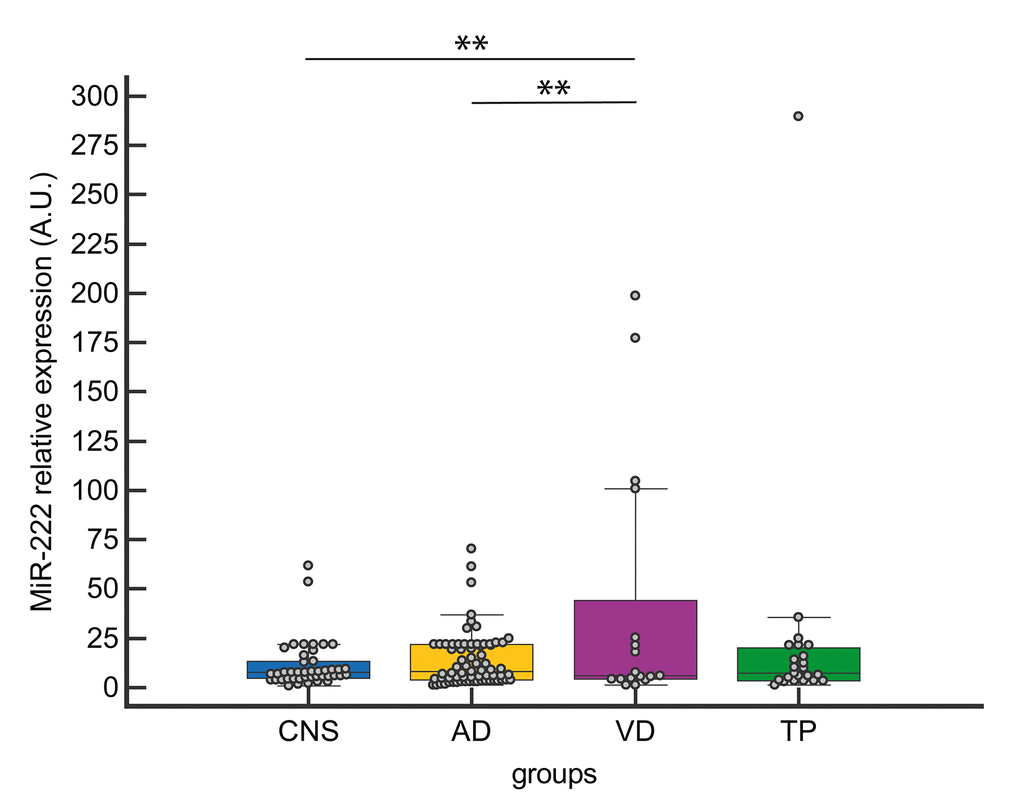
Figure 2. CSF miR-222 expression levels in CNS, AD, VD and TP. Data are presented as median [interquartile range]; **p<0.01
One-way analysis of covariance (ANCOVA) adjusted for age and gender confirmed a statistically significant difference among CNS, AD, TP and VD patients in the levels of NF-light (F =13.07 (3, 141), p <0.001) and miR-222 (F= 5.51 (3, 141), p=0.001), (Wilk’s Lambda, F= 9.20 (3, 141), p <0.001). These results were still significant after adjusting for Aß42, t-tau, and p- tau.
The diagnostic performance of each biomarker was than assessed using ROC curve analysis. NF-light concentrations performed better than miR-222 levels in discriminating VD from CNS (ROC analysis: The diagnostic performance of each biomarker was than assessed using ROC curve analysis. NF-light concentrations performed better than miR-222 levels in discriminating VD from CNS (ROC analysis: AUC=0.746) (Fig. 3A), but neither NF-light nor miR-222 were able to distinguish between AD and VD (Fig. 3B).
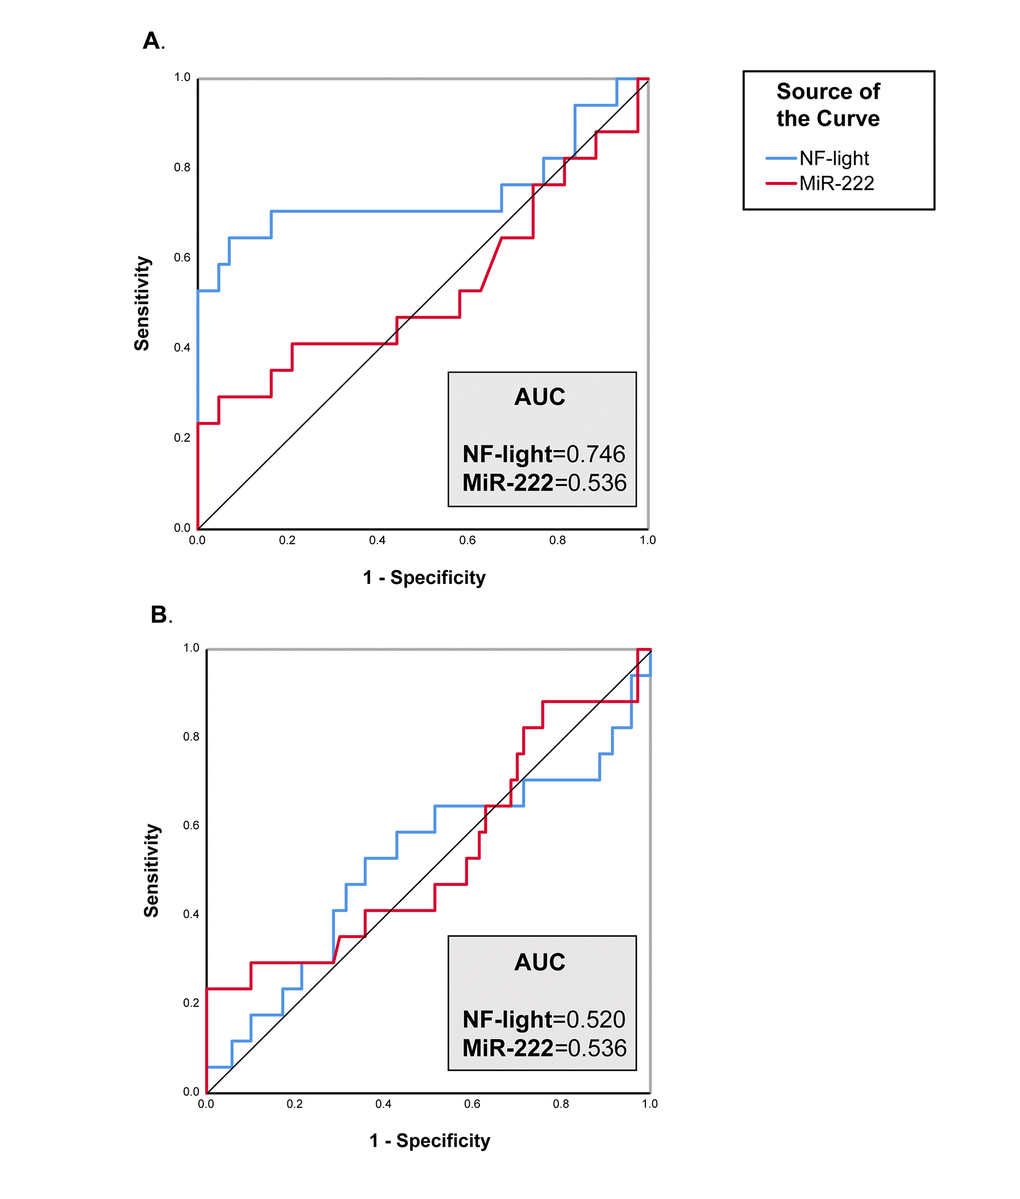
Figure 3. ROC curve analysis of NF-Light and miR-222. (A) CNS vs. VD. (B) AD vs. VD. AUC= Area Under the Curve.
On the other hand, the performance of NF-light levels in discriminating AD from CNS was similar to that of classical AD biomarkers (ROC analysis: AUC=0.830, AD vs. CNS) (Fig. 4A), whereas a better performance than Aß42, t- and p-tau and IATI (a parameter combining Aß42 and t-tau) was observed in differentiating TP patients from CNS (ROC analysis: AUC=0.873, TP vs. CNS) (Fig. 4B). Furthermore, IATI had the best performance in differentiating between AD and NAD (ROC analysis: AUC=0.868, AD vs. VD and AUC=0.817, AD vs. TP) (Fig. 4D-E).
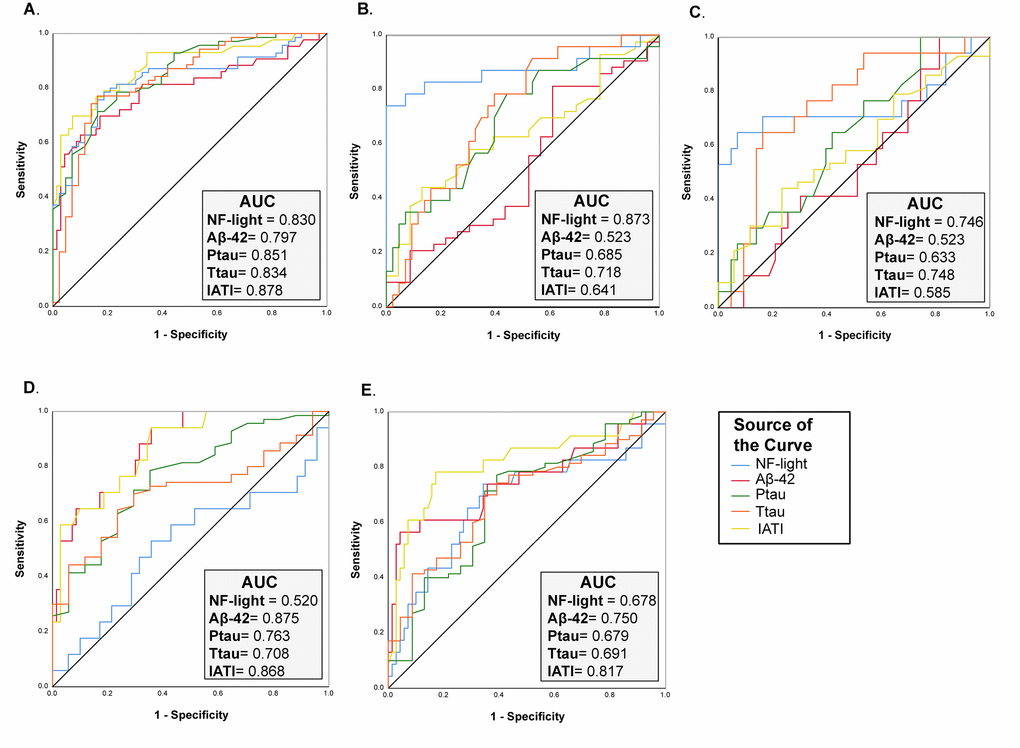
Figure 4. ROC curve analysis of NF-Light and classical AD biomarkers. (A) CNS vs. AD. (B) CNS vs. TP. (C) CNS vs. VD. (D) AD vs. VD and (E) AD vs. TP. AUC= Area Under the Curve.
Significant correlations were observed between NF-light and t-tau, p-tau and IATI (Table 2).
Table 2. Correlation between classical and innovative (NF-light and miR-222) neurodegenerative biomarkers.
| NF-light | MiR-222 | ||||||||||||||||||||||||||||||||||||||||||||||||||||||||||||||||||||||||||||||||||||||||||||||||||
| Spearman’s rho coefficient | P value | Spearman’s rho coefficient | P value | ||||||||||||||||||||||||||||||||||||||||||||||||||||||||||||||||||||||||||||||||||||||||||||||||
| Aß42 | -0.031 | 0.692 | -0.011 | 0.888 | |||||||||||||||||||||||||||||||||||||||||||||||||||||||||||||||||||||||||||||||||||||||||||||||
| T-tau | 0.360 | < 0.001 | -0.077 | 0.319 | |||||||||||||||||||||||||||||||||||||||||||||||||||||||||||||||||||||||||||||||||||||||||||||||
| P-tau | 0.262 | 0.001 | -0.016 | 0.838 | |||||||||||||||||||||||||||||||||||||||||||||||||||||||||||||||||||||||||||||||||||||||||||||||
| IATI | -0.210 | 0.006 | 0.040 | 0.603 | |||||||||||||||||||||||||||||||||||||||||||||||||||||||||||||||||||||||||||||||||||||||||||||||
| MMSE | -0.210 | 0.022 | 0.026 | 0.786 | |||||||||||||||||||||||||||||||||||||||||||||||||||||||||||||||||||||||||||||||||||||||||||||||
| Aß42: beta-amyloid (1-42) peptide. T-tau: Tau protein. P-tau: threonine-181 hyperphosphorylated tau protein. MMSE: Mini Mental State Evaluation. IATI: Innotest Amyloid Tau Index. | |||||||||||||||||||||||||||||||||||||||||||||||||||||||||||||||||||||||||||||||||||||||||||||||||||
Finally, a significant inverse correlation was observed between NF-light levels and the Mini-Mental State Examination (MMSE) score (Table 2).
Discussion
The confidence in AD diagnosis is highly enhanced by the quantification of classical biomarkers in CSF. However, the diagnostic relevance of these biomarkers in non-AD dementia and in differentiating between AD and non-AD is still under investigation. In addition, the identification of additional CSF biomarkers of dementia may help to improve the CSF biomarker-based classification. To this end, our results showed that CSF NF-light levels increased in all analyzed groups of patients with dementia compared to CNS. The TP group was characterized by the highest NF-light values, which, in turn, showed a better diagnostic performance than classical AD biomarkers in distinguishing TP from CNS. A notable finding of our study is that NF-light levels were strongly correlated with t-tau and p-tau, which confirms previous data [26]. This relationship is not surprising since t- and p-tau as well as NF-light are proteins belonging to the neuronal cytoskeleton and their increased levels in CSF are indicative of neuronal damages. The tau protein is mainly associated with the microtubules of the cortical axons; therefore, the value of t-tau in CSF is proportional to axonal damage. On the other hand, the axonal damage, in general, is an event common to all neurodegenerative diseases. Indeed, increases of t-tau are also detectable in VD, Lewy body dementia, FTD dementias and Creutzfeldt-Jacob disease [27,28]. Given that the tau protein is expressed mainly in the axons of cortical neurons, an increase in CSF reflects a neuronal damage of cortical neurons [29]. Nevertheless, the increase in CSF t-tau levels remains a finding rather non-specific, since other pathologies, besides AD, are responsible for most of the cortical neuronal damage, i.e. Creutzfeld's-Jacob disease [30]. NF-light as representative of axonal injury, axonal pathology, and/or axonal dysfunction has been observed in various models of mouse [26–31]. Moreover, results from this study showed a significant inverse correlation between NF-light and the MMSE score, the best-known screening tool for providing an overall measure of cognitive impairment in clinical and research field [32]. However, as seen previously [33], CSF NF-light levels demonstrated worse diagnostic performance in discriminating between AD and non-AD dementia, suggesting that NF-light is a biomarker of neurodegeneration not specific for AD dementia
On the other hand, IATI, a parameter combining Aß42 and t-tau that, had the best performance in discriminating between AD and non-AD dementia. This result is in contrast with findings from a recent Cochrane systematic review on the clinical impact of CSF t-tau and p-tau for the diagnosis of Alzheimer’s and other dementias in people with mild cognitive impairment (MCI), which reported that the classical AD biomarkers showed better potential in ruling out AD rather than in ruling in [5]. Despite the large number of patients analysed in the above-mentioned systematic review, the diagnostic clinical utility of these biomarkers was not defined. Indeed, an increase in their levels is not a guarantee of a progression of MCI into dementia, suggesting that further efforts should be devoted to search for more specific and informative biomarkers.
Regarding miRNAs levels as diagnostic biomarkers of dementia, our study showed a significant increase of CSF miR-222 levels in VD patients, suggesting a potential role in supporting the diagnosis of vascular dementia. MiR-222 was previously defined as an anti-angiogenic miR, upregulated in vascular walls with neointimal lesion formation [34–36]. Notably, circulating miR-222 levels were recently proposed as promising and independent biomarkers for the risk of acute ischemic stroke [37]. However, miR-222 performed worse than NF-light in distinguishing VD from CNS. The diagnostic relevance previously hypothesized for miR-21, miR-146a, and miR-125b CSF expression levels was not confirmed in our study [21–23]. Methodological bias, lack of standardization procedures, or different inclusion- exclusion criteria for enrolled patients could explain these non-concordant results.
The main limitation of our study is the small number of recruited patients. This is due to the fact that an invasive procedure is needed to collect CSF samples. Even if CSF biomarkers levels reflect the neuropathological alterations better than peripheral blood, applying routinely the invasive procedure needed for CSF collection in elderly patients can be difficult [38]. Therefore, the main effort in the future will be to measure NF-light in serum or plasma and compare the diagnostic performance of this innovative biomarker in CSF and in peripheral blood samples.
Overall, our results suggest that, although the non-specificity of NF-light CSF levels for the different types of dementia, CSF NF-light could be useful in supporting the diagnosis of non-AD dementia in combination with imaging and clinical data.
Materials and Methods
Participants
One hundred fifty-three patients (67 males and 86 females) were consecutively admitted to the Neurology Unit of the Geriatric Hospital, IRCCS INRCA, of Ancona. The period of recruitment was from July 20, 2010 to July 17, 2017. Participants with CSF sample available were included in the study. The Institutional Review Board of INRCA approved the study protocol and all study participants, or their next of kin, provided written informed consent in the case of relevant cognitive impairment. All recruited subjects were between 38 and 90 years of age.
Based on the cognitive assessments and clinical diagnosis, the patients were grouped into the following diagnostic categories: 70 AD, 23 TP, 17 VD, and 43 defined as CNS. The TP group was composed of: 3 patients with PSP, 19 FTD, and 3 patients with corticobasal degeneration (CBD). Tauopathies and vascular dementia are classified as NAD.
All the participants underwent physical, neurological and neuropsychological assessments, including laboratory tests, brain imaging and the MMSE evaluation. MMSE values were recoded as: 24-30 = no cognitive impairment, 19-23= mild cognitive impairment, 10-18 = moderate cognitive impairment and < 9 = severe cognitive impairment.
The diagnosis of dementia was made according to consensus criteria (AD [3,39,40]; PSP [41]; FTD [42,43]; VD [44,45]; CBD [46]:).
CNS were enrolled by Neurology Unit of the Geriatric Hospital, IRCCS INRCA, of Ancona. They did not meet criteria for mild cognitive impairment [47] and did not have any signs of inflammatory or neurodegenerative disorders, or family history of neurodegenerative disease.
For the purpose of this study, patients with unidentified neurodegenerative disease or patients with different various diagnoses (e.g. psychiatric disorders, traumatic brain injury, alcoholism, metabolic encephalopathy) defined according to international criteria, were excluded.
Cerebrospinal fluid collection and analysis
CSF was obtained by lumbar puncture in the L3/L4 or L4/L5 intervertebral space. CSF samples were collected in polypropylene vials and centrifuged at 2000 x g for 10 min to pellet residual cells and other insoluble material, then the supernatant was aliquoted and stored at -80 °C until use for biomarker determination. The CSF levels of Aß42, t-tau, and p-tau were determined using commercially available ELISA kits (Fujirebio Inc., Japan) according to the manufacturer’s instructions. Assay performance was monitored using internal and external quality control samples. All analyses were performed by the same investigators who were blinded to patients’ demographic, clinical, and cognitive data. The cutoff values of the CSF biomarkers considered as biochemical evidence of AD were determined in samples ran in the same laboratory as the CSF samples [48] and were Aß42 < 500 pg/ml, t-tau > 350 pg/ml, and p-tau > 50 pg/ml. The IATI parameter was calculated as follows: Aβ42 / (240 + 1.18 × t-tau).
The CSF NF-Light concentrations were measured using a commercial ELISA kit (IBL, Hamburg, Germany) as described by the manufacturer. All samples were ran in duplicate and the mean value was considered for the analysis. Samples with an intra-assay coefficient of variation below 10.0% were included in this study. The lower limit of quantification is 32 pg/ml and the upper limit is 10000 pg/ml.
RNA isolation
Total RNA was isolated from CSF sample (100μl) using Total RNA Purification Kit (product #17200) by Norgen Biotek Corporation (Thorold, ON, Canada), according to the manufacturer’s specific recommendations. RNA was stored at − 80°C until use.
Quantitative RT-PCR of mature miRNAs
MiRNA relative expression was measured as reported in [49].
Statistical analysis
Baseline characteristics were determined using descriptive statistics. Mean ± standard deviation (SD) or median (interquartile range (IQR)) were reported for continuous variables. To assess the normal distribution of the data, a Kolmogorov-Smirnov test was performed and non-normally distributed data were log10 transformed. Absolute frequencies or percentages were described for categorical variables. ANCOVA followed by Bonferroni’s post-hoc test for multiple comparisons was used to compare the mean differences in clinical variables after adjustment for age and sex. Associations between the variables were tested using Spearman correlation test.
To assess the diagnostic performance of each biomarker in distinguishing CNS from AD and NAD, a receiver operating characteristic (ROC) curve analysis was performed, and areas under the curve (AUC) were compared.
All tests were two-sided, and significance was set at p< 0.05. Statistical analyses were performed using IBM SPSS (IBM Corp, Armonk, NY, USA) version 25.0.
Conflicts of Interest
All authors disclose no conflicts of interest.
Funding
This study was partially supported by Ricerca Corrente funding from Italian Ministry of Health to IRCCS INRCA and by grants from UNIVPM to FO.
References
- 1. Fulop T, Witkowski JM, Olivieri F, Larbi A. The integration of inflammaging in age-related diseases. Semin Immunol. 2018; 40:17–35. https://doi.org/10.1016/j.smim.2018.09.003 [PubMed]
- 2. Dening T, Sandilyan MB. Dementia: definitions and types. Nurs Stand. 2015; 29:37–42. https://doi.org/10.7748/ns.29.37.37.e9405 [PubMed]
- 3. Dubois B, Feldman HH, Jacova C, Dekosky ST, Barberger-Gateau P, Cummings J, Delacourte A, Galasko D, Gauthier S, Jicha G, Meguro K, O’brien J, Pasquier F, et al. Research criteria for the diagnosis of Alzheimer’s disease: revising the NINCDS-ADRDA criteria. Lancet Neurol. 2007; 6:734–46. https://doi.org/10.1016/S1474-4422(07)70178-3 [PubMed]
- 4. Mattsson N, Blennow K, Zetterberg H. CSF biomarkers: pinpointing Alzheimer pathogenesis. Ann N Y Acad Sci. 2009; 1180:28–35. https://doi.org/10.1111/j.1749-6632.2009.04944.x [PubMed]
- 5. Ritchie C, Smailagic N, Noel-Storr AH, Ukoumunne O, Ladds EC, Martin S. CSF tau and the CSF tau/ABeta ratio for the diagnosis of Alzheimer’s disease dementia and other dementias in people with mild cognitive impairment (MCI). Cochrane Database Syst Rev. 2017; 3:CD010803. [PubMed]
- 6. Yamada K. Extracellular Tau and its potential role in the propagation of Tau pathology. Front Neurosci. 2017; 11:667. https://doi.org/10.3389/fnins.2017.00667 [PubMed]
- 7. Holtzman DM, Morris JC, Goate AM. Alzheimer’s disease: the challenge of the second century. Sci Transl Med. 2011; 3:77sr1. https://doi.org/10.1126/scitranslmed.3002369 [PubMed]
- 8. Bateman RJ, Xiong C, Benzinger TL, Fagan AM, Goate A, Fox NC, Marcus DS, Cairns NJ, Xie X, Blazey TM, Holtzman DM, Santacruz A, Buckles V, et al, and Dominantly Inherited Alzheimer Network. Clinical and biomarker changes in dominantly inherited Alzheimer’s disease. N Engl J Med. 2012; 367:795–804. https://doi.org/10.1056/NEJMoa1202753 [PubMed]
- 9. Lee MK, Cleveland DW. Neurofilament function and dysfunction: involvement in axonal growth and neuronal disease. Curr Opin Cell Biol. 1994; 6:34–40. https://doi.org/10.1016/0955-0674(94)90113-9 [PubMed]
- 10. Yuan A, Rao MV, Veeranna, Nixon RA. Neurofilaments at a glance. J Cell Sci. 2012; 125:3257–63. https://doi.org/10.1242/jcs.104729 [PubMed]
- 11. Olsson B, Lautner R, Andreasson U, Öhrfelt A, Portelius E, Bjerke M, Hölttä M, Rosén C, Olsson C, Strobel G, Wu E, Dakin K, Petzold M, et al. CSF and blood biomarkers for the diagnosis of Alzheimer’s disease: a systematic review and meta-analysis. Lancet Neurol. 2016; 15:673–84. https://doi.org/10.1016/S1474-4422(16)00070-3 [PubMed]
- 12. Zetterberg H, Skillbäck T, Mattsson N, Trojanowski JQ, Portelius E, Shaw LM, Weiner MW, Blennow K, and Alzheimer’s Disease Neuroimaging Initiative. Association of cerebrospinal fluid neurofilament light concentration with Alzheimer Disease progression. JAMA Neurol. 2016; 73:60–67. https://doi.org/10.1001/jamaneurol.2015.3037 [PubMed]
- 13. Teunissen CE, Khalil M. Neurofilaments as biomarkers in multiple sclerosis. Mult Scler. 2012; 18:552–56. https://doi.org/10.1177/1352458512443092 [PubMed]
- 14. Khalil M, Salzer J. CSF neurofilament light: A universal risk biomarker in multiple sclerosis? Neurology. 2016; 87:1068–69. https://doi.org/10.1212/WNL.0000000000003107 [PubMed]
- 15. Gaiani A, Martinelli I, Bello L, Querin G, Puthenparampil M, Ruggero S, Toffanin E, Cagnin A, Briani C, Pegoraro E, Sorarù G. Diagnostic and prognostic biomarkers in Amyotrophic Lateral Sclerosis: neurofilament light chain levels in definite subtypes of disease. JAMA Neurol. 2017; 74:525–32. https://doi.org/10.1001/jamaneurol.2016.5398 [PubMed]
- 16. Sjögren M, Blomberg M, Jonsson M, Wahlund LO, Edman A, Lind K, Rosengren L, Blennow K, Wallin A. Neurofilament protein in cerebrospinal fluid: a marker of white matter changes. J Neurosci Res. 2001; 66:510–16. https://doi.org/10.1002/jnr.1242 [PubMed]
- 17. Sjögren M, Rosengren L, Minthon L, Davidsson P, Blennow K, Wallin A. Cytoskeleton proteins in CSF distinguish frontotemporal dementia from AD. Neurology. 2000; 54:1960–64. https://doi.org/10.1212/WNL.54.10.1960 [PubMed]
- 18. Skillbäck T, Farahmand B, Bartlett JW, Rosén C, Mattsson N, Nägga K, Kilander L, Religa D, Wimo A, Winblad B, Rosengren L, Schott JM, Blennow K, et al. CSF neurofilament light differs in neurodegenerative diseases and predicts severity and survival. Neurology. 2014; 83:1945–53. https://doi.org/10.1212/WNL.0000000000001015 [PubMed]
- 19. Mattsson N, Bremell D, Anckarsäter R, Blennow K, Anckarsäter H, Zetterberg H, Hagberg L. Neuroinflammation in Lyme neuroborreliosis affects amyloid metabolism. BMC Neurol. 2010; 10:51. https://doi.org/10.1186/1471-2377-10-51 [PubMed]
- 20. Norgren N, Edelstam A, Stigbrand T. Cerebrospinal fluid levels of neurofilament light in chronic experimental autoimmune encephalomyelitis. Brain Res Bull. 2005; 67:264–68. https://doi.org/10.1016/j.brainresbull.2005.06.031 [PubMed]
- 21. Kiko T, Nakagawa K, Tsuduki T, Furukawa K, Arai H, Miyazawa T. MicroRNAs in plasma and cerebrospinal fluid as potential markers for Alzheimer’s disease. J Alzheimers Dis. 2014; 39:253–59. https://doi.org/10.3233/JAD-130932 [PubMed]
- 22. Jin Y, Tu Q, Liu M. MicroRNA‑125b regulates Alzheimer’s disease through SphK1 regulation. Mol Med Rep. 2018; 18:2373–80. https://doi.org/10.3892/mmr.2018.9156 [PubMed]
- 23. Dangla-Valls A, Molinuevo JL, Altirriba J, Sánchez-Valle R, Alcolea D, Fortea J, Rami L, Balasa M, Muñoz-García C, Ezquerra M, Fernández-Santiago R, Lleó A, Lladó A, Antonell A. CSF microRNA profiling in Alzheimer’s Disease: a screening and validation study. Mol Neurobiol. 2017; 54:6647–54. https://doi.org/10.1007/s12035-016-0106-x [PubMed]
- 24. Fiebich BL, Batista CR, Saliba SW, Yousif NM, de Oliveira AC. Role of Microglia TLRs in Neurodegeneration. Front Cell Neurosci. 2018; 12:329. https://doi.org/10.3389/fncel.2018.00329 [PubMed]
- 25. Olivieri F, Rippo MR, Procopio AD, Fazioli F. Circulating inflamma-miRs in aging and age-related diseases. Front Genet. 2013; 4:121. https://doi.org/10.3389/fgene.2013.00121 [PubMed]
- 26. Bacioglu M, Maia LF, Preische O, Schelle J, Apel A, Kaeser SA, Schweighauser M, Eninger T, Lambert M, Pilotto A, Shimshek DR, Neumann U, Kahle PJ, et al. Neurofilament light chain in blood and CSF as marker of disease progression in mouse models and in neurodegenerative diseases. Neuron. 2016; 91:56–66. https://doi.org/10.1016/j.neuron.2016.05.018 [PubMed]
- 27. Frankfort SV, Tulner LR, van Campen JP, Verbeek MM, Jansen RW, Beijnen JH. Amyloid beta protein and tau in cerebrospinal fluid and plasma as biomarkers for dementia: a review of recent literature. Curr Clin Pharmacol. 2008; 3:123–31. https://doi.org/10.2174/157488408784293723 [PubMed]
- 28. Buerger K, Otto M, Teipel SJ, Zinkowski R, Blennow K, DeBernardis J, Kerkman D, Schröder J, Schönknecht P, Cepek L, McCulloch C, Möller HJ, Wiltfang J, et al. Dissociation between CSF total tau and tau protein phosphorylated at threonine 231 in Creutzfeldt-Jakob disease. Neurobiol Aging. 2006; 27:10–15. https://doi.org/10.1016/j.neurobiolaging.2004.12.003 [PubMed]
- 29. Blennow K, Hampel H. CSF markers for incipient Alzheimer’s disease. Lancet Neurol. 2003; 2:605–13. https://doi.org/10.1016/S1474-4422(03)00530-1 [PubMed]
- 30. Otto M, Wiltfang J, Tumani H, Zerr I, Lantsch M, Kornhuber J, Weber T, Kretzschmar HA, Poser S. Elevated levels of tau-protein in cerebrospinal fluid of patients with Creutzfeldt-Jakob disease. Neurosci Lett. 1997; 225:210–12. https://doi.org/10.1016/S0304-3940(97)00215-2 [PubMed]
- 31. Petzold A. Neurofilament phosphoforms: surrogate markers for axonal injury, degeneration and loss. J Neurol Sci. 2005; 233:183–98. https://doi.org/10.1016/j.jns.2005.03.015 [PubMed]
- 32. Arevalo-Rodriguez I, Smailagic N, Roqué I Figuls M, Ciapponi A, Sanchez-Perez E, Giannakou A, Pedraza OL, Bonfill Cosp X, Cullum S. Mini-Mental State Examination (MMSE) for the detection of Alzheimer’s disease and other dementias in people with mild cognitive impairment (MCI). Cochrane Database Syst Rev. 2015; 3:CD010783. https://doi.org/10.1002/14651858.CD010783.pub2 [PubMed]
- 33. Mattsson N, Andreasson U, Zetterberg H, Blennow K, and Alzheimer’s Disease Neuroimaging Initiative. Association of plasma neurofilament light with neurodegeneration in patients with Alzheimer Disease. JAMA Neurol. 2017; 74:557–66. https://doi.org/10.1001/jamaneurol.2016.6117 [PubMed]
- 34. Ji R, Cheng Y, Yue J, Yang J, Liu X, Chen H, Dean DB, Zhang C. MicroRNA expression signature and antisense-mediated depletion reveal an essential role of MicroRNA in vascular neointimal lesion formation. Circ Res. 2007; 100:1579–88. https://doi.org/10.1161/CIRCRESAHA.106.141986 [PubMed]
- 35. Ahmed FW, Bakhashab S, Bastaman IT, Crossland RE, Glanville M, Weaver JU. Anti-Angiogenic miR-222, miR-195, and miR-21a plasma levels in T1DM are improved by metformin therapy, thus elucidating its cardioprotective effect: the MERIT Study. Int J Mol Sci. 2018; 19:3242. https://doi.org/10.3390/ijms19103242 [PubMed]
- 36. Mensà E, Recchioni R, Marcheselli F, Giuliodori K, Consales V, Molinelli E, Prattichizzo F, Rippo MR, Campanati A, Procopio AD, Olivieri F, Offidani AM. MiR-146a-5p correlates with clinical efficacy in patients with psoriasis treated with the tumour necrosis factor-alpha inhibitor adalimumab. Br J Dermatol. 2018; 179:787–89. https://doi.org/10.1111/bjd.16659 [PubMed]
- 37. Jin F, Xing J. Circulating pro-angiogenic and anti-angiogenic microRNA expressions in patients with acute ischemic stroke and their association with disease severity. Neurol Sci. 2017; 38:2015–23. https://doi.org/10.1007/s10072-017-3071-x [PubMed]
- 38. Irwin DJ, Trojanowski JQ, Grossman M. Cerebrospinal fluid biomarkers for differentiation of frontotemporal lobar degeneration from Alzheimer’s disease. Front Aging Neurosci. 2013; 5:6. https://doi.org/10.3389/fnagi.2013.00006 [PubMed]
- 39. Jack CR
Jr , Albert MS, Knopman DS, McKhann GM, Sperling RA, Carrillo MC, Thies B, Phelps CH. Introduction to the recommendations from the National Institute on Aging-Alzheimer’s Association workgroups on diagnostic guidelines for Alzheimer’s disease. Alzheimers Dement. 2011; 7:257–62. https://doi.org/10.1016/j.jalz.2011.03.004 [PubMed] - 40. McKhann GM, Knopman DS, Chertkow H, Hyman BT, Jack CR
Jr , Kawas CH, Klunk WE, Koroshetz WJ, Manly JJ, Mayeux R, Mohs RC, Morris JC, Rossor MN, et al. The diagnosis of dementia due to Alzheimer’s disease: recommendations from the National Institute on Aging-Alzheimer’s Association workgroups on diagnostic guidelines for Alzheimer’s disease. Alzheimers Dement. 2011; 7:263–69. https://doi.org/10.1016/j.jalz.2011.03.005 [PubMed] - 41. Litvan I, Agid Y, Calne D, Campbell G, Dubois B, Duvoisin RC, Goetz CG, Golbe LI, Grafman J, Growdon JH, Hallett M, Jankovic J, Quinn NP, et al. Clinical research criteria for the diagnosis of progressive supranuclear palsy (Steele-Richardson-Olszewski syndrome): report of the NINDS-SPSP international workshop. Neurology. 1996; 47:1–9. https://doi.org/10.1212/WNL.47.1.1 [PubMed]
- 42. Neary D, Snowden JS, Gustafson L, Passant U, Stuss D, Black S, Freedman M, Kertesz A, Robert PH, Albert M, Boone K, Miller BL, Cummings J, Benson DF. Frontotemporal lobar degeneration: a consensus on clinical diagnostic criteria. Neurology. 1998; 51:1546–54. https://doi.org/10.1212/WNL.51.6.1546 [PubMed]
- 43. Rascovsky K, Hodges JR, Knopman D, Mendez MF, Kramer JH, Neuhaus J, van Swieten JC, Seelaar H, Dopper EG, Onyike CU, Hillis AE, Josephs KA, Boeve BF, et al. Sensitivity of revised diagnostic criteria for the behavioural variant of frontotemporal dementia. Brain. 2011; 134:2456–77. https://doi.org/10.1093/brain/awr179 [PubMed]
- 44. Román GC, Tatemichi TK, Erkinjuntti T, Cummings JL, Masdeu JC, Garcia JH, Amaducci L, Orgogozo JM, Brun A, Hofman A, Moody DM, O’Brien MD, Yamaguchi T, et al. Vascular dementia: diagnostic criteria for research studies. Report of the NINDS-AIREN International Workshop. Neurology. 1993; 43:250–60. https://doi.org/10.1212/WNL.43.2.250 [PubMed]
- 45. Sachdev P, Kalaria R, O’Brien J, Skoog I, Alladi S, Black SE, Blacker D, Blazer DG, Chen C, Chui H, Ganguli M, Jellinger K, Jeste DV, et al, and Internationlal Society for Vascular Behavioral and Cognitive Disorders. Diagnostic criteria for vascular cognitive disorders: a VASCOG statement. Alzheimer Dis Assoc Disord. 2014; 28:206–18. https://doi.org/10.1097/WAD.0000000000000034 [PubMed]
- 46. Armstrong MJ, Litvan I, Lang AE, Bak TH, Bhatia KP, Borroni B, Boxer AL, Dickson DW, Grossman M, Hallett M, Josephs KA, Kertesz A, Lee SE, et al. Criteria for the diagnosis of corticobasal degeneration. Neurology. 2013; 80:496–503. https://doi.org/10.1212/WNL.0b013e31827f0fd1 [PubMed]
- 47. Albert MS, DeKosky ST, Dickson D, Dubois B, Feldman HH, Fox NC, Gamst A, Holtzman DM, Jagust WJ, Petersen RC, Snyder PJ, Carrillo MC, Thies B, Phelps CH. The diagnosis of mild cognitive impairment due to Alzheimer’s disease: recommendations from the National Institute on Aging-Alzheimer’s Association workgroups on diagnostic guidelines for Alzheimer’s disease. Alzheimers Dement. 2011; 7:270–79. https://doi.org/10.1016/j.jalz.2011.03.008 [PubMed]
- 48. Tabaraud F, Leman JP, Milor AM, Roussie JM, Barrière G, Tartary M, Boutros-Toni F, Rigaud M. Alzheimer CSF biomarkers in routine clinical setting. Acta Neurol Scand. 2012; 125:416–23. https://doi.org/10.1111/j.1600-0404.2011.01592.x [PubMed]
- 49. Giuliani A, Cirilli I, Prattichizzo F, Mensà E, Fulgenzi G, Sabbatinelli J, Graciotti L, Olivieri F, Procopio AD, Tiano L, Rippo MR. The mitomiR/Bcl-2 axis affects mitochondrial function and autophagic vacuole formation in senescent endothelial cells. Aging (Albany NY). 2018; 10:2855–73. https://doi.org/10.18632/aging.101591 [PubMed]