Submit an Article
Navigate
Home
Editorial Board
Editorial Policies
Current Volume
Archive
Scientific Integrity
Publication Ethics Statements
Interviews with Outstanding Authors
Newsroom
Sponsored Conferences
Podcast
Contact
Special Collections
Submit an Article
Online ISSN: 1945-4589
Research Paper
|
Volume 11, Issue 8
|
pp. 2420–2429
Diagnostic performance of new and classic CSF biomarkers in age-related dementias
Back to article
Figure 3
(3 of 4)
−
100%
+
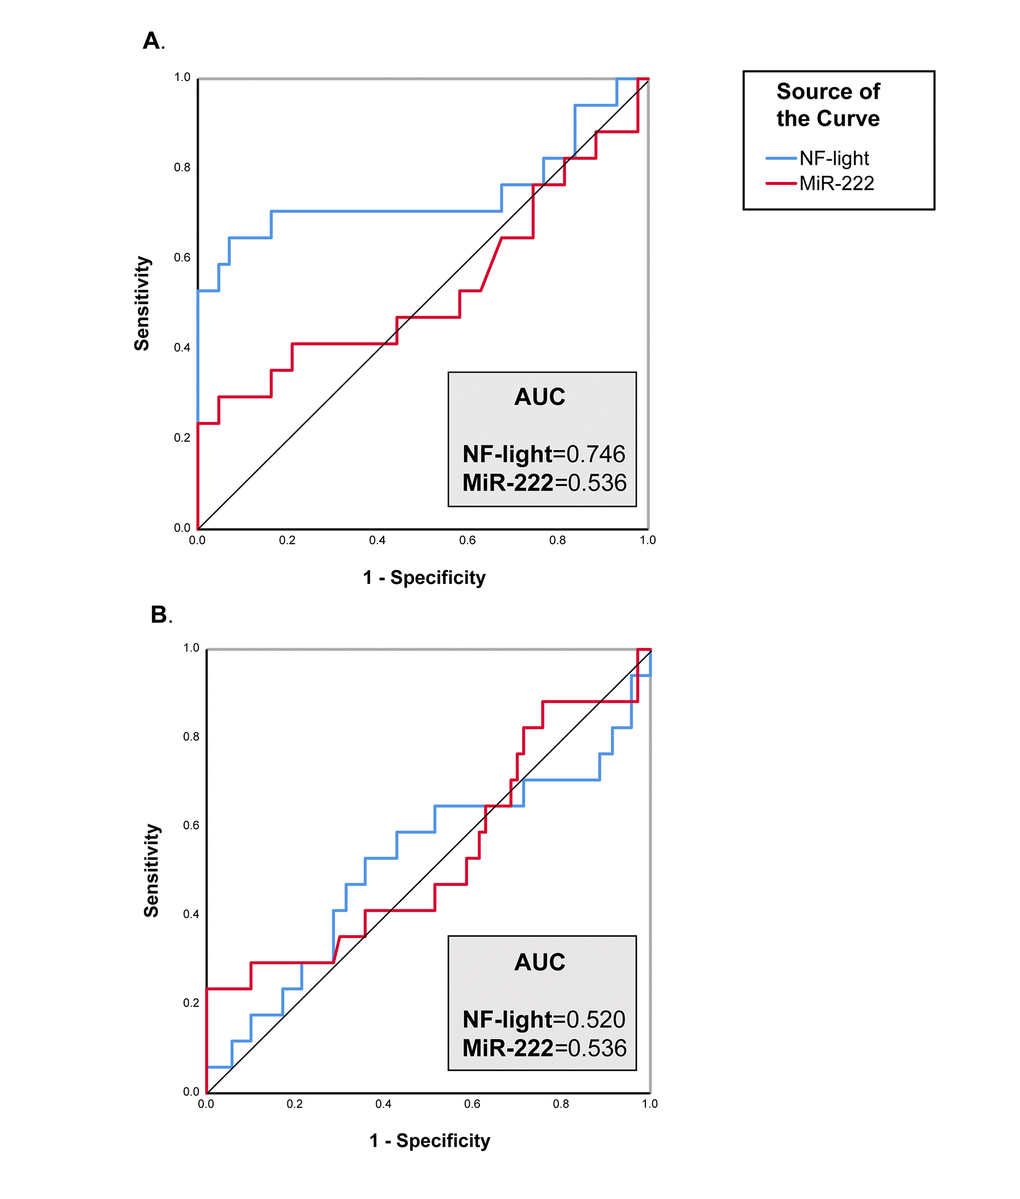
Figure 3.
ROC curve analysis of NF-Light and miR-222.
(
A
) CNS
vs.
VD. (
B
) AD
vs.
VD. AUC= Area Under the Curve.