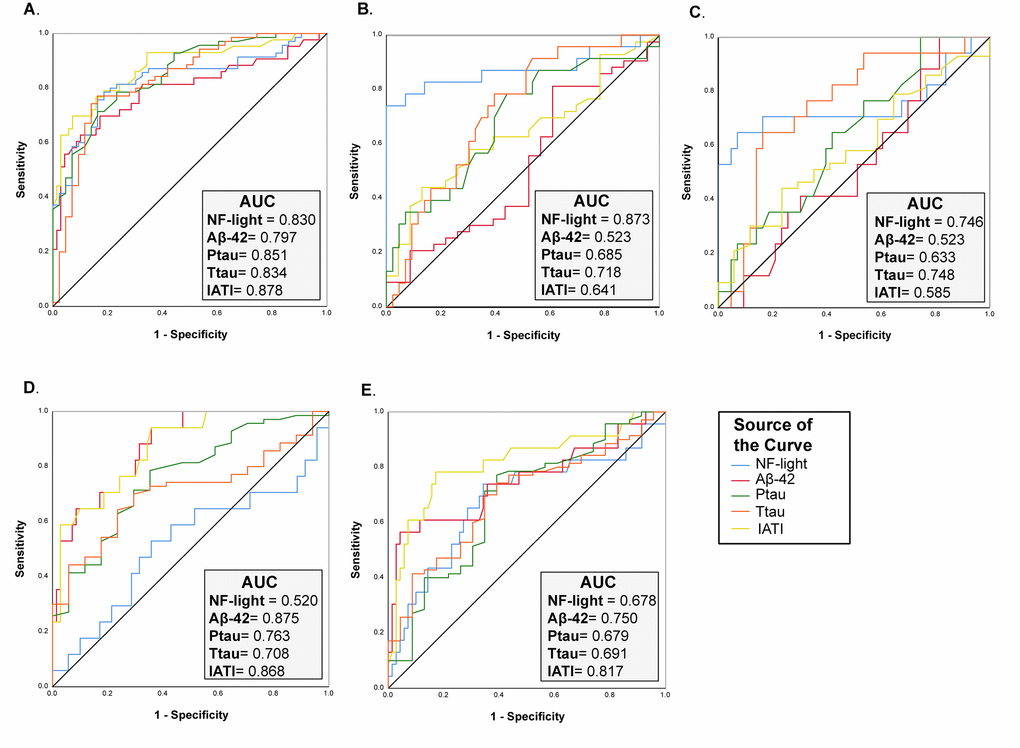
Figure 4.ROC curve analysis of NF-Light and classical AD biomarkers. (A) CNS vs. AD. (B) CNS vs. TP. (C) CNS vs. VD. (D) AD vs. VD and (E) AD vs. TP. AUC= Area Under the Curve.
Figure 4 — Diagnostic performance of new and classic CSF biomarkers in age-related dementias | Aging