


Introduction
The Target of Rapamycin (TOR) signaling pathway is a critical regulator of anabolic activities, growth and proliferation of cells [1, 2]. The role of the TOR pathway in aging is evolutionary conserved: increased TOR activity leads to accelerated aging, while reduction of TOR signaling results in increased longevity in different organisms [3, 4] including mammals. In humans, deregulated mTOR (the mammalian TOR) signaling is associated with cancer and metabolic diseases [5]. Little is known about physiological systems that are involved in regulation of TOR pathway in vivo.
The circadian clock, an internal time-keeping system, regulates physiological processes through generation of circadian rhythms in gene expression, which are translated into rhythms in metabolism and behavior [6-8]. Disruption of the circadian clock has been observed in many pathological conditions, and is considered to contribute to metabolic syndromes, cardiovascular diseases and cancer [9-12]. The circadian clock is also implicated in control of aging [11]: mice deficient for the core clock protein BMAL1, which develop severe premature aging phenotype [13], are the most striking example of this. The circadian clock controls glucose and lipid homeostasis [14], cell redox state regulation [15], cell cycle [16] and genotoxic stress response [17]. All these signaling pathways contribute to the circadian control of metabolism. Both clock-dependent regulation of reactive oxygen species homeostasis [18] and circadian control of the activity of histone deacetylases from the sirtuin family [19, 20] were proposed as potential molecular links between the circadian clock and aging [21]. Interestingly, circadian de-regulation is considered as a risk factor for a similar spectrum of diseases as disruption of the mTOR pathway.
Here we investigated the involvement of the circadian clock in regulation of the mTOR signaling pathway in mammals. Using a variety of in vitro and in vivo approaches we show that the circadian and mTOR pathways are connected through the activity of BMAL1 and this connection is important for delay of aging.
Results
BMAL1 inhibits activity of mTORC1 in cells
In order to study the mTOR signaling pathway as a potential molecular mechanism of BMAL1-dependent control of aging, we decided to compare activity of mTOR signaling in cells isolated from wild type and BMAL1-deficient mice. mTOR is a serine/threonine protein kinase found in two complexes: mTOR Complex 1 (mTORC1) and mTOR Complex 2 (mTORC2). mTORC1 activity is implicated in regulation of metabolism and aging, while the role of mTORC2 in these processes is considered to be less significant [5], therefore, we assayed the activity of mTORC1. mTORC1 phosphorylates a number of downstream targets including ribosomal protein S6 kinase 1 (S6K1) and elongation factor 4E binding proteins (4EBPs) [2, 22-25]. S6K1 is phosphorylated by mTORC1 on threonine 389 (T389); 4EBP1 is phosphorylated on threonine 37 and 46 (T37/T46). S6K1, in turn, phosphorylates its target - ribosomal protein S6 - on serines 240 and 244 (Ser240/Ser244) and serines 235 and 236 (Ser235/Ser236) [25-27]. Thus, although S6 is not a direct target of mTORC1, phosphorylation of S6 is often used as an indicator of mTORC1 activity.
Figure 1a shows results obtained in several independently isolated populations of lung fibroblasts; phosphorylation of S6 protein was significantly higher in Bmal1−/− cells, suggesting that BMAL1 is a negative regulator of mTOR signaling. Since mTORC1 activity was shown to be sensitive to growth factor and amino acid withdrawal [28-30], to investigate the role of BMAL1 in these processes we subjected wild type and Bmal1−/− cells for serum or amino acid starvation. As expected, amino acid (Figure 1b) or serum (Figure 1c) starvation resulted in suppression of phosphorylation of the mTORC1 targets in both cell types. However, the level of phosphorylation and kinetics of response to starvation displayed prominent differences. When compared to wild type, Bmal1−/− cells demonstrated increased phosphorylation for mTORC1 targets (S6K1 T389 site and 4EBP-1 T37/46 sites), but showed no difference in S6K1 phosphorylation on the MAPK-specific Thr421/Ser424 site, suggesting that the regulation of mTORC1 activity by BMAL1 is highly specific.
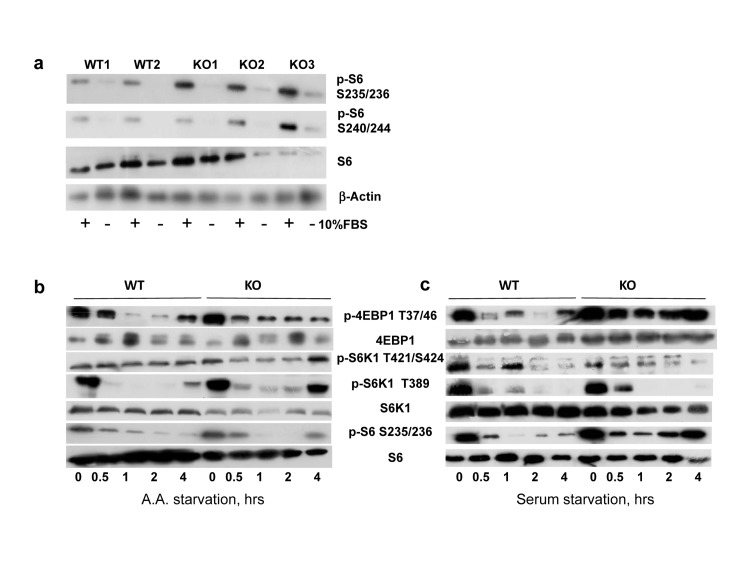
Figure 1. BMAL1 is negative regulator of TORC1 activity in cells (a) Phosphorylation and total protein level of ribosomal S6 protein in primary lung fibroblasts isolated from wild type and Bmal1−/− mice. Protein phosphorylation in cellular extracts were assayed by western blotting procedure with antibodies recognizing the indicated proteins or protein modifications WT1, WT2, KO1, KO2 and KO3 represent independently isolated populations fibroblasts isolated from wild type (WT) and Bmal1−/− (KO) mice. Cells were incubated in DMEM with 10% FBS (+) or serum deprived for 24 hrs (−). (b) and (c) Wild type (WT) and Bmal1−/− (KO) fibroblasts were subject to amino acids (b) or serum (c) withdrawal for indicated period of time. Kinetics of changes in phosphorylation of mTORC1 downstream targets are shown on the representative western blotting.
It is known that the increased mTORC1 signaling is associated with increased biosynthesis and cell growth [5]. We assayed proliferation of wild type and Bmal1−/− fibroblasts and found that Bmal1−/− cells grew faster than wild type: both the cell number (Figure 2a) and especially accumulated biomass (Figure 2b) demonstrated significant increase. In agreement with that, we detected increased protein content per cell and increased cell size for Bmal1−/− fibroblasts in comparison with wild type fibroblasts (Figure 2c and 2d). These data indicate that BMAL1 acts as a negative regulator of the mTORC1 signaling pathway.
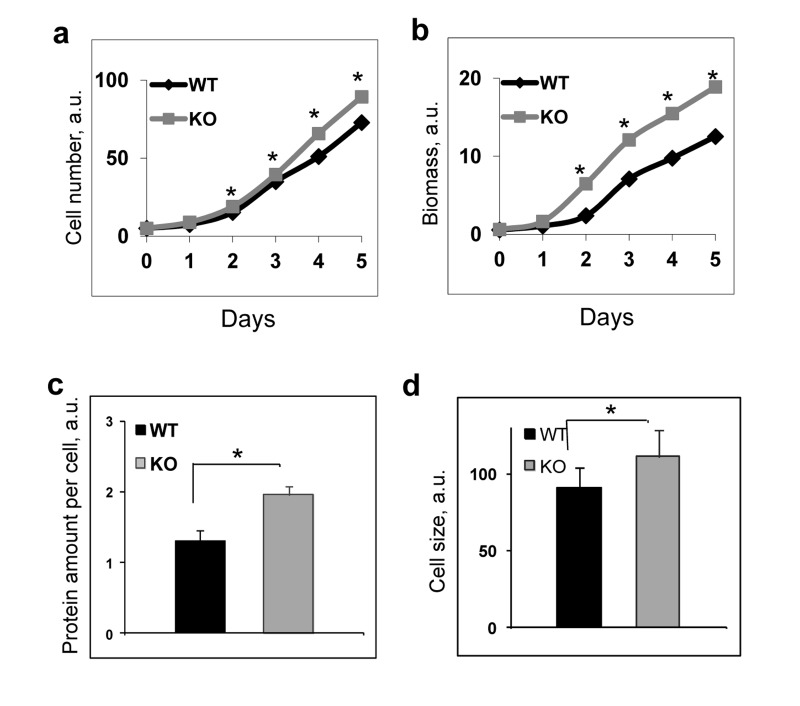
Figure 2. BMAL1 deficiency increases cell growth and proliferation To assay proliferation wild type and Bmal1−/− cells were plated at equal density on day 0, every 24 hrs cells were collected and counted (cell number), in parallel set of experiments the plates were stained with crystal violet reagent and biomass accumulation was estimated based on the amount of extracted dye. Results represent average for 4 plates for every time point for both genotypes. Experiments were repeated three times independently with similar results. (a) and (b) Proliferations of wild type (black diamonds) and Bmal1−/− (grey squares) fibroblasts in cell culture were assayed by counting cell number (a) or by measuring biomass accumulation (b). (c) Protein amount per cell for wild type (black bar) and Bmal1−/− (grey bar) fibroblasts. (d) Cell size for wild type (black bar) and Bmal1−/− (grey bars) fibroblasts were assayed by using FACSalibor cell sorter (Becton-Dikinson) and appropriate software.
Deficiency of Bmal1 leads to increased mTORC1 activity in vivo
In order to investigate if BMAL1 is involved in the regulation of mTORC1 activity in vivo, we compared temporal profiles of phosphorylation of the mTORC1 targets in tissues of wild type and Bmal1−/− mice. We assayed the activity of mTORC1 in the liver (Figure 3b), heart (Figure 3d) and several brain regions (cerebellum, Figure 3a and frontal cortex, Figure 3c) isolated from wild type and Bmal1−/− mice across the circadian cycle (on Figure 3 zt0 represents the time when light is on and zt12 represents the time when light is off). In good agreement with in vitro data, we observed a significant increase in phosphorylation of mTORC1 downstream targets at several time points in different tissues of Bmal1−/− mice: in the cerebellum significant increased activity was observed at zt6 (Figure 3a), in the frontal cortex - at zt2 and zt6 (Figure 3c), in the liver - at zt10 and zt18 (Figure 3b) and in the heart - at zt10 and zt14(Figure 3d). The observed difference in mTORC1 signaling between wild type and Bmal1−/− mice can be a consequence of different feeding habits and amount of food consumed by animals: indeed, Bmal1−/− mice do not display circadian rhythms in gene expression and behavior [31], which can affect their feeding. To exclude this factor of variability, we subjected both wild type and Bmal1−/− mice to time-restricted feeding (TRF). Mice of both genotypes received the same amount of food (about 95-100% of their daily intake) at the same time. Both groups consumed the food during first three hours after feeding. As shown in Figure 4, although phosphory-lation of S6K1, 4EBP1 and S6 was induced by feeding and gradually reduced with time in both genotypes, the level of phosphorylation in the liver of Bmal1−/− mice was higher and reduction was considerably delayed compared with wild type. Statistically significant increase in phosphorylation of 4E-BP1 at T37/46 (Figure 4a) and S6K1 at T389 (Figure 4b) was observed at several time points across the daily cycle. This difference cannot arise from variations in the amount of food or feeding behavior, as mice of both genotypes consumed the same amount of food for the same period of time. Taken together, these data suggest that BMAL1 is a negative regulator of mTORC1 signaling in vitro and in vivo. Importantly, BMAL1-dependent regulation was specific for mTORC1-mediated phosphorylation, because we did not detect increased phosphorylation for the MAPK-specific site T421/S424 of S6K1in the Bmal1−/− liver (Figure 4c).
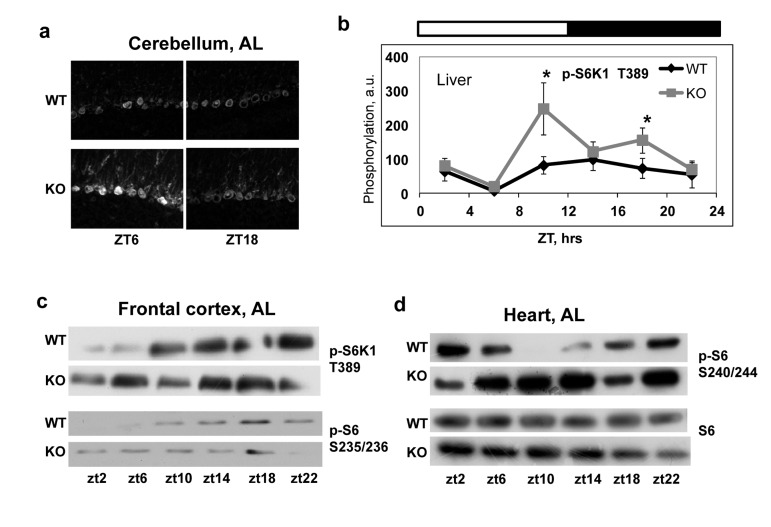
Figure 3. Increased mTORC1 signaling in tissues of Bmal1−/− mice Activity of TORC1 was compared in the different tissues of wild type and Bmal1−/− mice. Protein phosphorylation in tissue extracts were analyzed by western blotting procedure with antibodies recognizing the indicated proteins or protein modifications or by in situ staining on 10μM frozen tissue sections. (a) In situ staining of cerebellum for p-S6 S235/236. (b) Phosphorylation of S6K1(T389) in the liver through the circadian cycle (wild type (black diamonds) and Bmal1−/− (grey squares)). (c) and (d) Representative WB of mTORC1 downstream targets phosphorylation in the frontal cortex (c) and in the heart (d). Bars on the top of the figure represent light (open bars) and dark (black bars) parts of the day. Zt is an abbreviation for Zeitgeber Time, zt0 is the time when light is on, the time when light is off is zt12, thus, for example zt2 represents 2hrs after light is on. * - statistically significant difference between the genotypes
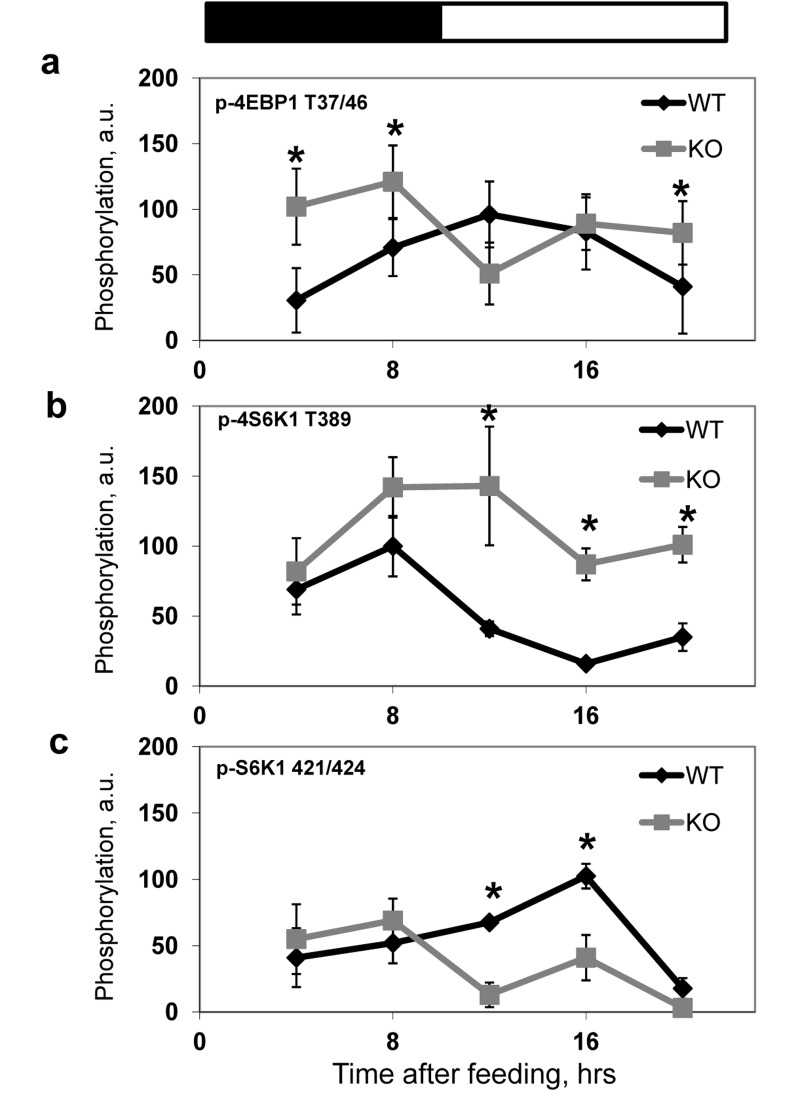
Figure 4. BMAL1 deficiency results in increased mTORC1 signaling in the liver of TRF mice Phosphorylation and expression of TORC1 downstream targets were analyzed by western blotting, image analyzing software was used to quantify the intensity of bands. For every experiment the value of maximum intensity of the band for wild type mice was set as 100, the intensity of bands for other time points and for Bmal1−/− mice was normalized accordingly. Results represent average for 4 animals of each genotype for each time point. (a-c) Quantitative profiles of TORC1 downstream targets phosphorylation in the liver of wild type (black diamonds) and Bmal1−/− (grey squares) TRF mice. (a) 4E-BP1 T37/46 phosphorylation. (b) S6K1 T389 phosphorylation; (c) S6K1 T421/424 phosphorylation. * - statistically significant difference between the genotypes. Food was provided at time point 0. Bars on the top of the figure represent light (open bars) and dark (black bars) parts of the day.
BMAL1 regulates mRNA expression of mtor and deptor
In order to get an insight into possible molecular mechanisms of the BMAL1-dependent regulation of mTOR signaling, we investigated expression of some components of the mTORC1 complex and its upstream regulators. Expression of tor and deptor mRNA was highly affected by BMAL1 deficiency. Expression of tor was significantly upregulated at several time points (Figure 5a), while expression of deptor was significantly downregulated (Figure 5b) in the liver of Bmal1−/− mice in agreement with the increased mTORC1 signaling in these animals. At the same time, we did not detect any significant effect of BMAL1 deficiency on the expression of the mTORC1 upstream regulator rheb (Figure 5c), suggesting that the regulation of tor and deptor expressions is specific. Thus, the BMAL1-dependent regulation may occur at least partially at the transcriptional level, although the existence of other mechanisms cannot be excluded at this point.
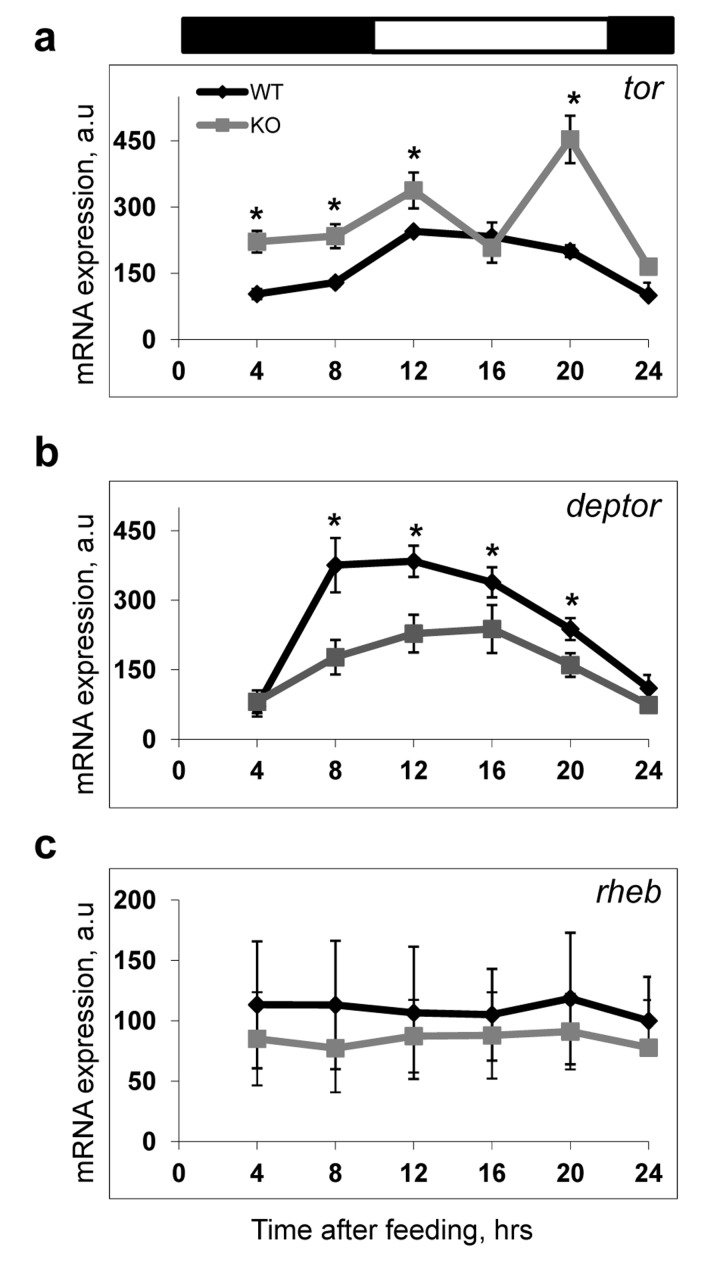
Figure 5. Expression of mtor and deptor is deregulated in the liver of Bmal1−/− mice The expressions of several components of TORC1 and upstream regulator of TORC1 in the liver of wild type and Bmal1−/− mice were analyzed across the daily cycle on mRNAs level by real-time RT PCR. All expression data were normalized to 18S ribosomal RNA expression. (a-c) Expression of mRNAs for tor(a), deptor(b), rheb(c) in the liver of TRF WT (black diamonds) or Bmal1−/− (grey squares) mice. Results represent average for 4 animals of each genotype for each time point.* - statistically significant difference between the genotypes. Bars on the top of the figure represent light (open bars) and dark (black bars) parts of the day.
Increased mTOR signaling contributes to accelerated aging of Bmal1−/− mice
Increased mTOR signaling is associated with reduced lifespan, while suppression of this pathway leads to increased longevity in many different organisms [3,4].
Previously we reported that Bmal1−/− mice developed premature aging and had dramatically reduced lifespan [13]; thus, our current data suggest that the reduced longevity in Bmal1−/− mice may result from the constitutively elevated mTORC1 signaling. To test this hypothesis we decided to check whether pharmacological suppression of the mTOR signaling by rapamycin (a potent and highly specific inhibitor of mTORC1 kinase activity [32,33]) would increase the lifespan of Bmal1−/− mice. First we assayed the effect of rapamycin on the BMAL1-dependent regulation of mTORC1 in cell culture. The treatment of cells with rapamycin reduced mTORC1 signaling in both wild type and Bmal1−/− cells (Figure 6a). Bmal1−/− fibroblasts were also more sensitive to growth inhibition by rapamycin than the wild type cells (Figure 6b), supporting the role of mTORC1 in the observed difference between wild type and BMAL1-deficient cells.
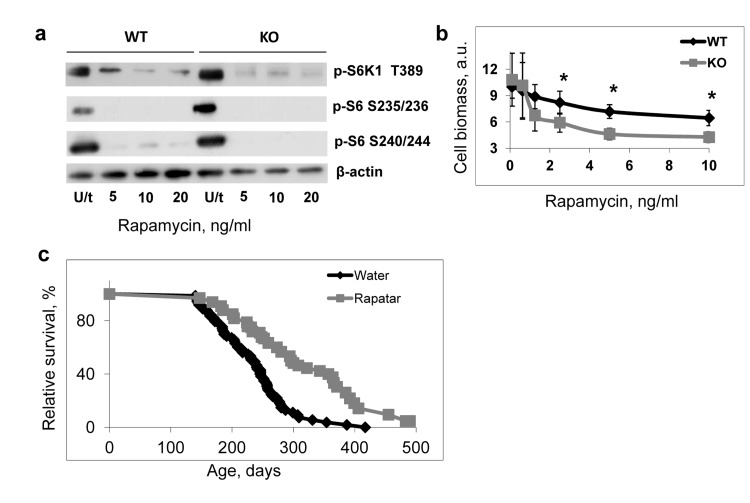
Figure 6. Deregulated mTOR signaling contributes to accelerated aging of Bmal1−/− mice (a) Treatment with rapamycin suppresses TORC1 activity in both wild type and Bmal1−/− (KO) cells. Cells were treated with indicated concentrations of rapamycin for 4 hrs, protein phosphorylation in cellular extracts were analyzed by western blotting procedure with antibodies recognizing the indicated proteins or protein modifications. U/t untreated cells. (b) Effect of rapamycin treatment on proliferation of wild type (black diamonds) and Bmal1−/− (KO) (grey squares) cells. Cells were grown for 72 hrs in regular growth media with indicated concentrations of rapamycin. Cell biomass was assayed by crystal violet incorporation. Data represent average and standard deviations for 4 replicates. The experiment was repeated 3 times with similar results. a.u. – arbitrary units. * - statistically significant difference between genotypes. (c) Kaplan-Meyer survival curves of Bmal1−/− mice treated with water (N = 73) or Rapatar in drinking water (N = 31). The difference between the survival curves is statistically significant according to logrank test.
For in vivo administration, we chose to use Rapatar, a polymeric formulation of rapamycin previously characterized by increased bioavailability and distribution [34]. Bmal1−/− male and female mice received Rapatar in drinking water (approximate cumulative daily dose 0.5mg/kg) throughout their entire lifespan starting at 16 weeks of age. Results of the experiment presented in Figure 6c show the longevity of Bmal1−/− mice. The median lifespan of untreated mice is 7.8 months and median lifespan of the Rapatar-treated mice is 11.5 months, thus the treatment increased the median lifespan by 50%. The treatment also had a significant effect on the maximum lifespan: the average lifespan of last 25% of survivors for the water control group was 302 days, and for the Rapatar-treated group was 430 days. Therefore, suppression of mTOR activity increases the longevity of Bmal1−/− mice. This observation supports the hypothesis of the mTORC1-dependent mechanisms of premature aging of these mice, although it is possible that disturbance of several signaling pathways contributes to the accelerated aging phenotype of Bmal1−/− mice. Indeed, previously we demonstrated that treatment of Bmal1−/− mice with antioxidant N-acetyl-cystein also increased their lifespan [35], although the effect was relatively moderate in comparison with the effect of Rapatar.
Discussion
Activity of mTORC1 is critical for cell growth and proliferation, and disruption of mTORC1 signaling is linked to metabolic diseases, cancer and aging. mTORC1 activity is positively regulated by nutrients and growth factors. Negative regulations of mTORC1 activity by different stresses or sharp nutrient/serum withdrawal have been demonstrated predominantly in cell culture, but little is known about regulation of mTORC1 in vivo under physiological conditions. Here we report that the component of the circadian clock transcriptional factor BMAL1 is an important regulator of mTORC1 activity. The circadian clock has been proposed as a master regulator of metabolism. Multiple reports demonstrated clock-dependent regulation of expression and activity of the rate limiting enzymes involved in carbohydrates and fat metabolism [6, 8, 14]. Recently, the circadian clock has been implicated in the control of ribosomal biogenesis and protein synthesis [36]. Our results add an additional layer of circadian control of metabolism through the regulation of mTORC1 activity: indeed, it is well established that through its targets mTORC1 acts as a master switch between cell anabolic and catabolic programs.
We propose that the circadian clock, though BMAL1-dependent mechanisms, inhibits mTOR signaling to actively suppress anabolism and prevent uncontrolled overuse of resources. Anabolic processes such as muscle growth, bone mineralization, hematopoiesis, epithelium and mucous cell renewal, synthesis of hormones and neurotransmitters, building up novel synaptic contacts etc. require significant amount of nutrients and energy; therefore, these processes must be restricted under natural conditions where resources are limited. Indeed, unrestricted growth processes could deplete the pool of available nutrients/energy, leading to disruption of homeostasis and poor fitness, or even rendering the organism unable to sustain the basal metabolic rate; at the same time, excessive growth can prematurely deplete stem cell populations, resulting in accelerated aging. In a sense, uncontrolled growth could also mimic malnutrition (shortage of required nutrients) and also result in poor fitness and premature aging. Thus, the ability of the circadian clock to suppress anabolic processes through mTOR-dependent mechanisms can be evolutionary advantageous and important for survival of mammals in wilderness. Recently, the circadian clock regulation of autophagy through C/EBP dependent mechanisms has been reported [37]; it is possible that this is not the only mechanism. Indeed, suppression of mTOR activity stimulates autophagy [5], therefore, circadian clock regulation of authophagy can also occur through mTORC1-dependent control. Interestingly, in flies the circadian clock was shown to be regulated by the components of the TOR signaling pathway [38, 39]; if a similar regulation exists in mammals, it would suggest the existence of another feedback loop connecting the circadian clock and metabolism.
It is also possible that BMAL1 dependent regulation of TORC1 function is circadian clock independent activity of BMAL1. Indeed, only Bmal1−/− mice developed accelerated aging phenotype, while other circadian mutants have near normal lifespan [11, 40]. It is necessary to investigate mTOR signaling in the tissues of other circadian mutants to answer the question on circadian clock dependence of the regulation.
In humans, more evidence is accumulated on the importance of the circadian clock in pathology of many diseases. For example, circadian disruption is a recognized risk factor for development of cancer, diabetes and obesity; noteworthy, the mTOR pathway plays an important role in all these diseases. It is also tempting to speculate that disruption of the rhythmic regulation of mTOR signaling can be responsible for the well-known jet leg-initiated dysfunction of the digestive system. The data presented here on the clock-dependent control of mTOR signaling extend our understanding of physiological regulation of the mTOR pathway and provide with potential molecular mechanisms; further studies will result in a more detailed picture of functional interaction between two important regulators of metabolism and aging – the circadian clock and TOR pathway.
Materials and Methods
Animals
Bmal1−/− mice were obtained from Dr. C. Bradfield (University of Wisconsin), and backcrossed to C57BL/6J inbred strain (The Jackson Laboratory, Bar Harbor, ME, USA) for 12 generations. Wild type and knock out mice were generated by breeding of heterozygous parents. Genotypes were determined using a PCR-based method as previously described [31]. Animals were maintained on a 12:12 light:dark cycle with lights on at 7:00 am, and fed on an 18% protein rodent diet (Harlan). Ad libitum (AL) group had unrestricted access to food. Time restricted feeding (TRF) group received about 100% of their daily intake at zt14, mice have been entrained for TRF for 2 weeks. All groups have unrestricted access to water. All tissue collection experiments have been performed for 3-4 months old wild type and Bmal1−/− mice. For longevity experiments Bmal1−/− mice received Rapatar in drinking water at 125mg/L concentration starting 16 weeks of age through the entire life span. Control group received regular water. Water bottles were replaced twice/week. Polymeric formulation of rapamycin (Rapatar) was developed by Tartis Aging, Inc. using Pluronic block co-polymers [41] as previously described [34]. All animal studies were conducted in accordance with the regulations of the Committee on Animal Care and Use at Cleveland State University and Roswell Park Cancer Institute.
Analysis of protein phosphorylation and expression
Tissue and cell extracts were normalized by measuring total protein concentration using Bio-Rad Dc protein Assay kit according manufacturer's protocol. Extracts were separated by SDS-PAGE, transferred on Immobilon-P membrane (Millipore) and incubated with phosphospecific and protein specific primary and secondary antibodies (Cell Signaling and Santa Cruz Biotechnoly). Due to technical difficulties, instead of stripping and re-probing the same membrane with different antibodies, several gels loaded with the same extracts were run in parallel; after staining with Ponceau S Red and visual examination of the transfer quality, one membrane was stained with phosphor-specific antibodies and another with antibodies specific for the total protein. Experiments with the same extracts were repeated independently at least two times. Following antibodies were used: Cell Signaling Technology: Phospho-p70 S6K (Thr389) #9205, Phospho-p70 S6K (T421/S424) #9204, p70 S6K #9202, Phospho-4E-BP1 (T37/46) #2855, 4E-BP1 #9452, Phospho-S6 (Ser235/236) 32211, Phospho-S6 (Ser240/244) #2215, Anti-Mouse IgG-HRP #7076, aAnti-rabbit IgG-HRP #7074. Santa Cruz Biotechnology: Robosomal Protein S6 sc-74459, Donkey anti-rabbit IgG-HRP sc-2313. Abcam: Anti-S6K1 (phosphor T389) ab2571.
Analysis of mRNA expression
Total RNA was isolated with TriZol reagent (Invitrogen) according with the manufacturer's protocol. RNA quantization was performed using real-time RT-PCR with Syber Green mix (BioRad), relative mRNA abundance was calculated using the comparative delta-Ct method with 18S RNA as standard as described in [42]. Following primers have been used for the analysis of expression:
18s rRNA F 5' GCT TAA TTT GAC TCA ACA CGG GA 3' 18s rRNA R 5' AGC TAT CAA TCT GTC AAT CCT GTC 3' MTOR F 5' ATT CAA TCC ATA GCC CCG TC 3' MTOR R 5' TGC ATC ACT CGT TCA TCC TG 3' DEPTOR F 5' GTG GTT CTC AGG CAT TCT ATC TC 3' DEPTOR R 5' TGG GTA GGT TTT GAG ATG GTG 3' RHEB F 5' AAG ATG CCT CAG TCC AAG TC 3' RHEB R 5' CGT GTT CTC TAT GGT TGG ATC G 3'
Cell culture
All cells were cultured in Dulbecco's modified Eagle's medium (LRI, Cleveland Clinic, Cleveland, USA) supplemented with 10 % fetal bovine serum premium (ATLANTA Biologicals, USA) and 10000 units Of Penicillin G and 10000 μg/ml streptomycin (LRI,OH,USA). Cells were maintained at 37°C in humid atmosphere with 5 % CO2 in air. To generate primary lung fibroblasts lungs isolated from WT AND Bmal1 KO mice were cut to small pieces and placed in cell growth media. After 72 hrs media were replaced and all unattached cells were removed. For serum starvation or amino acids starvation experiments cells were maintained in the media without serum or without amino acids. Cell size was analyzed by using FACSCalibur cell sorter (Becton-Dikinson). To assay cell protein contents cells were counted, equal number of cells was dissolved in fixed volume of RIPA buffer, protein concentration in extracts was analyzed using Bio-Rad Dc protein Assay kit according manufacturer's protocol. For rapamycin sensitivity assay. WT and Bmal1 −/− cells were plated in 96 well plates at a density of 1 × 10³ cells per well. 24 hrs after plating cells were treated with different concentrations of rapamycin (Sigma- Aldrich, MO,USA) for 24, 48 and 72 hrs. Cells proliferation was estimated using two independent protocols. MTT assay, incorporation and detection of MTT reagent (Sigma- Aldrich, MO,USA) was performed according to the manufacturer protocol. In independent set of experiments treated cells were fixed with 0.2 % glutaraldehyde (Fischer Scientific,USA) and stained with 0.05 % crystal violet solution. Incorporated dye was extracted with 1% SDS solution and amount was estimated as optical density at 570 nM using Victor3 1420 plate reader.
Statistical analysis
At least 4 animals for every time point, for both feeding types and for each genotype were used for all experiments. Data are shown as mean + standard deviation. SigmaStat software package was used for analysis. Effects of genotype (circadian mutants versus wild type), feeding type (AL versus TRF) and time of the day were tested for significance. Unpaired Student's t-test was used for comparison. 31 Bmal1−/− mice (both genders) were treated with rapatar and 73 Bmal1−/− mice (both genders) treated with control solution were used for the longevity experiment.. If mice need to be sacrificed according veterinarian recommendation due to morbidity or some severe pathologies, these mice were counted as alive before the day of sacrifice and as missing after the day of the sacrifice. Because the treatment was started with mice 16 weeks of age (102 days), we excluded from the consideration all animals which have died before the beginning of the treatment or animals which have died during first month of treatment in both control and treated groups. Log-rank test was used for analysis of longevity experiments. P<0.05 was considered as statistically significant difference.
Acknowledgments
This work was supported by NIH grants 1R01AG039547 and funds from GRHD (R.V.K.) and Roswell Park Alliance Foundation Funding (M.P.A.).
Conflicts of Interest
The authors of this paper declare no conflict of interests.
References
- 1. Sengupta S, Peterson TR, Sabatini DM. Regulation of the mTOR complex 1 pathway by nutrients, growth factors, and stress. Mol Cell. 2010; 40: 310 -322. [PubMed] .
- 2. Hay N and Sonenberg N. Upstream and downstream of mTOR. Genes Dev. 2004; 18: 1926 -1945. [PubMed] .
- 3. Kaeberlein M. Lessons on longevity from budding yeast. Nature. 2010; 464: 513 -519. [PubMed] .
- 4. Blagosklonny MV. Revisiting the antagonistic pleiotropy theory of aging: TOR-driven program and quasi-program. Cell Cycle. 2010; 9: 3151 -3156. [PubMed] .
- 5. Laplante M and Sabatini DM. mTOR signaling in growth control and disease. Cell. 2012; 149: 274 -293. [PubMed] .
- 6. Bass J and Takahashi JS. Circadian integration of metabolism and energetics. Science. 2011; 330: 1349 -1354. [PubMed] .
- 7. Lowrey PL and Takahashi JS. Mammalian circadian biology: elucidating genome-wide levels of temporal organization. Annual review of genomics and human genetics. 2004; 5: 407 -441. .
- 8. Grimaldi B, Nakahata Y, Kaluzova M, Masubuchi S, Sassone-Corsi P. Chromatin remodeling, metabolism and circadian clocks: the interplay of CLOCK and SIRT1. Int J Biochem Cell Biol. 2009; 41: 81 -86. [PubMed] .
- 9. Reddy AB and O'Neill JS. Healthy clocks, healthy body, healthy mind. Trends Cell Biol. 2010; 20: 36 -44. [PubMed] .
- 10. Froy O. Circadian rhythms, aging, and life span in mammals. Physiology (Bethesda). 2011; 26: 225 -235. [PubMed] .
- 11. Yu EA and Weaver DR. Disrupting the circadian clock: gene-specific effects on aging, cancer, and other phenotypes. Aging (Albany NY). 2010; 3: 479 -493. [PubMed] .
- 12. Gery S and Koeffler HP. Circadian rhythms and cancer. Cell Cycle. 2010; 9: .
- 13. Kondratov RV, Kondratova AA, Gorbacheva VY, Vykhovanets OV, Antoch MP. Early aging and age-related pathologies in mice deficient in BMAL1, the core componentof the circadian clock. Genes Dev. 2006; 20: 1868 -1873. [PubMed] .
- 14. Green CB, Takahashi JS, Bass J. The meter of metabolism. Cell. 2008; 134: 728 -742. [PubMed] .
- 15. Edgar RS, Green EW, Zhao Y, van Ooijen G, Olmedo M, Qin X, Xu Y, Pan M, Valekunja UK, Feeney KA, Maywood ES, Hastings MH, Baliga NS, Merrow M, Millar AJ, Johnson CH, Kyriacou CP, O'Neill JS, Reddy AB. Peroxiredoxins are conserved markers of circadian rhythms. Nature. 2012; 485: 459 -464. [PubMed] .
- 16. Hunt T and Sassone-Corsi P. Riding tandem: circadian clocks and the cell cycle. Cell. 2007; 129: 461 -464. [PubMed] .
- 17. Gauger MA and Sancar A. Cryptochrome, circadian cycle, cell cycle checkpoints, and cancer. Cancer Res. 2005; 65: 6828 -6834. [PubMed] .
- 18. Hardeland R, Coto-Montes A, Poeggeler B. Circadian rhythms, oxidative stress, and antioxidative defense mechanisms. Chronobiol Int. 2003; 20: 921 -962. [PubMed] .
- 19. Nakahata Y, Sahar S, Astarita G, Kaluzova M, Sassone-Corsi P. Circadian control of the NAD+ salvage pathway by CLOCK-SIRT1. Science. 2009; 324: 654 -657. [PubMed] .
- 20. Ramsey KM, Yoshino J, Brace CS, Abrassart D, Kobayashi Y, Marcheva B, Hong HK, Chong JL, Buhr ED, Lee C, Takahashi JS, Imai S, Bass J. Circadian clock feedback cycle through NAMPT-mediated NAD+ biosynthesis. Science. 2009; 324: 651 -654. [PubMed] .
- 21. Chang HC and Guarente L. SIRT1 mediates central circadian control in the SCN by a mechanism that decays with aging. Cell. 2013; 153: 1448 -1460. [PubMed] .
- 22. Brunn GJ, Fadden P, Haystead TA, Lawrence JC Jr. The mammalian target of rapamycin phosphorylates sites having a (Ser/Thr)-Pro motif and is activated by antibodies to a region near its COOH terminus. J Biol Chem. 1997; 272: 32547 -32550. [PubMed] .
- 23. Brunn GJ, Hudson CC, Sekulic A, Williams JM, Hosoi H, Houghton PJ, Lawrence JC Jr, Abraham RT. Phosphorylation of the translational repressor PHAS-I by the mammalian target of rapamycin. Science. 1997; 277: 99 -101. [PubMed] .
- 24. Gingras AC, Gygi SP, Raught B, Polakiewicz RD, Abraham RT, Hoekstra MF, Aebersold R, Sonenberg N. Regulation of 4E-BP1 phosphorylation: a novel two-step mechanism. Genes Dev. 1999; 13: 1422 -1437. [PubMed] .
- 25. Kawasome H, Papst P, Webb S, Keller GM, Johnson GL, Gelfand EW, Terada N. Targeted disruption of p70(s6k) defines its role in protein synthesis and rapamycin sensitivity. Proc Natl Acad Sci U S A. 1998; 95: 5033 -5038. [PubMed] .
- 26. Price DJ, Nemenoff RA, Avruch J. Purification of a hepatic S6 kinase from cycloheximide-treated Rats. J Biol Chem. 1989; 264: 13825 -13833. [PubMed] .
- 27. Blenis J, Kuo CJ, Erikson RL. Identification of a ribosomal protein S6 kinase regulated by transformation and growth-promoting stimuli. J Biol Chem. 1987; 262: 14373 -14376. [PubMed] .
- 28. Inoki K, Li Y, Zhu T, Wu J, Guan KL. TSC2 is phosphorylated and inhibited by Akt and suppresses mTOR signalling. Nat Cell Biol. 2002; 4: 648 -657. [PubMed] .
- 29. Hara K, Yonezawa K, Weng QP, Kozlowski MT, Belham C, Avruch J. Amino acid sufficiency and mTOR regulate p70 S6 kinase and eIF-4E BP1 through a common effector mechanism. J Biol Chem. 1998; 273: 14484 -14494. [PubMed] .
- 30. Ma L, Chen Z, Erdjument-Bromage H, Tempst P, Pandolfi PP. Phosphorylation and functional inactivation of TSC2 by Erk implications for tuberous sclerosis and cancer pathogenesis. Cell. 2005; 121: 179 -193. [PubMed] .
- 31. Bunger MK, Wilsbacher LD, Moran SM, Clendenin C, Radcliffe LA, Hogenesch JB, Simon MC, Takahashi JS, Bradfield CA. Mop3 is an essential component of the master circadian pacemaker in mammals. Cell. 2000; 103: 1009 -1017. [PubMed] .
- 32. Brown EJ, Albers MW, Shin TB, Ichikawa K, Keith CT, Lane WS, Schreiber SL. A mammalian protein targeted by G1-arresting rapamycin-receptor complex. Nature. 1994; 369: 756 -758. [PubMed] .
- 33. Sabatini DM, Erdjument-Bromage H, Lui M, Tempst P, Snyder SH. RAFT1: a mammalian protein that binds to FKBP12 in a rapamycin-dependent fashion and is homologous to yeast TORs. Cell. 1994; 78: 35 -43. [PubMed] .
- 34. Comas M, Toshkov I, Kuropatwinski KK, Chernova OB, Polinsky A, Blagosklonny MV, Gudkov AV, Antoch MP. New nanoformulation of rapamycin Rapatar extends lifespan in homozygous p53−/− mice by delaying carcinogenesis. Aging (Albany NY). 2012; 4: 715 -722. [PubMed] .
- 35. Kondratov RV, Vykhovanets O, Kondratova AA, Antoch MP. Antioxidant N-acetyl-L-cysteine ameliorates symptoms of premature aging associated with the deficiency of the circadian protein BMAL1. Aging (Albany NY). 2009; 1: 979 -987. [PubMed] .
- 36. Jouffe C, Cretenet G, Symul L, Martin E, Atger F, Naef F, Gachon F. The circadian clock coordinates ribosome biogenesis. PLoS Biol. 2013; 11: e1001455 [PubMed] .
- 37. Ma D, Panda S, Lin JD. Temporal orchestration of circadian autophagy rhythm by C/EBPbeta. EMBO J. 2011; 30: 4642 -4651. [PubMed] .
- 38. Zheng X and Sehgal A. AKT and TOR signaling set the pace of the circadian pacemaker. Curr Biol. 20: 1203 -1208. [PubMed] .
- 39. Giebultowicz J and Kapahi P. Circadian clocks and metabolism: the nutrient-sensing AKT and TOR pathways make the link. Curr Biol. 20: R608 -609. [PubMed] .
- 40. Dubrovsky YV, Samsa WE, Kondratov RV. Deficiency of circadian protein CLOCK reduces lifespan and increases age-related cataract development in mice. Aging (Albany NY). 2010; 2: 936 -944. [PubMed] .
- 41. Batrakova EV and Kabanov AV. Pluronic block copolymers: evolution of drug delivery concept from inert nanocarriers to biological response modifiers. J Control Release. 2008; 130: 98 -106. [PubMed] .
- 42. Kondratov RV, Shamanna RK, Kondratova AA, Gorbacheva VY, Antoch MP. Dual role of the CLOCK/BMAL1 circadian complex in transcriptional regulation. FASEB J. 2006; 20: 530 -532. [PubMed] .