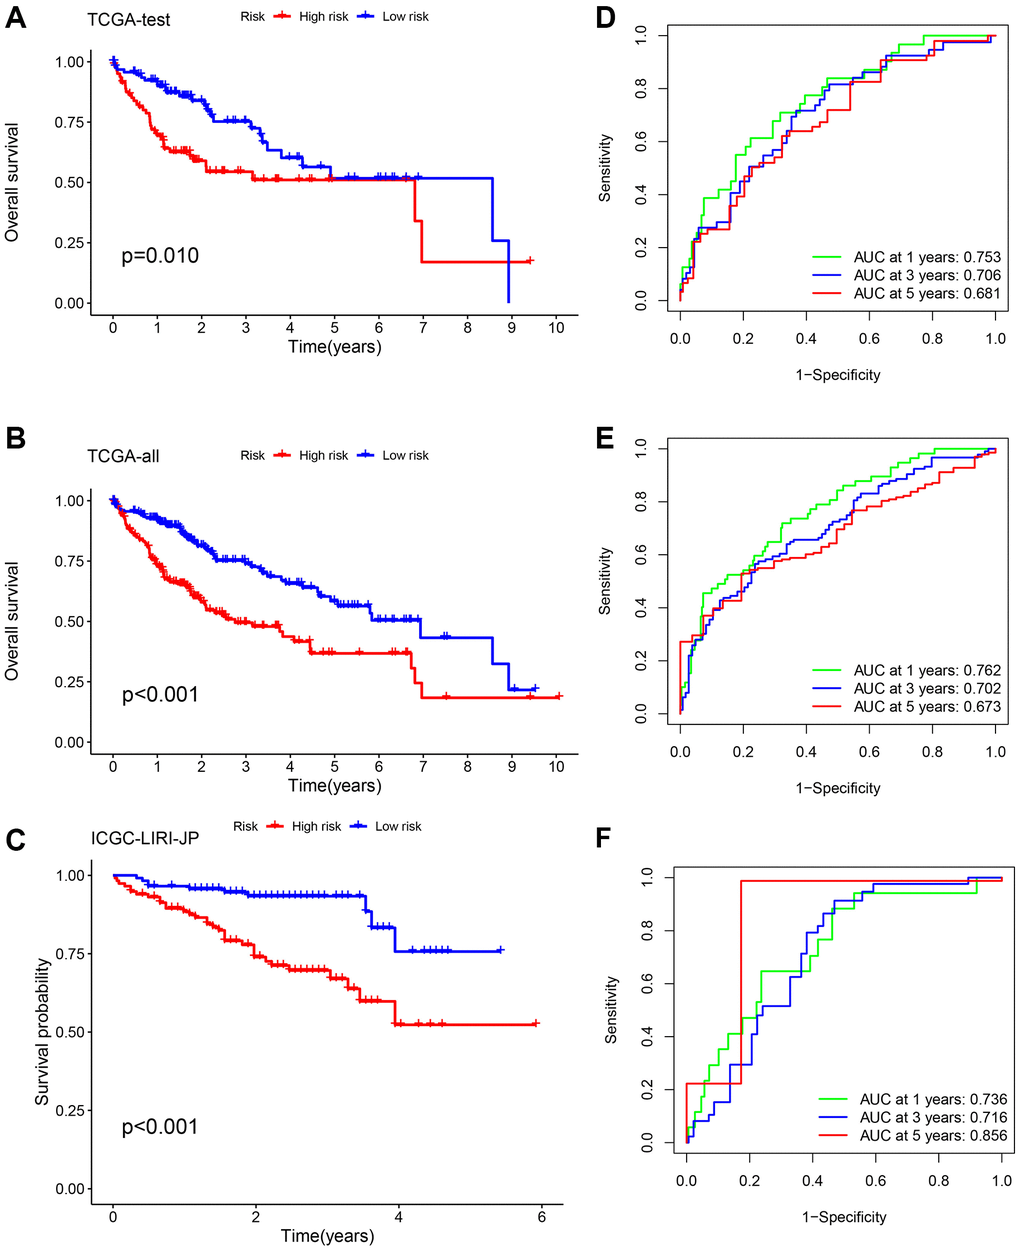
Figure 4.Validation of the risk signature. Survival analysis using the K-M method was performed on three different sets: the TCGA-test set (A, D), the TCGA-all set (B, E), and the ICGC-LIRI-JP set (C, F). To assess the precision of the signature, we utilized ROC curves for 1-, 3-, and 5-year intervals.