Submit an Article
Navigate
Home
Editorial Board
Editorial Policies
Current Volume
Archive
Scientific Integrity
Publication Ethics Statements
Interviews with Outstanding Authors
Newsroom
Sponsored Conferences
Podcast
Contact
Special Collections
Submit an Article
Online ISSN: 1945-4589
Research Paper
|
Volume 16, Issue 5
|
pp. 4169–4190
RAB22A as a predictor of exosome secretion in the progression and relapse of multiple myeloma
Back to article
Figure 9
(9 of 11)
−
100%
+
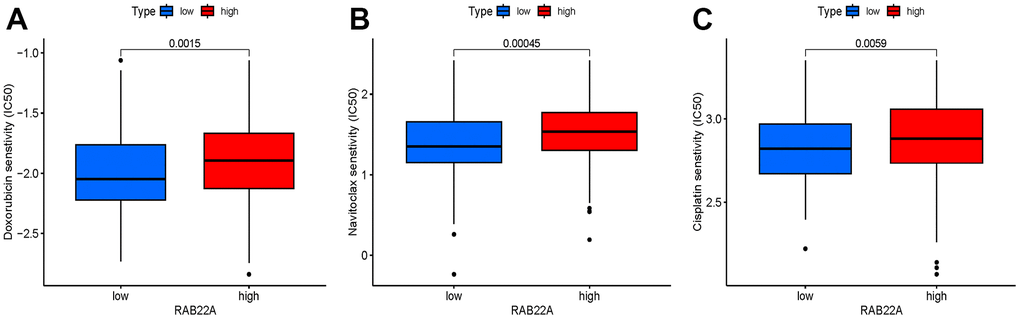
Figure 9.
(
A
–
C
) Drugs with significantly different IC50 values between high and low RAB22A groups.