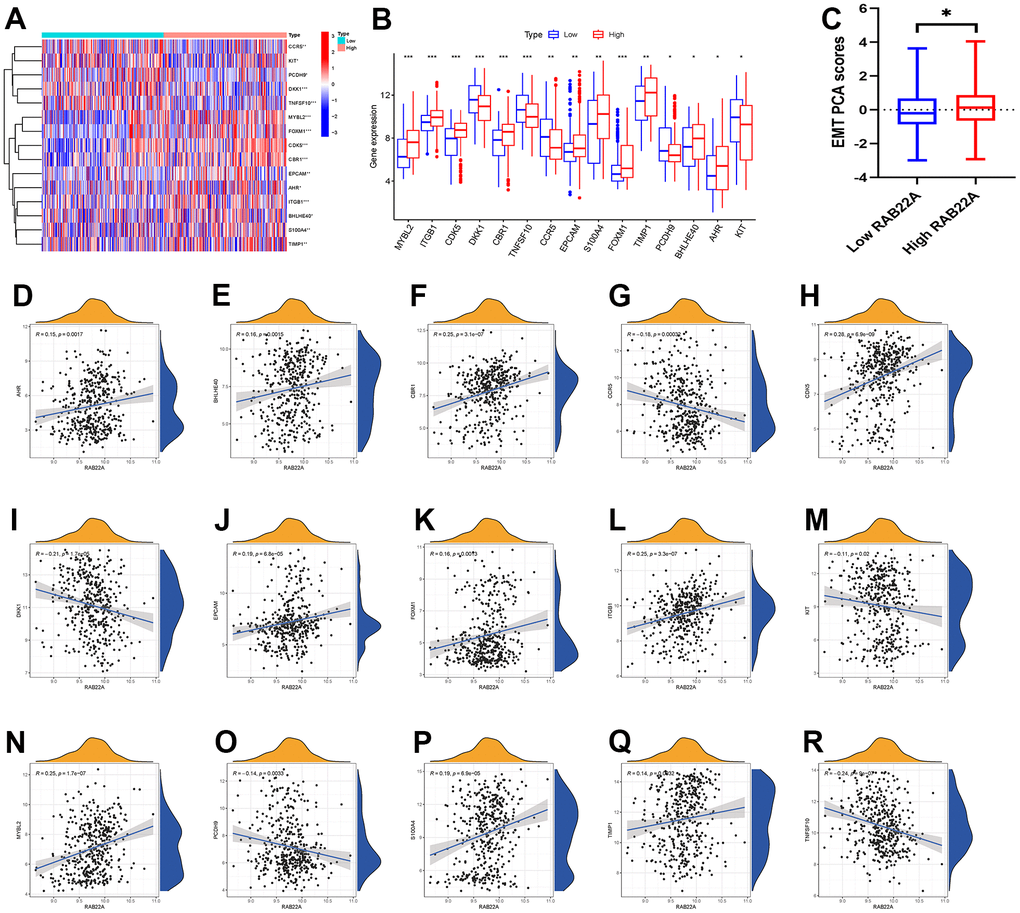
Figure 3.Correlation analysis between RAB22A and EMT. (A, B) EMT-related genes with significantly different expression levels between high and low RAB22A groups. (C) EMT scores of high and low RAB22A groups were calculated. (D–R) Scatterplots and correlation of RAB22A and EMT-related genes.