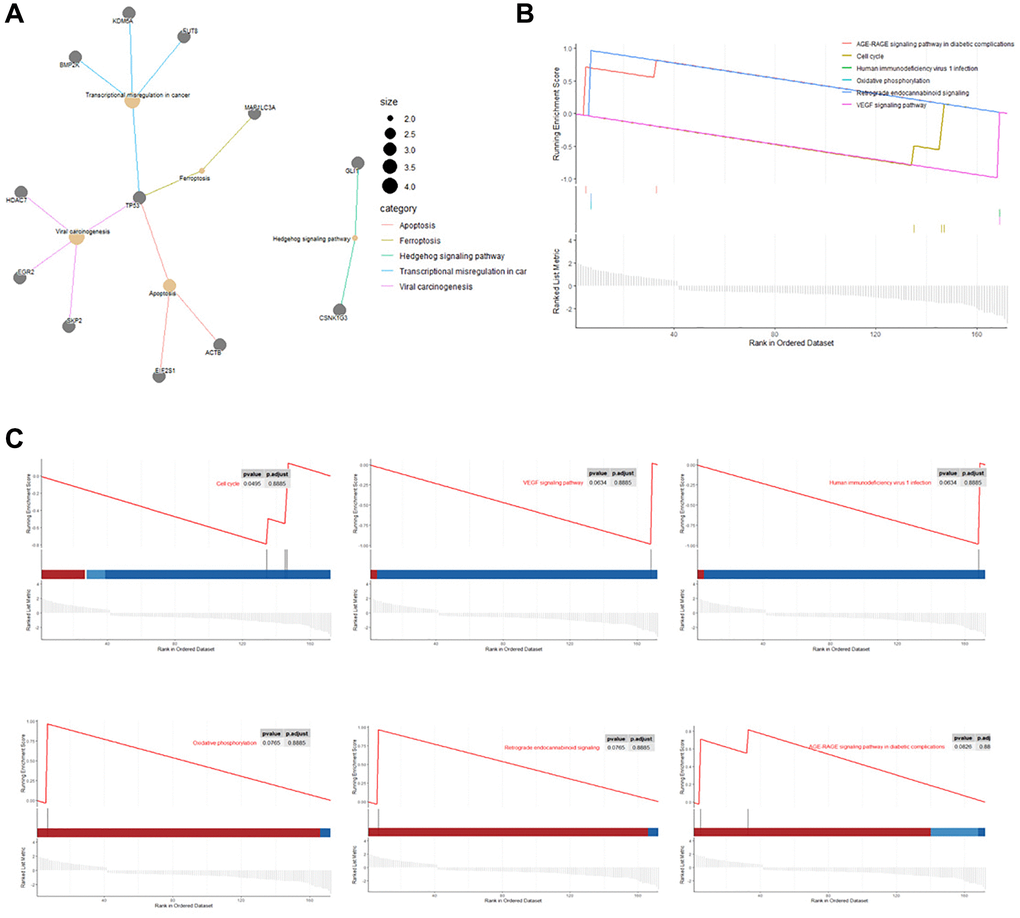
Figure 5.KEGG network and Gene set enrichment analysis (GSEA). (A) Cnetplot of the relationship between genes and KEGG terms (Size: Number of genes associated with KEGG pathway). (B, C) Gene set enrichment analysis results exhibited the top six enriched pathways.