Submit an Article
Navigate
Home
Editorial Board
Editorial Policies
Current Volume
Archive
Scientific Integrity
Publication Ethics Statements
Interviews with Outstanding Authors
Newsroom
Sponsored Conferences
Podcast
Contact
Special Collections
Submit an Article
Online ISSN: 1945-4589
Research Paper
|
Volume 16, Issue 1
|
pp. 948–963
Global burden, risk factors, clinicopathological characteristics, molecular biomarkers and outcomes of microsatellite instability-high gastric cancer
Back to article
Figure 1
(1 of 3)
−
100%
+
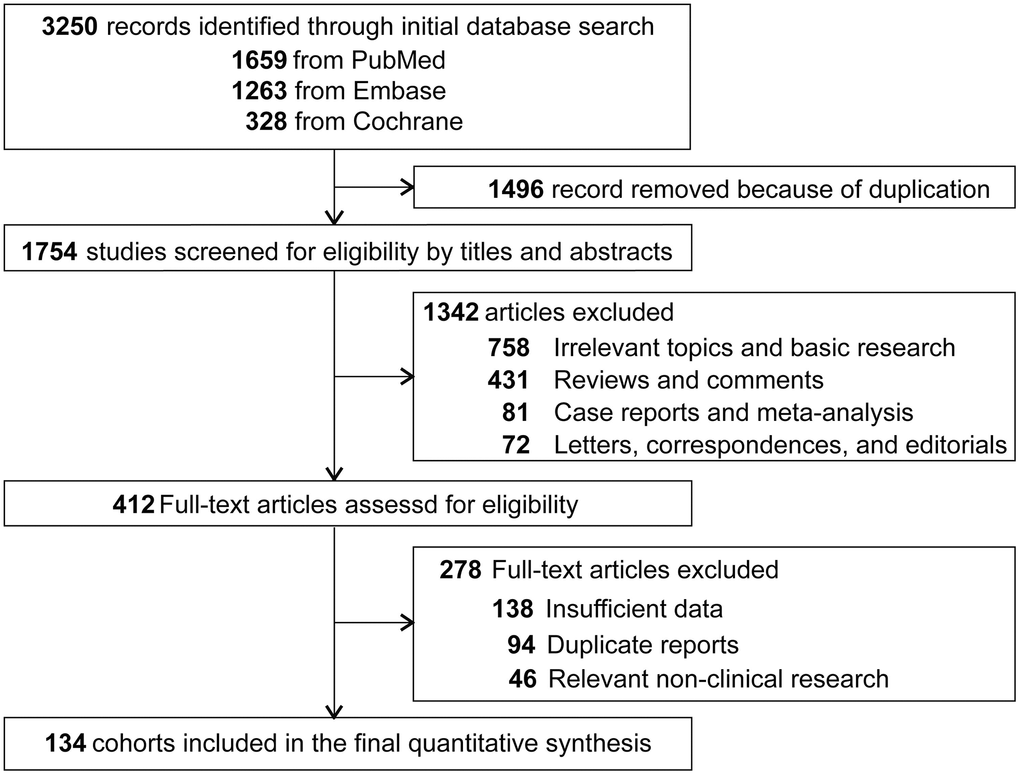
Figure 1.
Flowchart diagram of selected cohorts included in this study.
Figure 1 — Global burden, risk factors, clinicopathological characteristics, molecular biomarkers and outcomes of microsatellite instability-high gastric cancer | Aging