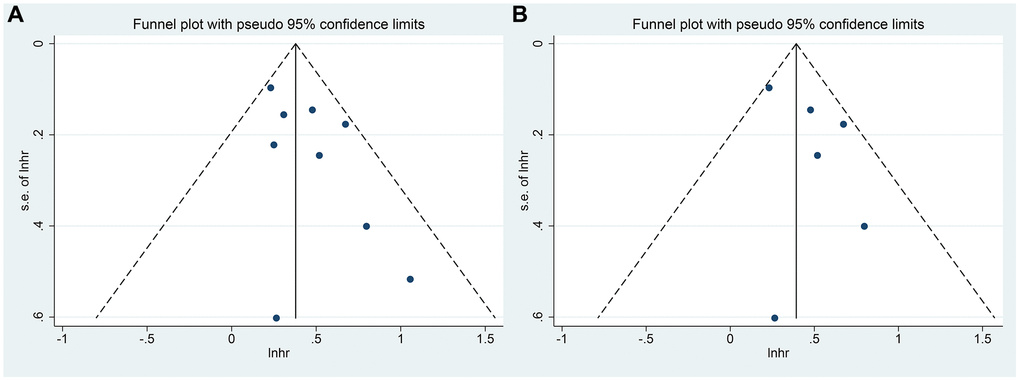
Figure 6.(A) The funnel plot of the impact of sarcopenia on OS in TAE or TACE treated HCC patients; (B) The funnel plot of the impact of SMI on OS in TAE or TACE treated HCC patients.
Figure 6 — The predictive value of sarcopenia and myosteatosis in trans-arterial (chemo)-embolization treated HCC patients | Aging