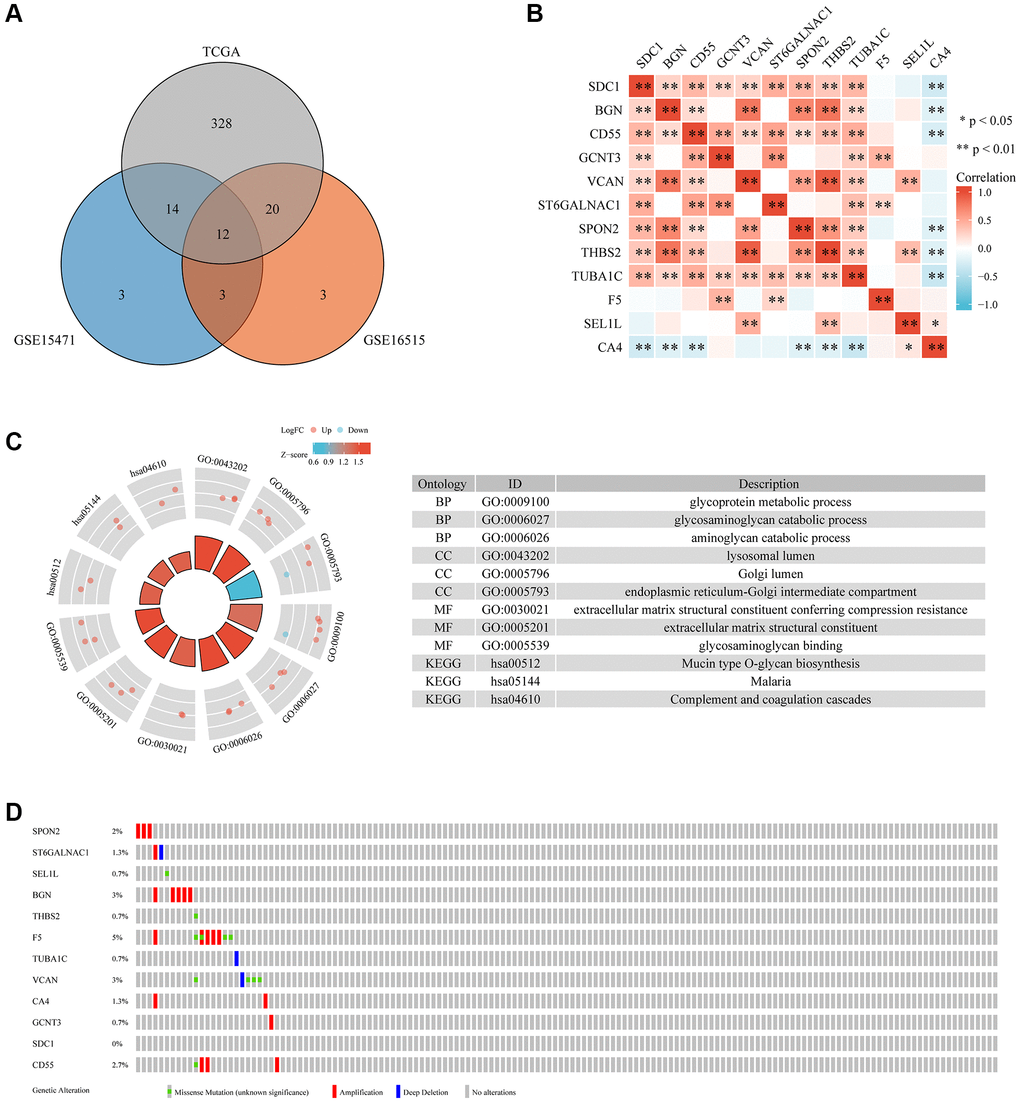
Figure 1.The differential expression, interaction, functional enrichment, and mutant landscape analysis of GRGs in PC. (A) Genes differentially expressed between TCGA and GEO. (B) A heatmap showing the correlations between 12 GRGs. (C) GO and KEGG analysis of 12 GRGs in PC. (D) Mutant landscape of 12 GRGs.