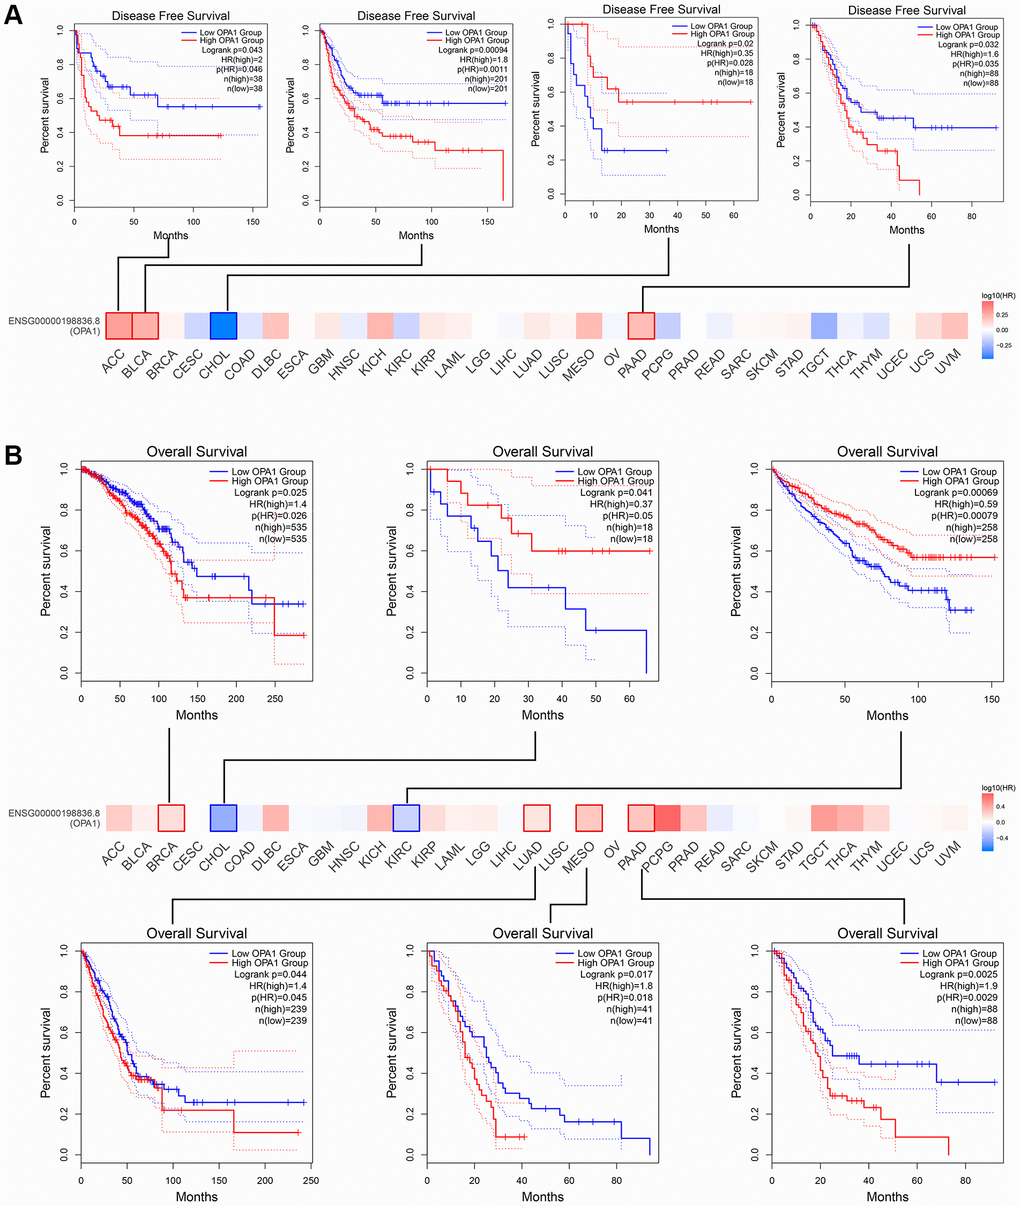
Figure 4.The prognosis comparison of tumor patients in the OPA1 high expression group and the low expression group, analyzed by GEPIA. (A) Disease-free survival and (B) overall survival.
Figure 4 — Multi-omics analysis of the oncogenic role of optic atrophy 1 in human cancer | Aging