Submit an Article
Navigate
Home
Editorial Board
Editorial Policies
Current Volume
Archive
Scientific Integrity
Publication Ethics Statements
Interviews with Outstanding Authors
Newsroom
Sponsored Conferences
Podcast
Contact
Special Collections
Submit an Article
Online ISSN: 1945-4589
Research Paper
|
Volume 15, Issue 22
|
pp. 12982–12997
Multi-omics analysis of the oncogenic role of optic
atrophy 1
in human cancer
Back to article
Figure 3
(3 of 7)
−
100%
+
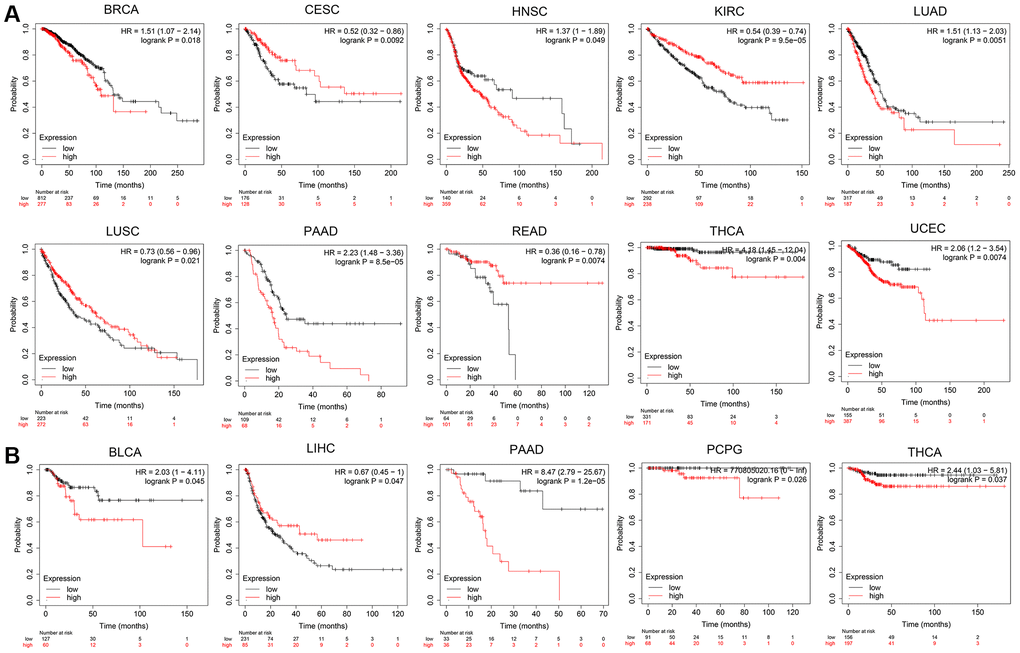
Figure 3.
The prognosis comparison of tumor patients in the
OPA1
high expression group and the low expression group, analyzed by Kaplan-Meier plotter.
(
A
) Overall survival and (
B
) relapse-free survival.