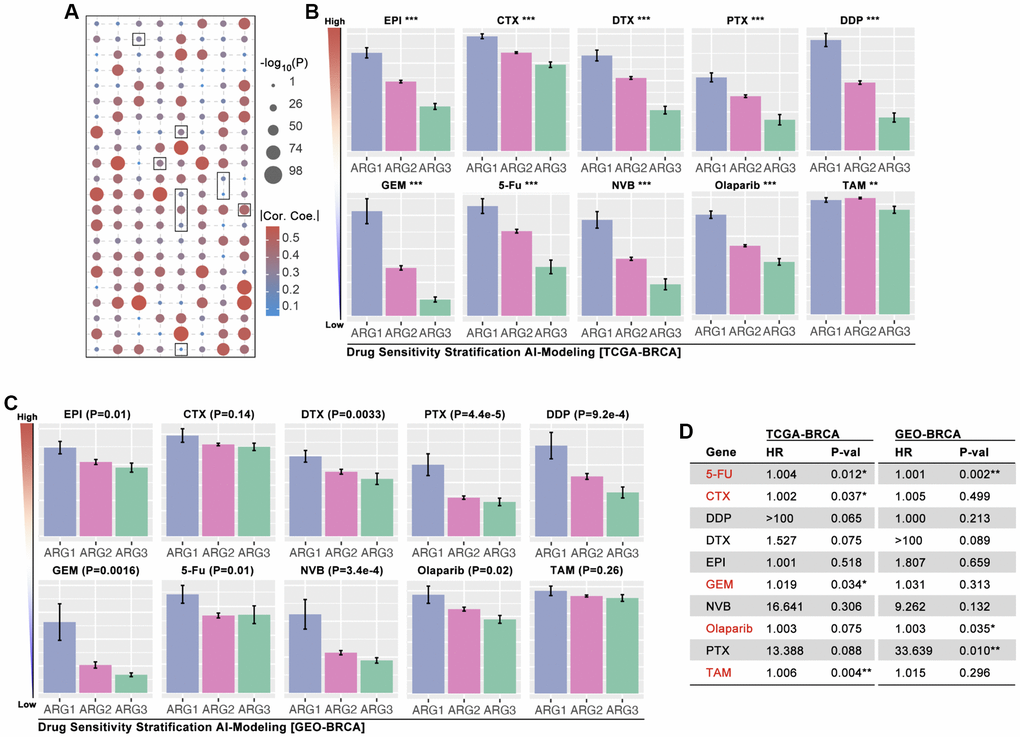
Figure 6.AI-based drug sensitivity stratification. (A) Correlation between drug score and anoikis pathway score, in which selected one are EPI, CTX, DTX, PTX, DDP, GEM, 5-Fu, NVB, Olaparib, and TAM (data from TCGA). (B) Drug score differences amongst ARG subgroups of BRCA (* means p < 0.05, ** means p < 0.01, *** means p < 0.001, data from TCGA). (C) Drug score differences amongst ARG subgroups of BRCA (data from GES20685, GSE42568, GSE58812). (D) HR of drug scores in TCGA cohort and GEO cohort of BRCA.